Nonfarm Payrolls (NFP) Guide: Market Impact Explained

Updated: 2026/06/22  |  CashbackIsland

non-farm-payroll-guide

The Complete Guide to Non-Farm Payrolls (NFP) Data: Do You Really Understand the Monthly Market Shockwave?

On the first Friday of every month, traders and investors around the world focus on a single report, the “US Non-Farm Payrolls (NFP)” report. This report has enormous market-moving power and often triggers sharp swings in the US dollar, gold, and stock markets the moment it is released. However, many people only know whether the headline number is good or bad, without understanding its deeper significance. This complete guide to NFP data will teach you from the ground up how to interpret the NFP report and master the trading rhythm surrounding the NFP release time, so you no longer miss the market’s biggest monthly opportunity. 


What Is US Non-Farm Payrolls (NFP) Data?

US Non-Farm Payrolls (NFP), officially known as Non-Farm Payrolls, is a key economic indicator published by the US Bureau of Labor Statistics (BLS). It measures the monthly change in employment across all industries in the US, excluding agriculture, government, private households, and nonprofit organizations. The report forms the core of the “Employment Situation Summary”.


Definition: An Employment Indicator Excluding Agricultural Workers

Why are agricultural workers excluded? There are two main reasons:

  • Strong seasonal factors: Agricultural employment is heavily affected by weather and seasonal patterns. Including it would distort overall employment trends and make it harder to accurately assess the underlying health of the economy.
  • A better reflection of business cycles: Employment in non-farm industries, such as manufacturing, construction, and services, provides a more direct measure of business activity and consumer demand in the US economy.

For this reason, NFP data is regarded as one of the most direct and timely indicators of the overall health of the US economy.


Who Releases the Report? When Is It Released?

Understanding the NFP release time is the first step in preparing for the event. This important report is compiled and released by the US Bureau of Labor Statistics (BLS).

  • Release date: Usually on the first Friday of every month.
  • Release time: 8:30 AM US Eastern Time (8:30 PM or 9:30 PM Taiwan/Malaysia time, depending on daylight saving time).

This release attracts worldwide attention because it often sets the tone for market sentiment over the following month. Many forex traders refer to this period as “NFP Night”. 


Why Is NFP a Key Indicator of the US Economy?

NFP is important because it directly reflects whether US businesses are expanding or contracting. When companies are optimistic about the economic outlook, they hire more workers, pushing NFP higher. Conversely, when confidence weakens, hiring slows, resulting in weaker employment figures. The importance of the report can be seen from several perspectives.

  1. The Federal Reserve’s “canary in the coal mine”: The Federal Reserve has two primary objectives, “maximum employment” and “price stability”. NFP is the most direct measure of its employment mandate. Strong employment data may encourage the Federal Reserve to adopt tighter monetary policy (such as raising interest rates) to contain inflation, while weak data may support a more accommodative stance (including rate cuts) to stimulate economic growth.
  2. A barometer of consumer confidence: A healthy labor market means more households have stable income, directly supporting consumer spending and overall economic growth.
  3. A global market benchmark: As the world’s largest economy, the health of the US economy influences global capital flows. A strong NFP report tends to attract capital into US dollar-denominated assets, creating ripple effects across the foreign exchange, equity, and commodity markets.

一張示意圖,展示美國非農數據如何影響貨幣政策、消費信心和全球市場。

Non-Farm Payrolls (NFP) Data Is a Key Hub Influencing the Macroeconomy.


Further Reading (Highly Recommended)

The Ultimate Guide to Forex Fundamental Analysis 2025: From Economic Data to Central Bank Decisions…

What Is the Consumer Price Index (CPI)? Why It Is a Key Indicator Every Trader Must Watch…


The Three Key Components of the NFP Report

Many beginners focus solely on the headline payroll number when learning how to interpret the NFP report, but that alone is far from sufficient. A complete NFP report contains three core figures that should always be analyzed together to reach a meaningful conclusion.

非農報告的三大核心數據:非農業就業人數、失業率和平均時薪。

Master These Three Core Figures to Fully Interpret the NFP Report.


Change in Non-Farm Payrolls: The Impact of Beating or Missing Expectations

This is the most closely watched figure in the report, representing the number of jobs added or lost compared with the previous month. Market reactions are generally driven not by whether the number is absolutely high or low, but by the difference between the “actual result” and “market expectations”.

  • Higher than expected (Beat): Usually interpreted as a sign of a strong US economy and a healthy labor market. This strengthens expectations of Federal Reserve rate hikes, supports the US dollar, and may weigh on gold and US equities (as tighter monetary policy is generally unfavorable for risk assets).
  • Lower than expected (Miss): Generally viewed as a signal that the economy is slowing. Markets may anticipate a more accommodative Federal Reserve policy, making the outcome bearish for the US dollar and potentially bullish for gold (due to its safe-haven appeal) and US equities (due to improved liquidity conditions).


Unemployment Rate: Reflecting Long-Term Labor Market Trends

The unemployment rate measures the percentage of unemployed individuals within the total labor force. It reflects the long-term health of the labor market. Generally, a steadily declining unemployment rate is considered strong evidence of economic recovery. However, this figure should always be interpreted alongside the labor force participation rate (as discussed later in the section on common misconceptions).


Average Hourly Earnings Growth: A Leading Indicator of Inflation

Average Hourly Earnings Growth measures the pace of wage growth and is widely regarded as a leading indicator of inflation. If wages rise too quickly, businesses face higher labor costs, which may be passed on to consumers, ultimately increasing inflationary pressure. Therefore:

  • Higher-than-expected wage growth: Increases inflation concerns, potentially prompting a more hawkish Federal Reserve stance and supporting the US dollar.
  • Lower-than-expected wage growth: Suggests easing inflationary pressure, reducing the need for aggressive monetary tightening and potentially weakening the US dollar.

In some cases, even if payroll growth falls short of expectations, strong wage growth may still be interpreted as a “hawkish” signal, causing the US dollar to strengthen instead of weaken.


How to Interpret the Market Impact of NFP Data

After understanding the key components of the report, the next step is connecting them with market reactions. The impact of NFP data on gold, the US dollar, and the stock market is one of the primary concerns for traders.

Data Outcome Market Interpretation Impact on the US Dollar Impact on Gold Impact on the Stock Market
Better Than Expected

(Payrolls ↑, Unemployment Rate ↓, Average Hourly Earnings ↑)

Strong Economy, Increased Expectations for Rate Hikes Strengthens (Bullish) Comes Under Pressure (Bearish) May Decline (Concerns Over Tighter Monetary Policy)
Worse Than Expected

(Payrolls ↓, Unemployment Rate ↑, Average Hourly Earnings ↓)

Weak Economy, Increased Expectations for Rate Cuts Weakens (Bearish) Supported (Bullish) May Rise (Expectations of Easier Monetary Policy)
In Line With Expectations Uncertainty Removed, Market Focus Shifts Elsewhere Short-Term Consolidation Short-Term Consolidation Determined by Other Factors

一張對比圖,顯示非農數據好於預期和差於預期時對美元、黃金和股市的影響。

Typical Relationship Between NFP Data and Market Reactions


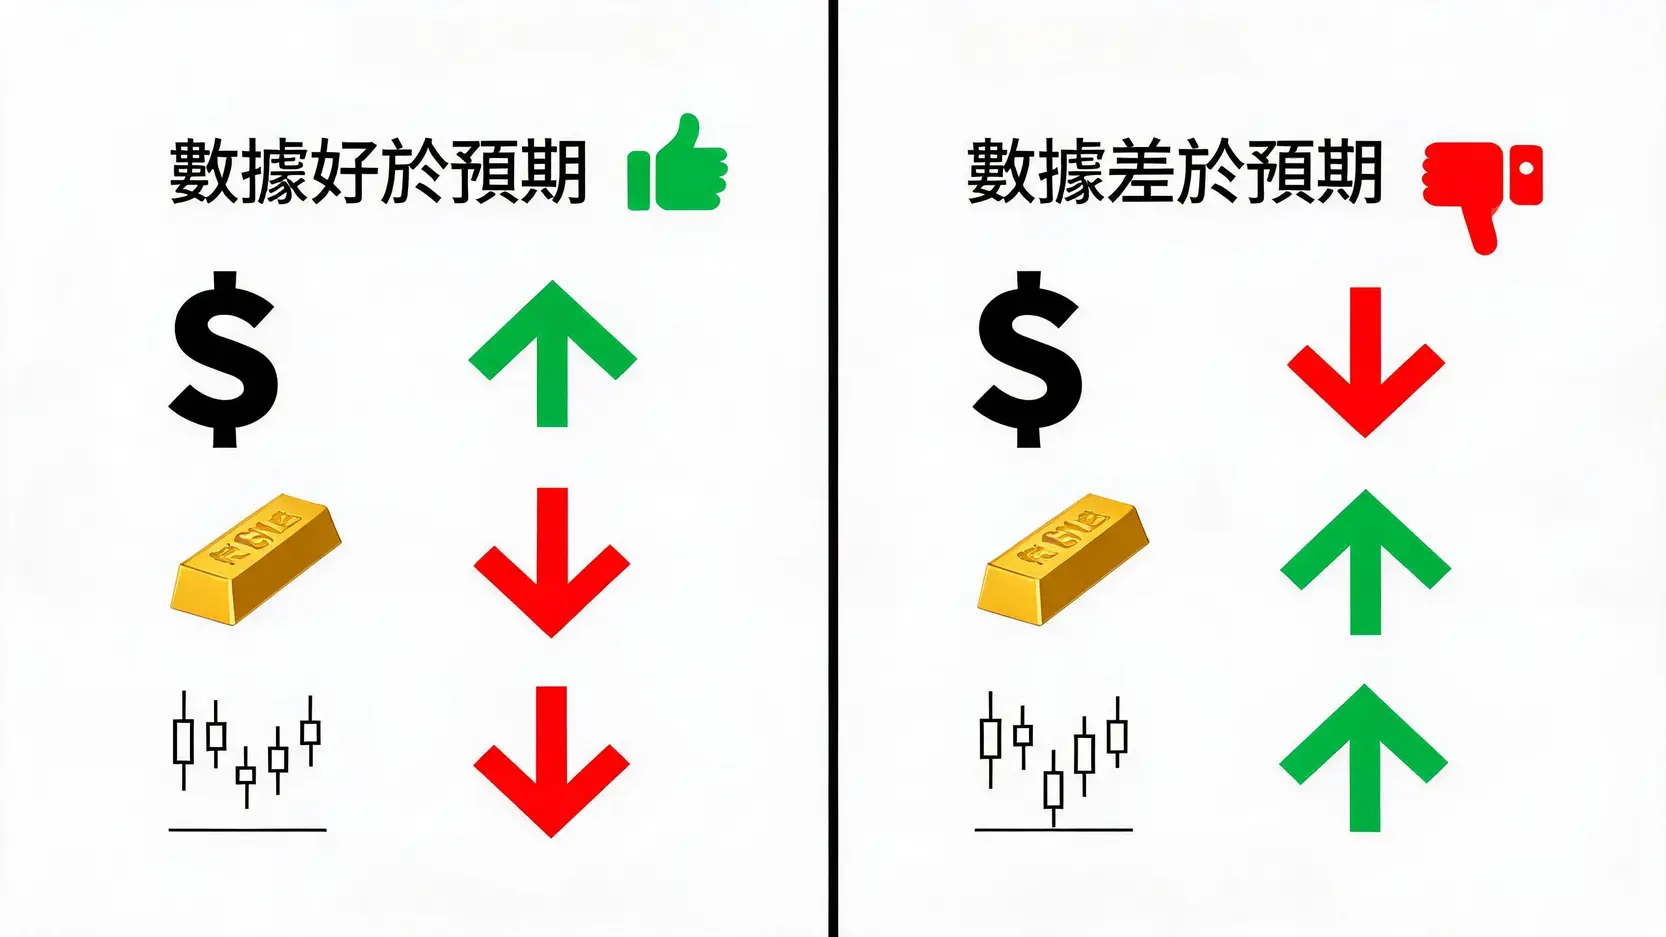
Better-Than-Expected Data: Bullish for the US Dollar, Bearish for Gold?

This is the classic market scenario. Strong NFP data signals that the US economy is operating at full strength, attracting global capital into US dollar-denominated assets and pushing the US dollar higher. Gold, as a non-yielding asset priced in US dollars, typically comes under pressure from both a stronger US dollar and rising expectations of interest rate hikes (which increase the opportunity cost of holding gold).


Worse-Than-Expected Data: The US Dollar Comes Under Pressure, but How Does the Stock Market React?

When the data falls well short of expectations, markets may worry that the economy is heading toward a recession. This weakens the case for Federal Reserve rate hikes and may even increase expectations of future rate cuts. As a result, the US dollar typically declines. The stock market’s reaction, however, is more complex. On one hand, recession concerns are bearish for equities. On the other hand, expectations that the central bank will inject more liquidity to support the economy are bullish. Ultimately, the market’s direction depends on which factor investors focus on more.


In-Line Data: Why Is the Market Sometimes Relatively Calm?

If the released data closely matches market expectations, it generally means the information has already been priced in. In this situation, uncertainty is removed, and price volatility may quickly subside. Traders will then shift their attention to other details within the report, such as revisions to previous figures, sector-specific employment trends, or the next major economic indicator

Three Common Mistakes When Interpreting NFP Data

Focusing only on the headline number can easily lead to incorrect conclusions. Experienced traders pay close attention to several often-overlooked details, which are frequently the true drivers of market direction.


Mistake 1: Looking Only at Payrolls While Ignoring Revisions

When releasing the current month’s report, the Bureau of Labor Statistics also revises the previous two months’ data. Sometimes, even if the latest payroll figure misses expectations, substantial upward revisions to the previous two months may lead the market to interpret the overall report positively. The opposite is also true. Always pay attention to revisions.


Mistake 2: Ignoring Changes in the Labor Force Participation Rate

The Labor Force Participation Rate measures the percentage of the adult population (that is either employed or actively seeking work). It provides important context for interpreting the unemployment rate. For example:

  • A lower unemployment rate combined with a lower labor force participation rate: This may not be a positive signal. It could indicate that unemployment has fallen simply because many people have stopped looking for work (and left the labor force), rather than because they found jobs.
  • A higher unemployment rate combined with a higher labor force participation rate: This is not necessarily negative. It may indicate that improving economic prospects have encouraged people who previously stopped looking for work to re-enter the labor force, temporarily pushing the unemployment rate higher.


Mistake 3: Treating the ADP Employment Report as Equivalent to NFP

The ADP National Employment Report, commonly referred to as the “ADP Employment Report”, is typically released on the Wednesday before NFP. It measures private-sector employment only. Although it is widely viewed as a leading indicator for NFP, the two reports are based on different data sources and methodologies, and their results often differ significantly. ADP data can serve as a useful reference, but it should never be treated as the sole basis for forecasting NFP. Assuming the two reports are interchangeable is a common mistake among beginners.


Practical Guide: How to Prepare for NFP Night

When trading around a high-volatility event such as the NFP release, thorough preparation and disciplined risk management are essential. Below are several practical steps.


Monitor the Consensus Forecast and Previous Reading

Before the report is released, major financial media outlets and institutions publish the market consensus forecast. Your first step is to understand:

  • Previous: What was last month’s reported figure?
  • Forecast: What is the market expecting this month?

These figures provide the benchmark for determining whether the actual result is considered “strong” or “weak”. Remember, markets trade “expectations”, not absolute numbers.


Establish a Sound Risk Management Strategy

Market volatility during NFP releases is extremely high. Slippage and wider spreads are common. As a result, risk management becomes even more important.

  • Reduce position size: Trade with smaller positions than usual during the release.
  • Set stop-loss and take-profit orders in advance: Define your Stop Loss and Take Profit levels before the announcement to avoid making emotional decisions during sharp price swings.
  • Avoid chasing the market: During the first few minutes after the release, prices often experience rapid whipsaws. Chasing upward or downward moves can easily result in losses. It is generally better to wait until the market establishes a clearer direction before entering a position.


Further Reading (Highly Recommended)

NFP Trading Guide: Three Gold Trading Strategies Around the NFP Release

[Forex Beginner’s Guide] From Zero to One: Master the Fundamentals of Forex Trading!


Frequently Asked Questions (FAQ)

Q: What Is the ADP Employment Report, and How Is It Related to NFP?

A: The ADP Employment Report, commonly referred to as the “ADP Employment Report”, is a private-sector employment report published by Automatic Data Processing (ADP). It is typically released two days before the official Non-Farm Payrolls (NFP) report. It is widely regarded as a leading indicator of NFP because both reports measure labor market conditions. However, they use different data samples and methodologies (The ADP report covers only ADP’s private-sector clients, while NFP has much broader coverage). As a result, the two reports often differ and should not be considered equivalent.

Q: How Long Does Market Volatility Usually Last After the NFP Release?

A: The most intense market volatility typically occurs within the first few seconds to several minutes after the data is released. The initial reaction generally lasts around 15 to 30 minutes. The market then enters a period of interpretation and reassessment, with elevated volatility potentially continuing for several hours. In some cases, the market trend established by the NFP report may influence price action for several days or even weeks.

Q: Where Can I Find the Latest NFP Data?

A: The most authoritative and primary source is the official website of the US Bureau of Labor Statistics (BLS), which publishes the report. In addition, major financial news organizations such as Reuters and Bloomberg, as well as many financial news apps and forex trading platforms, provide live coverage and publish the results immediately after release.

Q: Why Does the US Dollar Sometimes Fall Even When NFP Data Is Strong?

A: This phenomenon is commonly known as “Sell the Fact”. It may occur when the market has already fully anticipated strong data, causing the US dollar to appreciate before the release. Once the data is published, even if the results are strong, traders may take profits because the positive news has already been priced in, causing the US dollar to decline instead of rise. In addition, other details within the report (such as weaker-than-expected wage growth or downward revisions to previous figures) may offset the positive impact of stronger payroll growth.


Conclusion

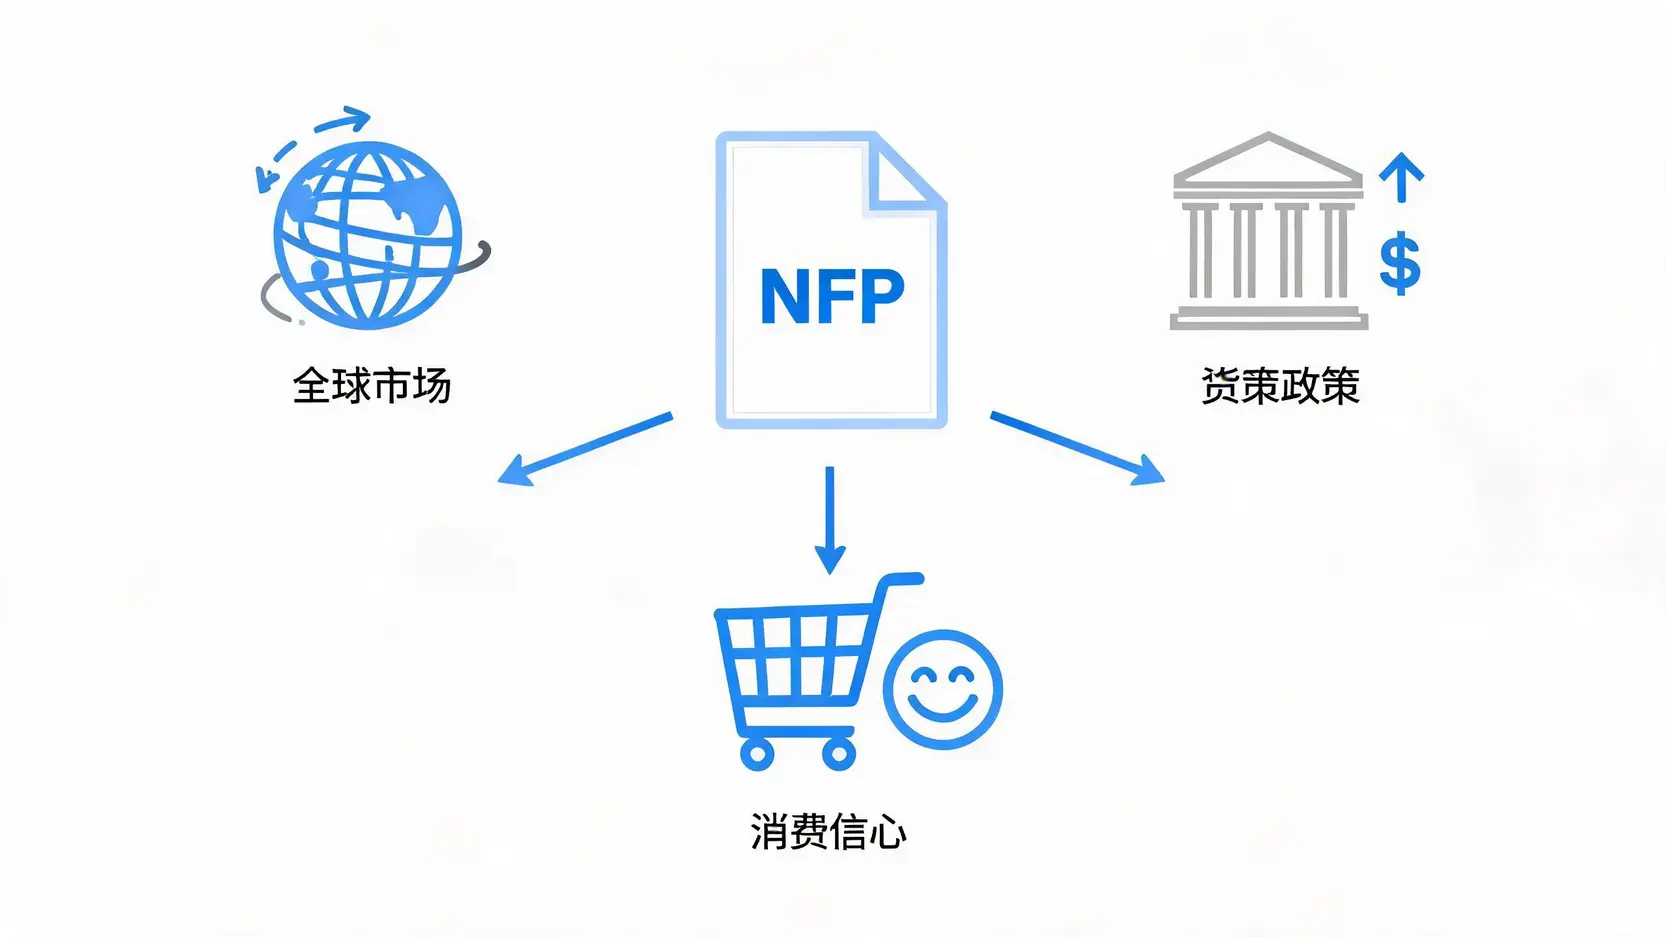
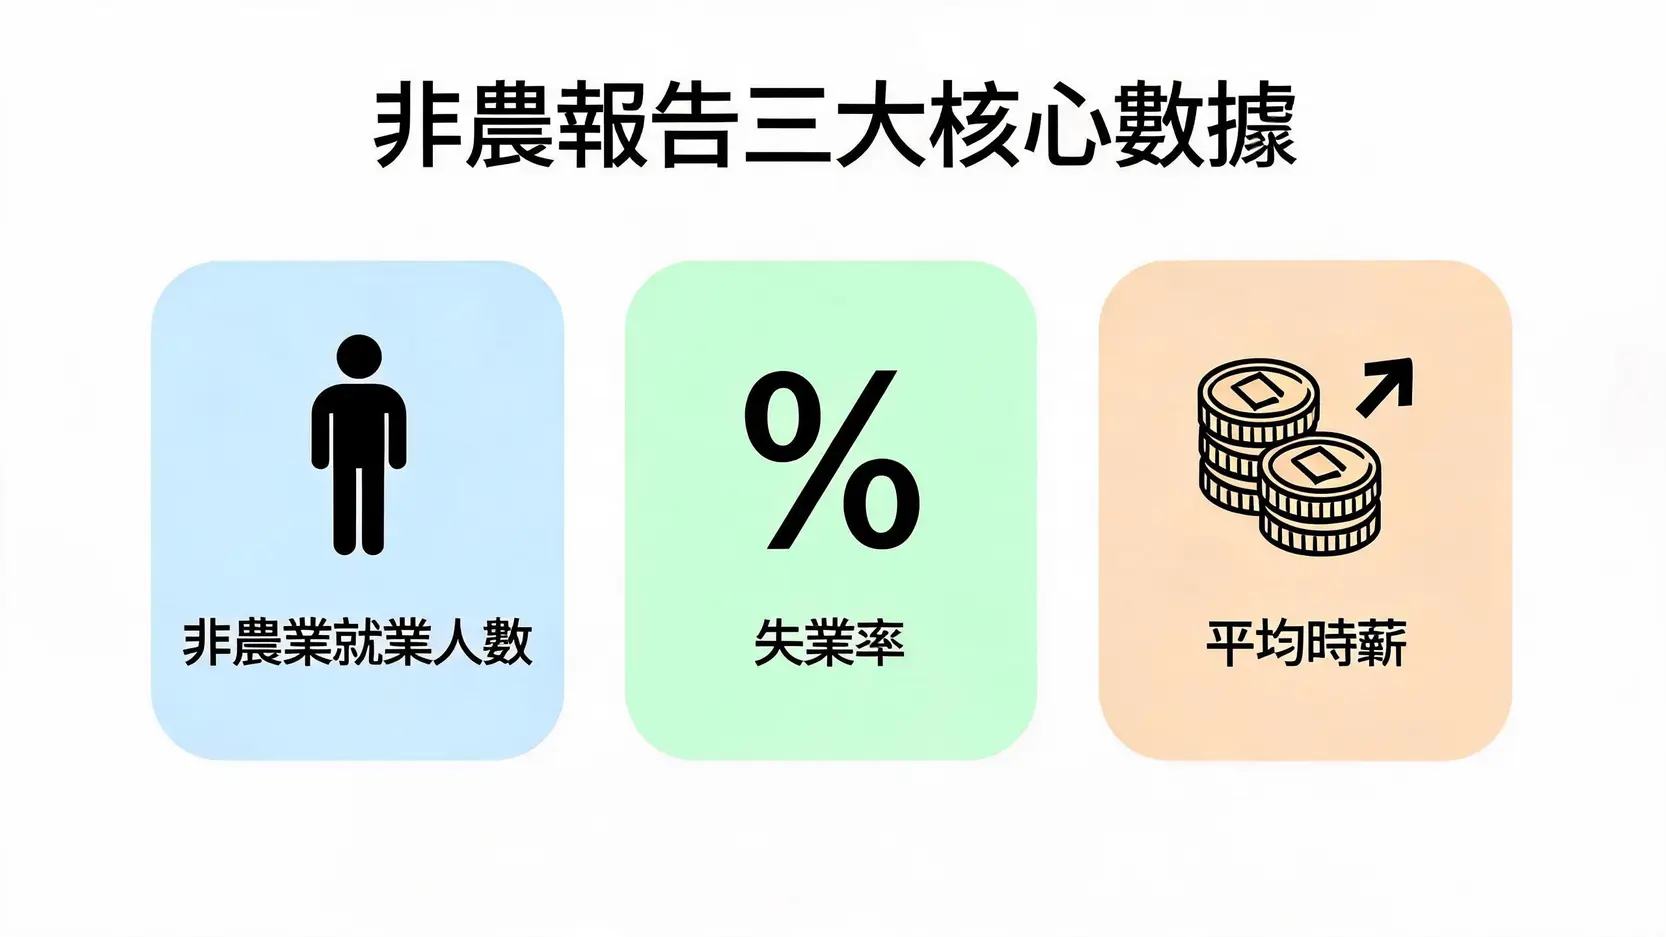
In summary, US Non-Farm Payrolls (NFP) data is much more than a single economic figure. It is a vital tool for understanding the health of the US economy, anticipating Federal Reserve policy, and assessing market sentiment. To navigate the financial markets successfully, you must learn how to interpret the report comprehensively rather than focusing solely on the headline number. By understanding its three core components (payroll growth, the unemployment rate, and average hourly earnings) while avoiding common analytical mistakes (involving revisions, the labor force participation rate, and the distinction between ADP and NFP), you will be better equipped to make informed and forward-looking decisions during the market’s biggest monthly event. Incorporating NFP analysis into your trading framework is an essential step in progressing from a beginner to an experienced trader.

If you liked this article, please share it!

Related Articles

  • Japan Investment Risks: 5 Hidden Risks Beyond the Yen
    Essential Reading on Japan Investment Risks: Five Potential Risks You May Not Know Besides Yen Depreciation Driven by the historic depreciation of the yen, global capital is flowing into Japan with unprecedented enthusiasm. Both the stock market and the real estate market are showing a thriving picture. The market is...
    2026 年 6 月 23 日
  • Gold Price Outlook 2026: Will the Bull Market Continue?
    Will the Gold Price Bull Market Continue? 2026 XAUUSD Trend Analysis, Experts Reveal Three Key Drivers Recently, gold prices have repeatedly hit new highs, and the market is actively debating whether gold has entered a new historic gold price bull market. Many investors are both excited and concerned, wondering how...
    2026 年 6 月 23 日
  • XAUUSD Trading Guide: Trends & Beginner Strategies
    Ultimate Guide to Trading XAUUSD Trends: From Candlestick Teaching to Practical Strategies for Stable Profits for Beginners XAUUSD (spot gold against the US dollar), as one of the world’s most popular trading instruments, offers abundant profit opportunities through its sharp price fluctuations, but also comes with considerable risk. Many beginners...
    2026 年 6 月 23 日
返回顶部