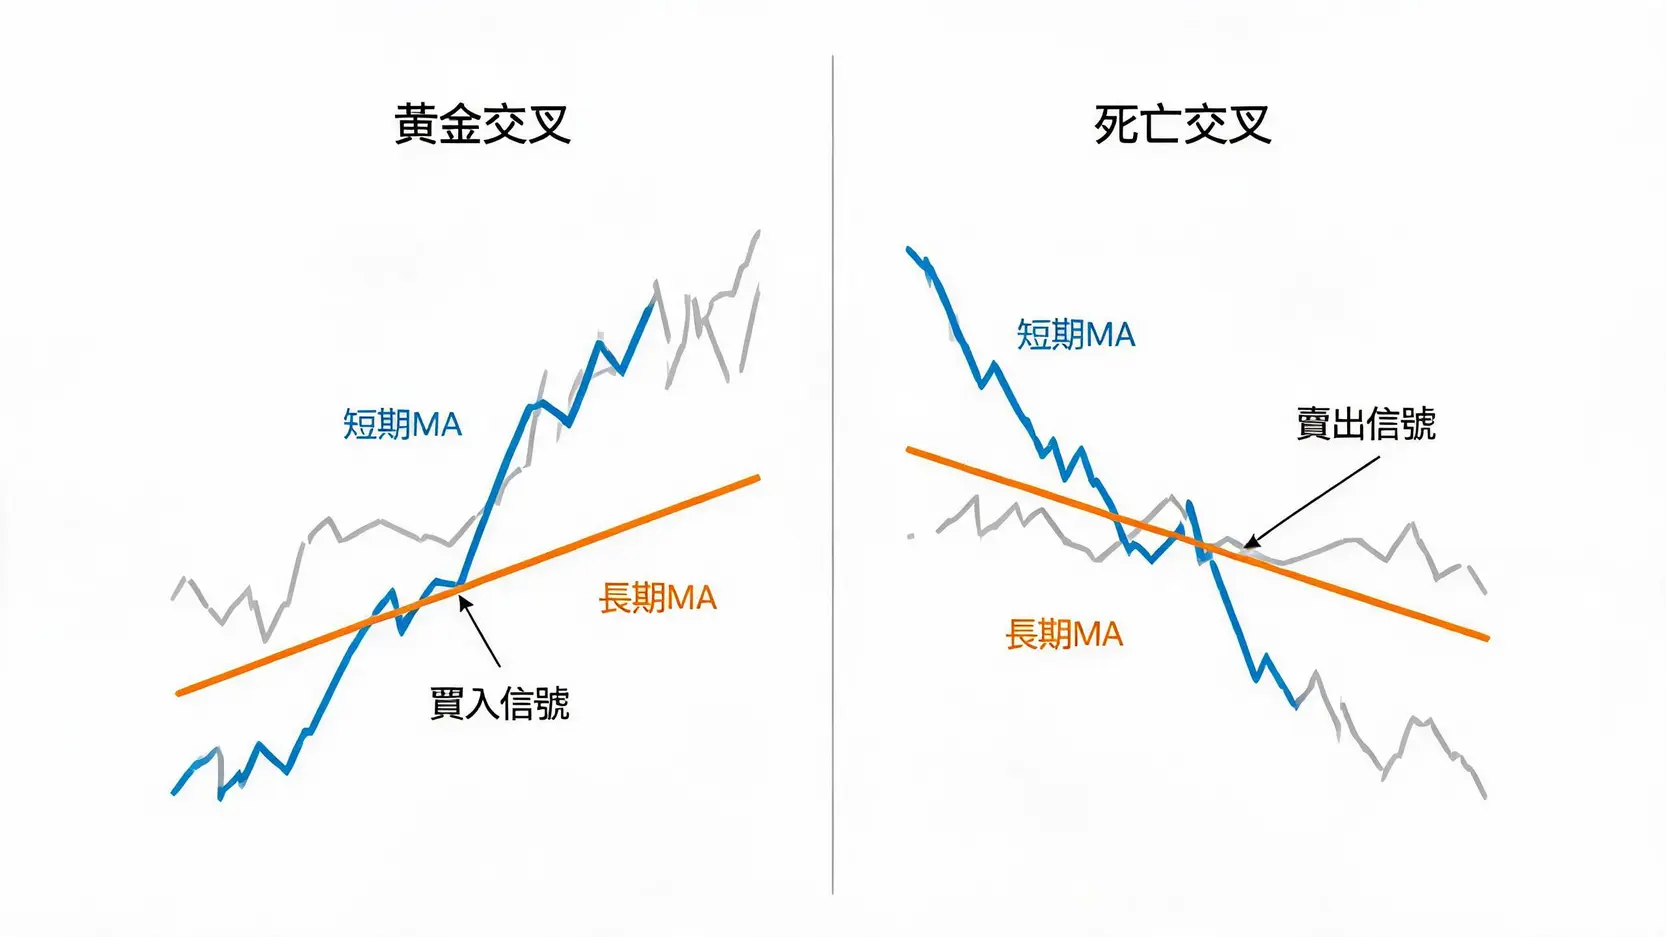
Figure 3: Key Trading Signals of Moving Averages
Relative Strength Index (RSI): Capturing Overbought and Oversold Zones
The Relative Strength Index (RSI) is a momentum oscillator used to measure the speed and magnitude of price movements, with values ranging from 0 to 100.
- Overbought and Oversold: When the RSI value is above 70, it means the market may be in an “overbought” state, and prices face the risk of a pullback. When the RSI value is below 30, it means the market may be in an “oversold” state, and prices may rebound.
- Divergence: This is one of the most powerful RSI signals. When price makes a new high but the RSI fails to make a new high, it is called “bearish divergence”, which is a potential downside signal. Conversely, when price makes a new low but the RSI fails to make a new low, it is called “bullish divergence”, which is a potential upside signal.
Bollinger Bands: Measuring Volatility and Breakout Opportunities
Bollinger Bands consist of three lines: a middle moving average line (usually the 20-period SMA) and one standard deviation line above and below it. They create a dynamic price channel.
- Measuring Volatility: When the channel widens, it means market volatility is increasing; when the channel narrows (known as a “squeeze”), it means market volatility is decreasing, but it usually signals an upcoming sharp move.
- Trading Signals: When price touches the upper band, it may indicate overbought conditions and a potential selling point; when price touches the lower band, it may indicate oversold conditions and a potential buying point. This is especially useful in ranging markets. When price strongly breaks above the upper band or below the lower band after the channel narrows, it usually marks the beginning of a new trend.
Building Your XAUUSD Trading Strategy
After understanding charts and indicators, the next step is to combine them into specific trading strategies. A good strategy must include clear entry, exit, and risk management rules. Below are two mainstream XAUUSD trading strategy frameworks.
Strategy One: Trend Following
“The trend is your friend”. Trend following is a strategy for capturing the main market trend. Its core is to go long (buy) in an uptrend and go short (sell) in a downtrend.
- Tool combination: Moving Average (MA) + trendline + candlestick patterns.
- Entry timing: In a confirmed uptrend, wait for the price to pull back near the MA or uptrend line, and enter a long position when a bullish candlestick pattern appears (such as a hammer or bullish engulfing). The opposite applies in a downtrend.
- Exit timing: Set the take-profit point near the previous high (for long positions) or low (for short positions), or exit when the trend is broken (such as when the price falls below the uptrend line).
Strategy Two: Range Trading
When the XAUUSD trend lacks a clear direction and moves back and forth within a fixed price range, the range trading strategy can be useful.
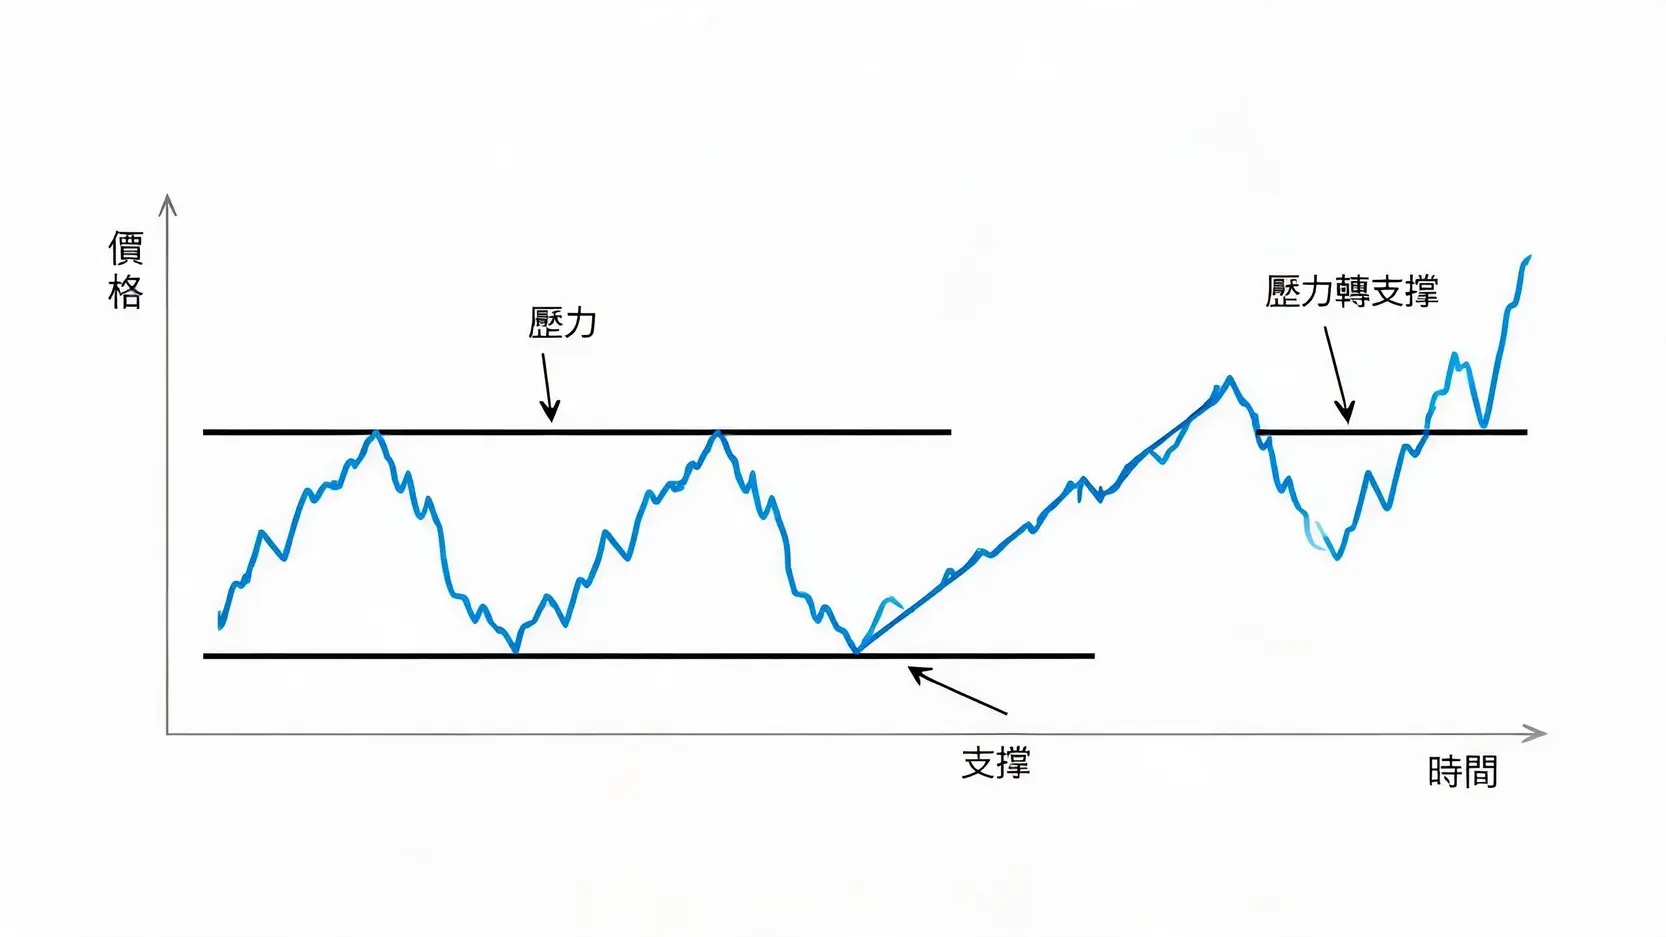
- Tool combination: Support and resistance + RSI + Bollinger Bands.
- Entry timing: After confirming that the price is in a clear range, enter a long position when the price pulls back near the support level and the RSI enters the oversold zone (below 30), or when the price touches the lower Bollinger Band. Conversely, enter a short position near the resistance level.
- Exit timing: Set the take-profit point at the other end of the range (for example, buying at support and selling at resistance). The stop-loss point should be set slightly below the support level or slightly above the resistance level.
Risk Management: How to Set Reasonable Stop-Loss and Take-Profit Points?
No matter how accurate your analysis is, no trade is 100% successful. Therefore, risk management is the key to determining how long you can survive in the market. The core lies in setting stop-loss (SL) and take-profit (TP) points.
- Setting Stop-Loss (SL): Stop-loss is the maximum loss you are willing to bear for this trade. It should be placed at a technically reasonable level, such as below a key support level or the previous swing low when going long.
- Setting Take-Profit (TP): Take-profit is your expected profit target. It can be placed at the next resistance level or calculated based on the risk-reward ratio.
- Risk/Reward Ratio: This is one of the concepts professional traders value most. It refers to the ratio between your potential profit and your potential loss. A healthy strategy should have a risk-reward ratio of at least 1:1.5 or 1:2, meaning you are willing to risk 1 dollar to seek a return of 1.5 or 2 dollars. This ensures that even if your win rate is only 50%, you can still achieve profitability over the long term.
Extended Reading (Highly Recommended)
Gold Short-Term Trading Strategies: 3 High-Win-Rate Techniques Used by Professional Traders, Explained With Charts
Forex Broker Comparison: Spreads, Regulation, and Fees, A Guide to Choosing From the Top 10 Forex Platforms
Frequently Asked Questions About XAUUSD Trend Analysis (FAQ)
Q: What is the best time to trade XAUUSD?
A: The gold market trades 24 hours a day, but the periods with the highest volatility and trading volume usually occur during the overlap of major financial markets. For Asian traders, the best time is the overlap between the European session (around after 3 p.m.) and the US session (around after 8 p.m.). During this period, market liquidity is the highest, spreads are lower, and price volatility is the most active, providing more trading opportunities.
Q: What important economic data can affect gold trends?
A: As a safe-haven asset and an alternative to the US dollar, gold is extremely sensitive to US economic data. The most important data include:
- US Nonfarm Payrolls (NFP): Released on the first Friday of each month, it directly reflects the health of the US labor market and usually triggers major market volatility. Strong data is bullish for the US dollar and bearish for gold; the opposite is also true.
- Consumer Price Index (CPI): Reflects the level of inflation. High inflation erodes the value of currency and usually increases the appeal of gold.
- Federal Reserve Interest Rate Decision (FOMC): Rate hikes strengthen the appeal of the US dollar and put pressure on gold; rate cuts have the opposite effect.
- Geopolitical Risk: Any international conflict or political instability will increase safe-haven demand for gold and push gold prices higher.
Q: How do you choose a good XAUUSD trading platform?
A: Choosing a safe and reliable trading platform is crucial. The following are several evaluation criteria:
- Strict Financial Regulation: Ensure that the platform is regulated by top-tier regulators (such as the UK FCA and Australia’s ASIC) to protect the safety of your funds.
- Low Trading Costs: Compare the spreads and commissions of different platforms. Choosing a lower-cost platform can improve your profit potential.
- Stable Trading Software: Mainstream MT4 or MT5 platforms are powerful and stable, making them the preferred choice for most traders.
- Convenient Deposits and Withdrawals: Choose a platform that supports multiple deposit and withdrawal methods and processes them quickly.
- Quality Customer Service: Provides instant and professional Chinese customer service, offering help when you encounter problems.
Conclusion
Successful XAUUSD trading does not rely on vague luck or market predictions, but is built on a deep understanding of XAUUSD trends and a rigorous, systematic trading strategy. Through the learning in this article, from interpreting the most basic price charts to making good use of the three core technical indicators, and finally building a personal trading system with strict risk management, you will be able to respond to the ever-changing market with greater confidence. Please remember that the market is always the best teacher. Continuous learning, constant practice, and strict self-discipline are the only path to stable profits.