Strong NFP: Impact on the USD, Bonds & Hong Kong Stocks

Updated: 2026/06/22  |  CashbackIsland

nfp-market-chain-reaction

The Butterfly Effect: How Does a Stronger-Than-Expected Nonfarm Payrolls Report Trigger a Chain Reaction Across the US Dollar, Bond Yields, and Hong Kong Stocks?

Financial markets often operate like a precisely engineered chain reaction, where a single event can trigger widespread consequences. Recently, a strong US nonfarm payrolls report acted like a butterfly flapping its wings, setting off a storm across global markets. Expectations for Federal Reserve rate cuts quickly cooled, the Fed adopted a more hawkish stance, the US dollar strengthened, bond yields surged, and risk assets, including Hong Kong stocks came under broad pressure. How did this seemingly complex chain of events unfold? More importantly, what does it reveal about the market’s primary concerns today? This article provides a complete review of the transmission mechanism, tracing the entire chain from “nonfarm” payrolls to “Hong Kong stocks”, helping you understand the underlying logic and gain insight into where markets may head next.

從美國非農數據到風險資產受壓的五步傳導機制流程圖。

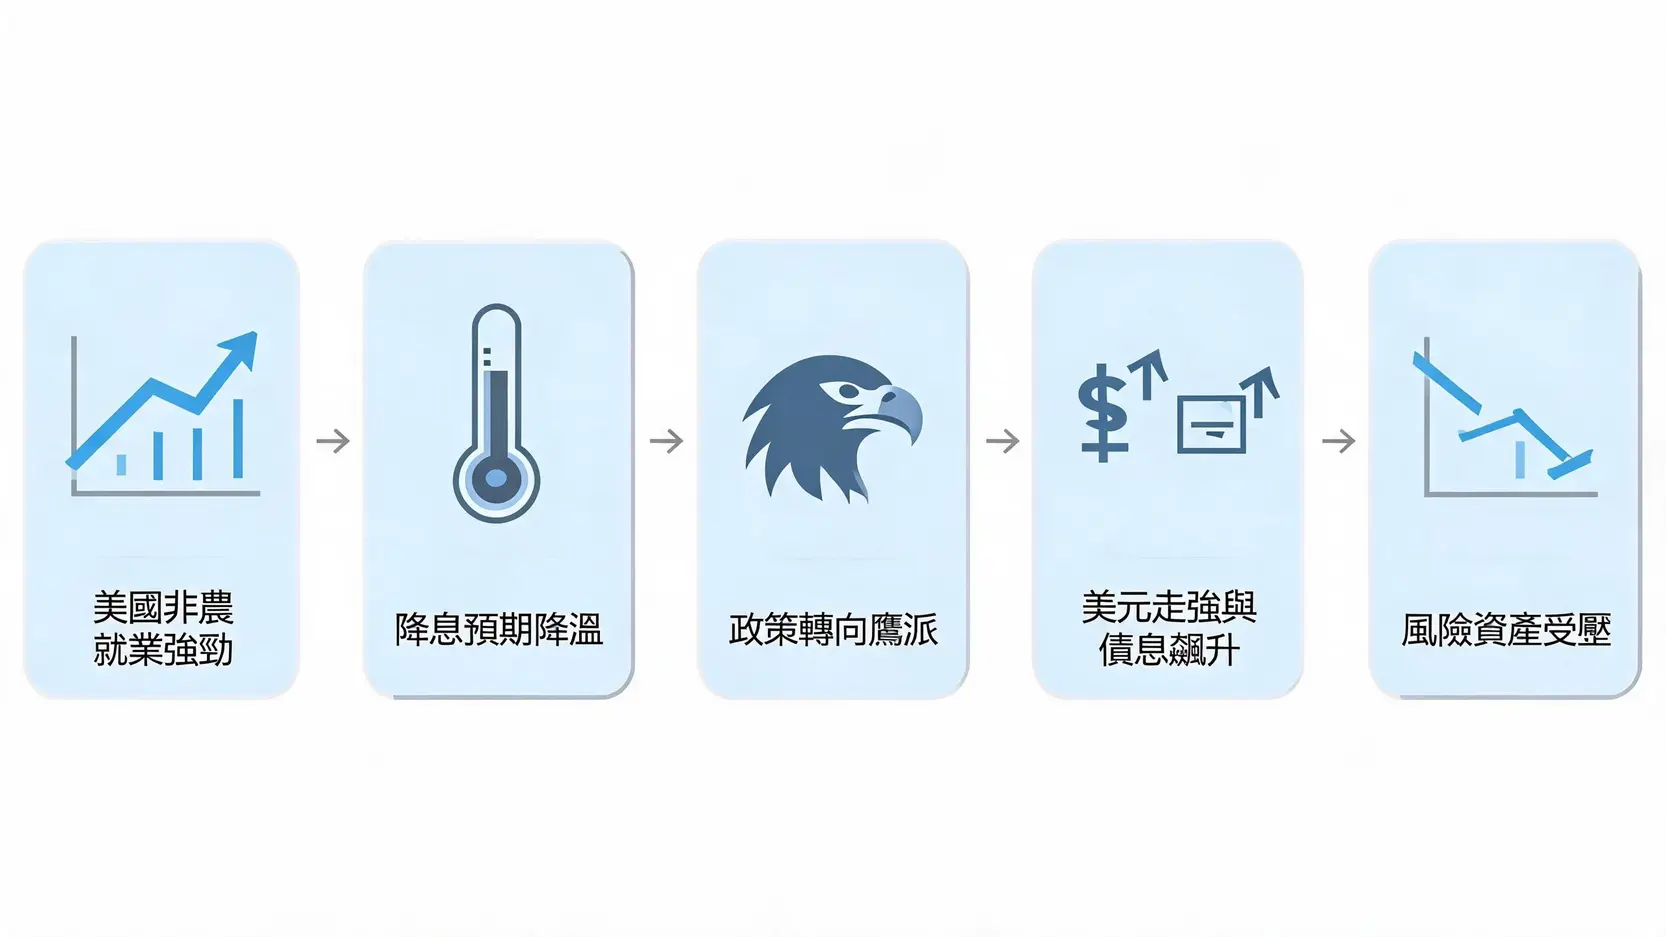
Macroeconomic Transmission Chain: From the Nonfarm Payrolls Report to Stock Market Volatility


The Starting Point: A “Too Strong” Nonfarm Payrolls Report

Major market moves often begin with economic data that significantly exceeds expectations. This time, the catalyst came from the latest nonfarm payrolls report released by the US Bureau of Labor Statistics.


Data Review: Employment Growth and Wage Growth Both Exceeded Expectations

According to the official data released by the US Bureau of Labor Statistics, the latest nonfarm payrolls report showed job creation well above market expectations, while annual average hourly earnings growth also remained at a relatively elevated level. Specifically:

  • Job Growth: Employment increased by significantly more than forecast, indicating that labor demand remains exceptionally strong.
  • Unemployment Rate: The unemployment rate remained near historic lows and even declined further.
  • Wage Growth: Both annual and monthly growth in average hourly earnings exceeded expectations, making wage growth an important leading indicator of inflationary pressure.

Taken together, these figures painted a picture of an “overheated” US economy, sharply contrasting with the market’s earlier expectation of a “gradual cooling”.


Market Interpretation: An Overheated Economy Means Inflation Remains Difficult to Control

For financial markets, the data itself is only part of the story. The real focus is how the data is “interpreted”. This “too strong” nonfarm payrolls report sent several key messages:

  1. Economic Resilience Exceeds Expectations: Strong employment supports consumer spending, reducing the risk of a near-term recession.
  2. Inflation May Be More Persistent: Rapid wage growth remains the primary driver of service-sector inflation. Continued strong wage gains suggest that the Federal Reserve’s “last mile” in fighting inflation will be especially challenging. Concerns about a potential wage-price spiral” have once again returned to the forefront.
  3. Limited Room for Federal Reserve Policy Easing: With inflationary pressure remaining elevated, the Federal Reserve’s ability to ease monetary policy (through rate cuts) has become significantly more constrained.


The First Link: A Dramatic Reversal in Federal Reserve Interest Rate Expectations

Following the release of the nonfarm payrolls report, the most immediate impact appeared in the interest rate futures market, where expectations for the Federal Reserve’s policy path shifted dramatically.


Rate Cut Expectations Collapse While Rate Hike Expectations Re-Emerge

Before the data release, markets generally expected the Federal Reserve to begin cutting interest rates during the year to prevent a hard economic landing. However, the strength of the data effectively eliminated the case for “preventive rate cuts”. Interest rate futures quickly repriced:

  • Timing of the First Rate Cut: Expectations shifted substantially, from the second half of the year to the end of the year or even later.
  • Total Rate Cuts Expected During the Year: Both the expected number and cumulative size of rate cuts were significantly reduced.
  • Possibility of Another Rate Hike: Although still considered unlikely, markets even began assigning a small probability to “another interest rate” increase as a response to stubborn inflation.


Hawkish Comments From Federal Reserve Officials Reinforce Market Expectations

After the data release, several Federal Reserve officials also delivered “hawkish” remarks. They consistently emphasized “their commitment to fighting inflation”, “the need to see more evidence that inflation is moving sustainably lower”, and the fact that there is “no urgency to cut interest rates”. These comments reinforced the market’s changing expectations, further solidifying the consensus that interest rates will remain “Higher for Longer”.


Further Reading (Highly Recommended)

2026 US Rate Cut Guide: The Federal Reserve’s Rate Cut Timeline and the Three Key Conditions Explained

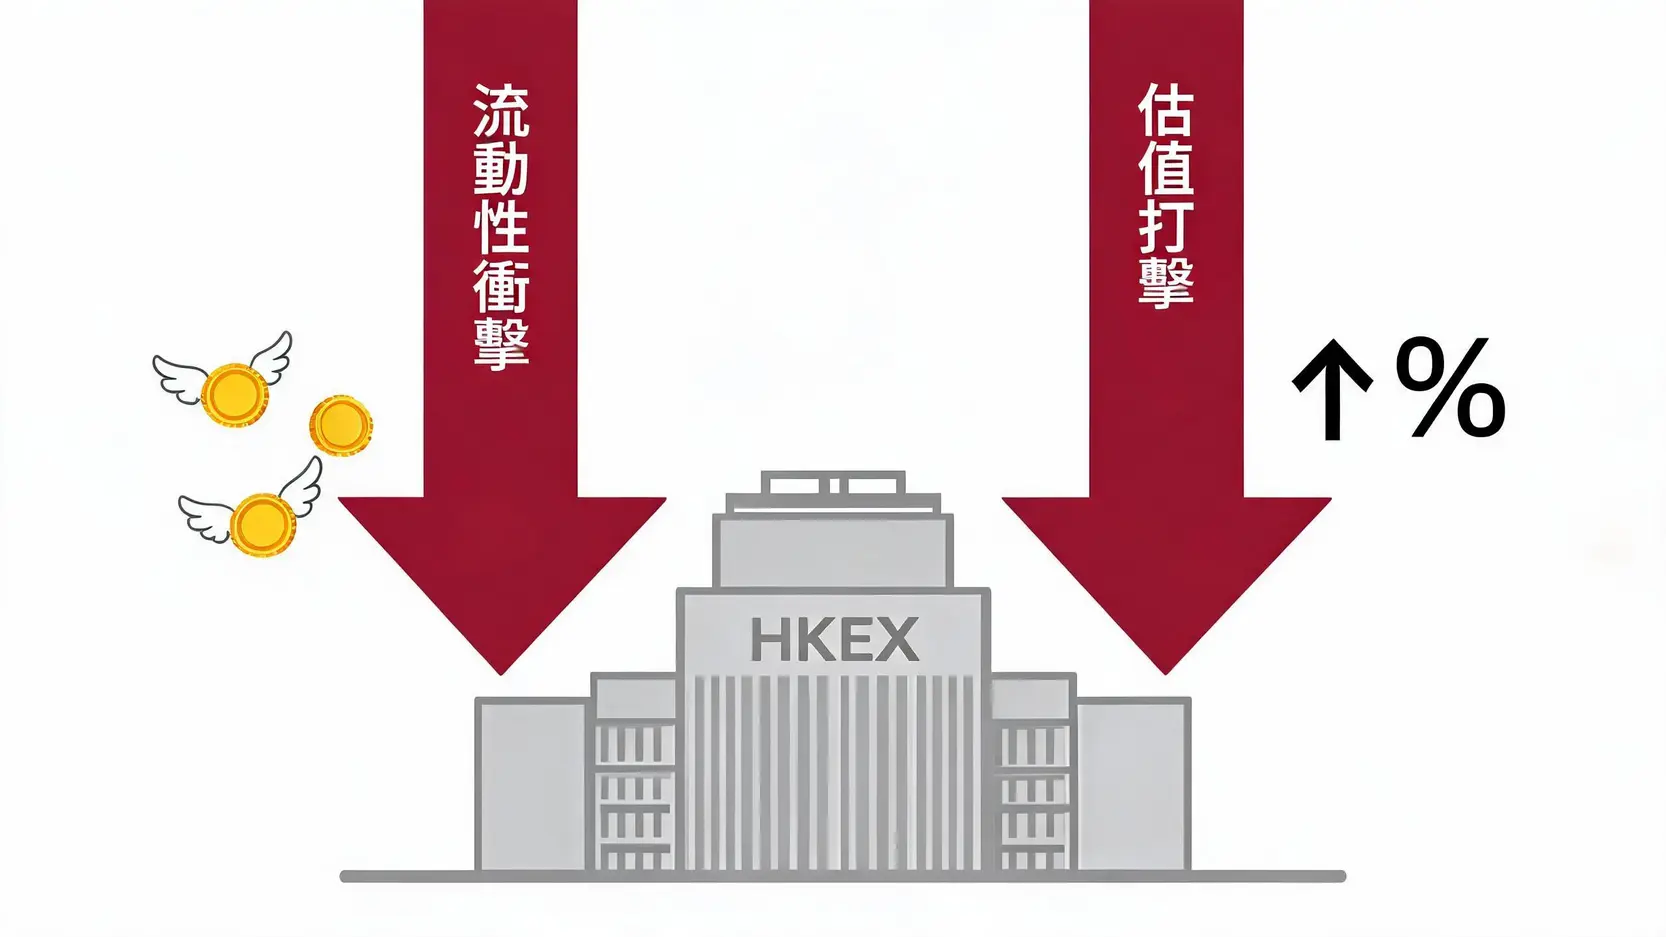
The Complete Guide to the Impact of US Interest Rate Hikes: Five Major Effects on Hong Kong’s Stock Market and Property Market, Plus Response Strategies


The Second Link: The Dual Reaction of the US Dollar and US Treasuries

Federal Reserve policy expectations act as the “master valve” controlling global capital flows. As expectations turned more hawkish, both the US dollar and the US Treasury market reacted immediately, amplifying market volatility.


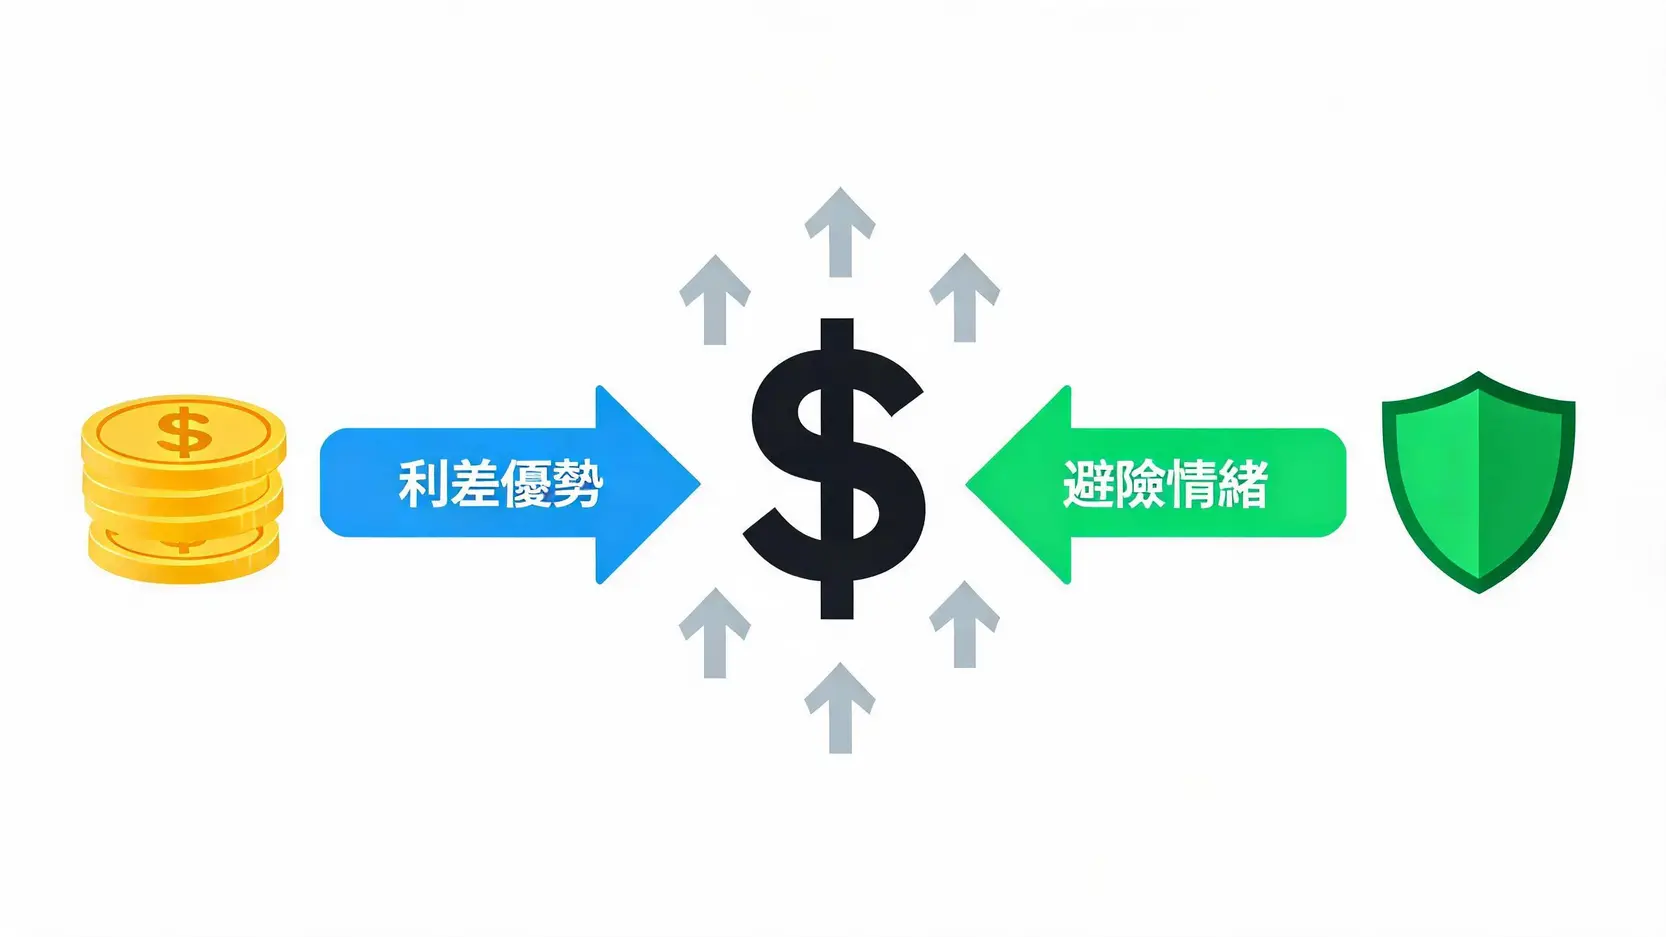
US Dollar Index Strengthens: Interest Rate Differentials Combined With Safe-Haven Demand

The strengthening of the US dollar became almost inevitable, driven by two major forces:

  • Interest Rate Differentials: As expectations for US interest rates moved higher while other major economies (such as Europe and Japan) maintained unchanged or potentially lower interest rates, US dollar-denominated assets offered relatively more attractive returns. This attracted global capital into the US, driving the US dollar higher.
  • Safe-Haven Demand: Market volatility triggered by economic data encourages investors to seek relatively safe assets. As the world’s leading reserve and safe-haven currency, the US dollar typically benefits whenever market uncertainty increases.

一張示意圖,展示了利差優勢和避險情緒是推動美元走強的兩大動力。

The Dual Drivers Behind the Stronger US Dollar


US Treasury Yields Surge: The Market Reprices the Future Interest Rate Path

US Treasury yields (i.e., bond yields) serve as the anchor for global asset pricing. Because bond prices and yields move inversely, when the market expects interest rates to rise further in the future, investors sell existing bonds, causing bond prices to fall and yields (bond yields) to rise accordingly.

The two-year US Treasury yield, which is particularly sensitive to changes in interest rate expectations, climbed rapidly, while the benchmark ten-year Treasury yield also moved higher. This implies that borrowing costs for both businesses and consumers will increase, raising financing costs throughout the financial system.


The Third Link: Broad Pressure on Risk Assets, With Hong Kong Stocks Hit Particularly Hard

As interest rate expectations reversed, the US dollar strengthened, and Treasury yields surged, the valuation foundation of risk assets (including equities and cryptocurrencies) came under severe pressure, triggering a global wave of selling. Among major markets, Hong Kong stocks experienced particularly significant pressure

Global Equity Markets: Higher Interest Rates Compress Valuations

Higher interest rates affect equities through multiple channels:

  • Lower Valuations: In widely used valuation models (such as discounted cash flow analysis), interest rates determine the discount rate. As interest rates rise, the present value of future cash flows declines, reducing the theoretical valuation of equities. Growth-oriented technology companies that rely heavily on future earnings are particularly vulnerable.
  • Higher Corporate Costs: Rising interest rates increase corporate financing costs, reducing profitability.
  • Reduced Relative Attractiveness: When risk-free assets, such as US Treasuries, offer attractive returns, investors become less willing to take additional risks by investing in equities.


Why Hong Kong Stocks Are Under Greater Pressure: A Double Blow From Liquidity and Valuation

As a major offshore financial center with free capital movement, Hong Kong is highly sensitive to changes in global liquidity conditions. During this market shock, Hong Kong stocks faced pressure from two directions:

  • Liquidity Pressure: Because the Hong Kong dollar is pegged to the US dollar through the Linked Exchange Rate System, Hong Kong’s interest rate policy closely follows that of the US. Higher US interest rate expectations imply that Hong Kong interest rates will also remain elevated. More importantly, a stronger US dollar encourages capital to leave emerging markets, including Hong Kong, and return to the US. This capital outflow directly reduces liquidity in the Hong Kong stock market. For a deeper understanding of this mechanism, refer to the analysis of how US interest rate hikes affect Hong Kong’s stock market.
  • Valuation Pressure: The Hong Kong market includes many sectors that are particularly sensitive to interest rates, including property developers, high-dividend utility companies, and technology firms that have yet to achieve profitability. Rising Treasury yields place direct downward pressure on the valuations of these sectors.

概念圖說明流動性衝擊和估值打擊對香港股市造成的雙重壓力。

Hong Kong Stocks Face a Double Blow From Liquidity and Valuation


Differentiating Insight: How Different Market Participants Respond to the Shock

Faced with this chain reaction triggered by macroeconomic data, different groups of market participants are adopting different strategies to respond and position themselves.


How Are Institutional Investors Adjusting Their Asset Allocation?

Large institutional investors are reassessing their risk exposure. The most common adjustments include:

  • Reducing Equity Exposure: Particularly to interest rate-sensitive growth and technology stocks.
  • Increasing Cash and Short-Term Bond Allocations: With short-term US Treasury yields offering attractive returns, the “Cash Is King” strategy has once again become popular.
  • Shifting Toward Defensive Sectors: Increasing allocations to industries that are less sensitive to economic cycles, such as consumer staples and healthcare.
  • Using Derivatives for Hedging: Managing downside risk through instruments such as long put options or short equity index futures.


How Should Retail Investors Interpret the Current Market Noise?

For retail investors, maintaining a clear perspective amid overwhelming market information and sharp price fluctuations is essential. The key is distinguishing between market “noise” and genuine “signals”.

  • Signal: “Higher for Longer” interest rates represent the market’s most important macroeconomic theme today. This means the previous environment, where “bad economic news was good news (because it encouraged Federal Reserve easing)”, has come to an end.
  • Noise: Daily stock price movements, market rumors, and excessive interpretation of individual events can all create noise. Chasing rallies, panic selling, and excessive trading carry particularly high risks in the current environment.
  • Response Strategy:
    • Review Your Portfolio: Assess whether your holdings are overly concentrated in high-risk growth stocks and whether they can withstand a prolonged period of elevated interest rates.
    • Maintain Adequate Cash Flow: Sufficient liquidity is important not only for unexpected personal expenses but also for taking advantage of exceptionally undervalued opportunities when they arise.
    • Focus on Long-Term Value: For high-quality companies with strong cash flow and durable competitive advantages, short-term valuation declines may create attractive long-term investment opportunities.


Further Reading (Highly Recommended)

Nonfarm Payrolls Data Comes in Stronger Than Expected! Why Is the US Dollar Strengthening as Fed Rate Cut Expectations Fade?

2026 Survival Guide for Volatile Markets: Hedging Strategies With Hong Kong Technology Stocks and REITs During US Stock Market Volatility


Frequently Asked Questions (FAQ)

Q: Will This Type of Market Correlation Continue?

A: Market correlations become particularly strong when macroeconomic factors dominate, but the primary drivers change over time. At present, inflation and Federal Reserve policy remain the market’s central focus. Once inflation is brought under control and the Federal Reserve’s policy direction becomes clearer, market attention may shift back toward corporate earnings, industry trends, and other fundamental factors. At that point, cross-market correlations may weaken, and different asset classes may begin to diverge.


Q: Are There Still Investment Opportunities in This Environment?

A: Opportunities exist in every market environment. During periods of higher interest rates, potential opportunities may include: 1) industry-leading companies with strong cash flow, low leverage, and the ability to strengthen their competitive position during industry consolidation; 2) financial sectors that benefit from rising interest rates (such as banks); 3) defensive stocks offering stable, high dividend yields with reasonable valuations; and 4) high-quality assets that become excessively undervalued during periods of market panic.


Q: Which Indicator Should Ordinary Investors Focus on Most?

A: Rather than trying to follow every economic indicator, ordinary investors should focus primarily on two key metrics: the US Core PCE (Personal Consumption Expenditures) Price Index and the US 10-year Treasury yield. The former is the Federal Reserve’s preferred inflation gauge and plays a direct role in shaping monetary policy. The latter serves as the benchmark for global asset pricing and directly influences the valuation of assets such as equities and real estate. 

Conclusion

From a stronger-than-expected US nonfarm payrolls report to the eventual wave of selling across global risk assets, including Hong Kong stocks, we have witnessed a textbook example of macroeconomic transmission. The chain of “strong employment → higher inflation expectations → a more hawkish Federal Reserve → a stronger US dollar and higher US Treasury yields → pressure on risk asset valuations” provides the key framework for understanding today’s global financial markets. Understanding this transmission chain helps investors identify the market’s primary drivers amid overwhelming information, recognize the true forces behind asset price movements, and maintain confidence while positioning themselves for future market developments.

If you liked this article, please share it!

Related Articles

  • Japan Investment Risks: 5 Hidden Risks Beyond the Yen
    Essential Reading on Japan Investment Risks: Five Potential Risks You May Not Know Besides Yen Depreciation Driven by the historic depreciation of the yen, global capital is flowing into Japan with unprecedented enthusiasm. Both the stock market and the real estate market are showing a thriving picture. The market is...
    2026 年 6 月 23 日
  • Gold Price Outlook 2026: Will the Bull Market Continue?
    Will the Gold Price Bull Market Continue? 2026 XAUUSD Trend Analysis, Experts Reveal Three Key Drivers Recently, gold prices have repeatedly hit new highs, and the market is actively debating whether gold has entered a new historic gold price bull market. Many investors are both excited and concerned, wondering how...
    2026 年 6 月 23 日
  • XAUUSD Trading Guide: Trends & Beginner Strategies
    Ultimate Guide to Trading XAUUSD Trends: From Candlestick Teaching to Practical Strategies for Stable Profits for Beginners XAUUSD (spot gold against the US dollar), as one of the world’s most popular trading instruments, offers abundant profit opportunities through its sharp price fluctuations, but also comes with considerable risk. Many beginners...
    2026 年 6 月 23 日
返回顶部