Fear & Greed Index: 5 Sentiment Trading Tools

Market Sentiment Indicator Analysis Tools: 5 Fear and Greed Index Applications Every Retail Trader Must Learn
Why do you often end up buying at market tops and selling at bottoms? You may be overlooking the most important data: market sentiment. When the crowd is extremely greedy or fearful, it is often a turning point in the market. To precisely capture entry and exit timing, learning social sentiment indicator quantification is essential. This article provides an in-depth explanation of how to convert abstract social and retail sentiment into quantifiable data, and tests and recommends 5 top market sentiment index tools, teaching you how to apply key retail sentiment indicators such as the “Fear and Greed Index” to truly understand market dynamics and make smarter investment decisions.
What Are Market Sentiment Indicators? Why Are They Important for Retail Traders
Market sentiment indicators are tools used to measure whether the overall mood of investors in a specific market is bullish or bearish. The core idea is that market prices are not only driven by fundamentals such as earnings reports and economic data, or technical factors (such as chart patterns and price-volume relationships) but are also strongly influenced by collective psychology, namely “sentiment”.
For retail investors, understanding market sentiment indicators is especially important. Compared to institutional investors, retail traders typically have less capital and weaker access to information, making them more vulnerable to herd behavior during periods of extreme greed or fear, often resulting in irrational “buy high, sell low” decisions. Therefore, learning to objectively quantify market sentiment helps investors break away from herd mentality and identify high-probability contrarian opportunities.
From Social Media Volume to VIX: Types and Principles of Sentiment Indicators
Market sentiment indicators come in various forms, with different data sources and calculation methods, generally categorized into several types:
- Survey-Based Indicators: These are derived from direct questionnaires sent to specific investor groups (such as professional fund managers or retail investors), summarizing their market outlook. An example is the AAII American Association of Individual Investors sentiment survey.
- Market Data-Derived Indicators: These are calculated from actual trading data. Examples include the VIX volatility index (also known as the fear index) and the Put/Call Ratio, which directly reflect how much investors are willing to pay for hedging risk.
- News and Social Media-Based Indicators: These use big data analytics and natural language processing (NLP) to scan news websites, forums, and social platforms (such as Twitter and Reddit). The sentiment expressed in these sources is quantified into an index, providing highly real-time insight into market mood.
Why Does Crowd Wisdom Often Become Crowd Irrationality? The Contrarian Value of Retail Sentiment
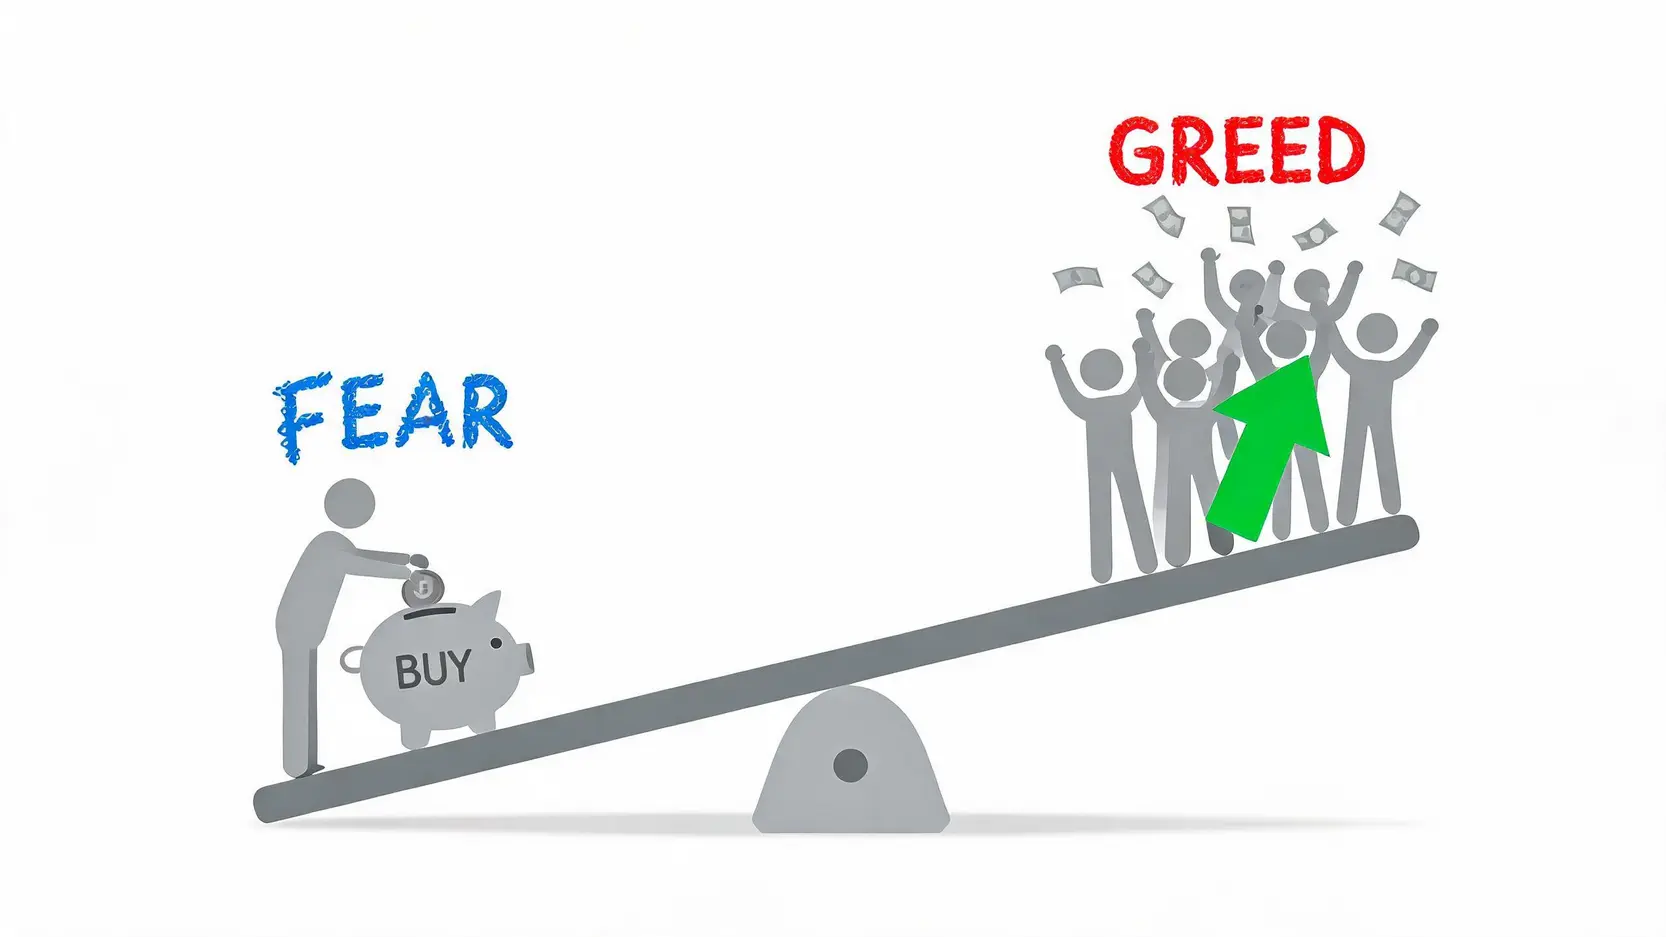
In investing, the phrase “be fearful when others are greedy, and greedy when others are fearful” perfectly describes the “contrarian value” of retail sentiment. Historical data consistently shows that extreme sentiment levels often coincide with market reversal points.
- Extreme Greed: When the market is overwhelmingly optimistic, financial media report new highs, and even non-investors start entering the market, it usually signals overheating and exhaustion of buying momentum, increasing downside risk. At this stage, rational investors may consider gradually reducing exposure.
- Extreme Fear: When markets crash, negative news dominates, and investors panic-sell assets indiscriminately, it often indicates that selling pressure is nearing exhaustion. At this point, undervalued quality assets may appear, presenting opportunities for value investors to enter.

The contrarian value of market sentiment lies in seeking buying opportunities when the crowd is in extreme fear, and staying cautious when the crowd is in extreme greed.
Therefore, learning to use retail sentiment indicator analysis tools is not about following the crowd, but about identifying the irrational behavior of the crowd and using it as a compass for building contrarian investment strategies.
[2026 Tested] 5 Major Market Sentiment Index Analysis Tools Recommended and Compared
After understanding the principles, the following introduces 5 of the most well-known and practical market sentiment index analysis tools in the market. These range from comprehensive indicators to tools specifically designed to measure retail sentiment, helping you build a complete analytical framework.
| Tool Name | Indicator Type |
Features |
Target Users |
| CNN Fear & Greed Index | Composite Indicator | Integrates 7 different data components, highly comprehensive, updated daily | All investors, especially beginners in US stocks |
| AAII Sentiment Survey | Survey-Based Indicator | Long-established, focuses on retail investor sentiment, highly valuable for contrarian analysis | Long-term investors, value investors |
| VIX (Volatility Index) | Market-Derived Indicator | Provides real-time reflection of market expectations for volatility over the next 30 days, known as the “fear index” | Short-term traders, options traders |
| MacroMicro (Fintech M Square) | Macroeconomic Data Platform | Provides global macroeconomic data, including proprietary MM sentiment indicators | Investors interested in macroeconomics |
| Augmento | Social Media Monitoring | Focuses on the cryptocurrency market, provides real-time analysis of social sentiment | Cryptocurrency investors |
Tool 1: CNN Fear & Greed Index (Fear and Greed Index) – The King of Composite Indicators
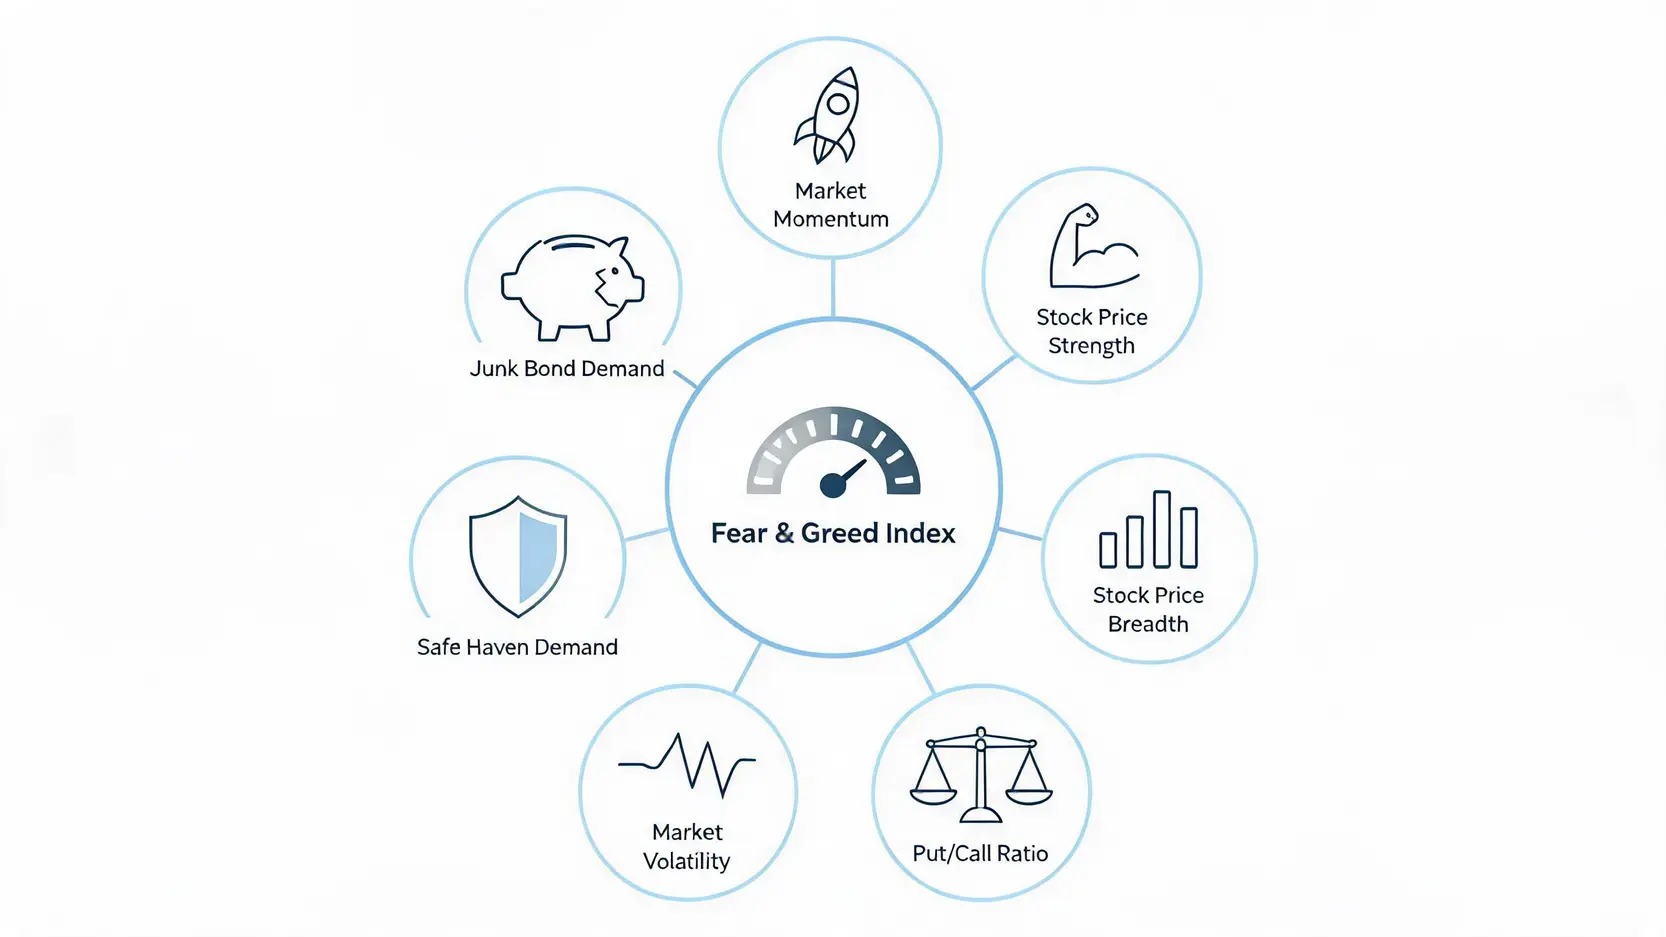
This is one of the most widely recognized market sentiment indicators, created by CNN Money. It is not based on a single dataset, but instead is calculated using seven weighted sub-indicators to comprehensively measure market sentiment:

The CNN Fear and Greed Index is calculated from seven major components, including market momentum and stock price strength.
- Market Momentum: The gap between the S&P 500 index and its 125-day moving average.
- Stock Price Strength: The comparison between the number of stocks hitting 52-week highs and lows on the NYSE.
- Stock Price Breadth: The comparison of trading volume between advancing and declining stocks.
- Put/Call Ratio: The trading volume ratio between bearish put options and bullish call options.
- Market Volatility: The VIX index.
- Safe Haven Demand: The return difference between stocks and US Treasury bonds.
- Junk Bond Demand: The yield spread between investment-grade bonds and junk bonds.
Interpretation: The index ranges from 0 to 100, with 50 as neutral. Below 25 indicates “extreme fear” which may present a potential buying opportunity. Above 75 indicates “extreme greed”, signaling increased risk of market correction.
Tool 2: AAII Sentiment Survey (American Association of Individual Investors Sentiment Survey) – The Ultimate Retail Sentiment Barometer
The AAII (American Association of Individual Investors) surveys its members weekly, asking their expectations for the stock market over the next six months (bullish, bearish, or neutral). Established in 1987, it has accumulated extensive historical data and is considered an authoritative indicator of US retail investor sentiment.
Because retail investors tend to be overly optimistic at market tops and overly pessimistic at market bottoms, the AAII indicator serves as an excellent contrarian tool. When the “bullish percentage” is unusually high and the “bearish percentage” is unusually low, it often signals a short-term market top. Conversely, it may indicate a potential market bottom. Relevant charts and data can be found on the MacroMicro platform.
Tool 3: VIX (Volatility Index) – The Best Measure of Market Fear
The VIX index, often referred to as the “fear index” , is compiled by the Chicago Board Options Exchange (CBOE) to measure the market’s expectation of volatility over the next 30 days for the S&P 500 index. For a deeper explanation, refer to our detailed guide on what the VIX index is.
Interpretation:
- VIX < 20: Stable market sentiment, investors are generally optimistic, and equities tend to rise.
- VIX > 30: Rising fear and uncertainty, often associated with significant market declines.
When the VIX spikes, it reflects heightened risk aversion and panic. However, when it reaches extreme levels (such as 40–50 or higher), it often indicates that panic selling is nearing exhaustion and a market rebound may follow.
Tool 4: MacroMicro – A Data-Driven Macroeconomic Sentiment Platform
MacroMicro is a Taiwan-based platform focused on global macroeconomic data. It aggregates official economic statistics and also develops proprietary charts and indicators, including the “MM Fundamental Index” and “MM User Sentiment Index”. These indicators combine manufacturing data, employment figures, consumer confidence, and other macro variables to provide a broader and more comprehensive view of market sentiment.
Tool 5: Social Media Monitoring Platforms (such as Augmento) – Capturing Real-Time Market Momentum
With the rise of social media, sentiment analysis based on online activity has become a new analytical approach. This is especially important in the highly volatile cryptocurrency market, where social sentiment (such as Twitter discussion volume and keyword frequency) has an immediate and significant impact on price movements.
Platforms like Augmento use AI technology to analyze large volumes of data from Twitter, Reddit, Telegram, and other sources, quantifying collective sentiment (such as fear, optimism, and speculation) into measurable indices. This helps traders capture real-time market sentiment shifts.
Recommended Reading (Highly Recommended)
What Is the VIX Index? A Complete Guide to Understanding Market Signals Behind Fear Levels
RSI Indicator Tutorial: 5 Practical Strategies from Overbought/Oversold to Divergence
Practical Tutorial: How to Build Your Trading Strategy Using Sentiment Indicators?
Using any single indicator in isolation has limitations, and market sentiment indicators are no exception. The most effective approach is to combine them with other analytical methods to form a complete trading strategy. Below is a three-step guide to help you apply them in real trading.

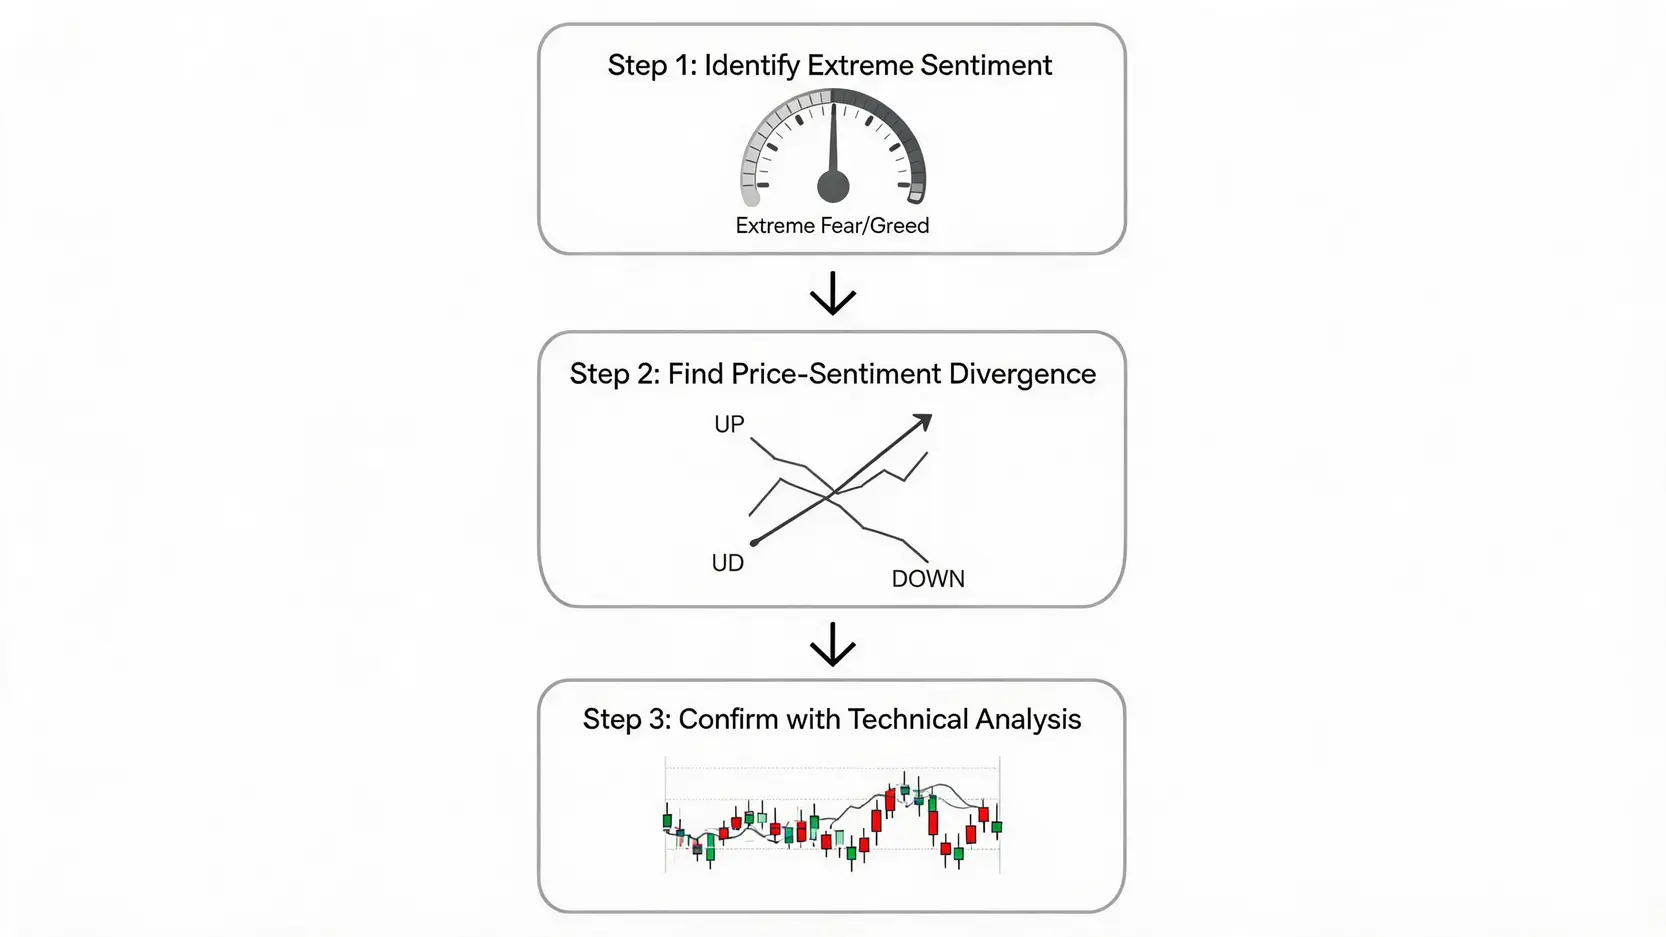
A three-step trading strategy: first identify extreme sentiment, then look for divergence signals, and finally use technical analysis to confirm entry and exit points.
Step 1: Identify Extreme Market Sentiment Zones (Extreme Fear vs. Extreme Greed)
First, use the tools mentioned above (especially the CNN Fear and Greed Index and AAII survey) to determine the current market sentiment zone. The goal is not to track small daily fluctuations, but to patiently wait for “extreme values” to appear.
- When the Fear and Greed Index drops below the 20–25 range, or when AAII bearish sentiment is significantly above historical averages, it signals heightened caution and may indicate a potential accumulation opportunity.
- When the Fear and Greed Index rises above the 75–80 range, or when AAII bullish sentiment reaches extreme highs, it suggests increasing risk and the need to reduce exposure.
Step 2: Look for “Divergence” Between Price Action and Sentiment Indicators as Entry Signals
“Divergence” is a powerful reversal signal in technical analysis and also applies to sentiment analysis. It occurs when price movement and indicator movement contradict each other.
- Bullish Divergence: Price makes a new low, but sentiment indicators (such as VIX or bearish ratio) fail to make a new high. This suggests that fear is not increasing alongside price declines, indicating weakening selling pressure and a potential buy signal.
- Bearish Divergence: Price makes a new high, but sentiment indicators (such as the Fear and Greed Index) fail to make a new high. This indicates that optimism is not keeping pace with price increases, suggesting weakening upward momentum and a potential sell signal.
Step 3: Combine Technical Analysis (RSI, Moving Averages) to Find Precise Entry and Exit Points
Sentiment indicators tell you “when” the market may be approaching a turning point, while technical analysis helps identify “where” to enter or exit. When sentiment reaches extreme levels, you can switch to the price chart to look for confirmation signals.
For example, when the market is in an “extreme fear” zone, you can check whether the RSI has entered “oversold territory” below 30, or whether price is stabilizing near key support levels (such as the long-term moving average). The convergence of multiple indicators significantly increases the probability of successful trading decisions.
FAQ – Common Questions About Market Sentiment Indicators
Q: Can market sentiment indicators predict market movements with 100% accuracy?
A: No. No single indicator can predict the market with 100% accuracy. Market sentiment indicators measure “probability”, not “certainty”. They reflect the current psychological state of the crowd, but market direction is also influenced by policy decisions, earnings reports, and unexpected events. Therefore, they should be used as a supporting tool, not a predictive crystal ball.
Q: Are these analysis tools free or do they require a subscription?
A: Most tools mentioned in this article offer free versions. For example, the CNN Fear and Greed Index, VIX real-time data, and AAII sentiment summaries are publicly available. Platforms like MacroMicro offer some free charts, while advanced features may require paid subscriptions. Investors can choose based on their needs.
Q: Are these sentiment indicators applicable to markets outside US stocks, such as Hong Kong stocks, Taiwan stocks, or cryptocurrencies?
A: Applicability varies. Indicators like VIX and AAII are primarily designed for the US market, but since US equities lead global markets, their sentiment still has strong reference value worldwide. For regional markets (such as Taiwan or Hong Kong), local indicators like “margin financing ratios” or “retail positioning” may be more relevant. In cryptocurrency markets, social sentiment tools such as Augmento are more commonly used.
Q: How often should I check market sentiment indicators?
A: It depends on your trading style. Long-term investors may only need to review sentiment weekly or monthly to understand the broader market environment. Short-term traders may need daily monitoring, especially during volatile periods when indicators like VIX and real-time social sentiment become more important. The key is not to overreact to small daily fluctuations, but to focus on identifying “extreme” sentiment conditions.
Conclusion
In summary, market sentiment indicators are not crystal balls that predict the future, but they are extremely powerful complementary tools to traditional technical and fundamental analysis. Learning how to quantify social sentiment and effectively use retail sentiment analysis tools can help you stay rational during market euphoria and identify opportunities during extreme fear. Incorporating indicators such as the “Fear and Greed Index” into your investment framework will gradually help you better understand market rhythm and human behavior, allowing you to trade with greater stability and long-term consistency.
Related Articles
-
How Does Hedging Work? Advanced Hedge Fund Strategies and Practical Trading Guide In the rapidly changing financial markets, relying solely on a “buy-and-hold” strategy often makes it difficult to withstand severe market volatility and achieve stable long-term profits. If you have heard Wall Street leaders discuss risk hedging, you are...2026 年 7 月 14 日
-
What Is Hedging? A Risk Management Guide Every Financial Beginner Should Read In the investment market, we often hear the term “hedging”, but what exactly does it mean? Why do professional investors use it? Hedging means adopting strategies to protect assets from adverse price movements. Whether in the stock, foreign...2026 年 7 月 14 日
-
2026 Complete Guide to US Treasury Yields: Trend Analysis, Impact of Surging Yields, and Asset Allocation Strategies In the rapidly changing global financial market, US Treasury yields have long been regarded as the most important benchmark for the risk-free rate. Entering 2026, amid recurring shifts in inflation expectations and dynamic...2026 年 7 月 13 日