VIX Index Interpretation: Market Sentiment Represented by Different Value Ranges.
VIX < 20: Stable Market Sentiment, Equities Tend to Be Stable or Rise
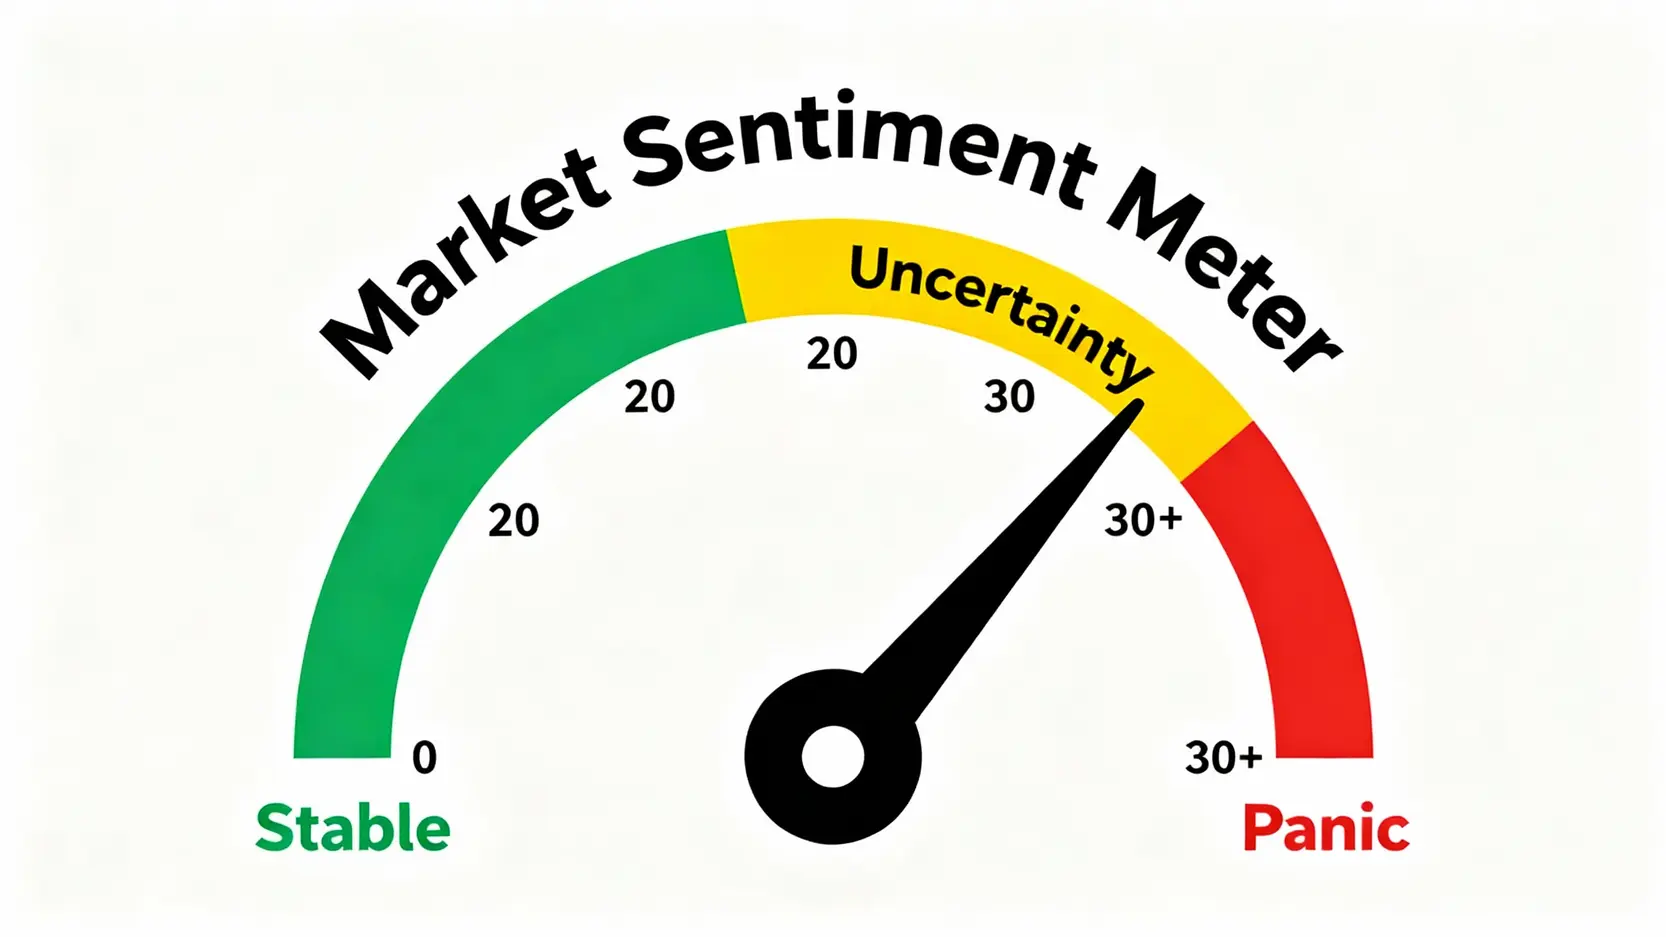
When the VIX Index falls below 20, especially below 15, it is usually regarded as the market’s “complacency zone”.
- Market performance: During this period, market volatility is low, investors have a higher risk appetite, and major indices tend to rise gradually or move sideways. There is little negative news in the market, and overall sentiment is generally calm.
- Investor sentiment: Broadly optimistic, with limited awareness of risk aversion. The atmosphere is somewhat like a clear summer afternoon, where everything feels peaceful and steady.
- Potential risks: Extremely low VIX levels may also serve as a contrarian indicator. As the saying goes, “When others give up, I take; when others take, I give”. When the market becomes overly complacent, it often means risks are quietly building, and even minor disturbances can trigger sharp pullbacks.
20 < VIX < 30: Rising Uncertainty, Increasing Risk Aversion
This range is the VIX Index’s “warning zone”, indicating that the market is beginning to feel pressure.
- Market performance: Volatility starts to increase, and more noticeable declines or fluctuations may occur.
- Investor sentiment: Investors begin to feel uneasy as uncertainty rises. This may be due to weaker-than-expected economic data, disappointing corporate earnings, or emerging geopolitical tensions. Demand for safe-haven assets increases, and capital starts seeking more secure shelters.
- Operational strategy: At this stage, investors should raise their level of caution, reassess portfolio risk, and consider whether to increase allocations to defensive assets.
VIX > 30: Market Enters Panic, Potential for Sharp Declines
Once the VIX Index breaks above 30, or even surges to 40 or higher, it signals that the market has entered the “panic zone”.
- Market performance: This is often accompanied by rapid and significant equity market declines, commonly referred to as a “crash” or “market meltdown”. For example, during the 2008 global financial crisis and the early stages of the 2020 COVID-19 outbreak, the VIX Index surged to historical highs above 80.
- Investor sentiment: The market is dominated by extreme fear, with investors selling assets at any cost, creating a vicious cycle. News headlines are filled with negative developments, and doomsday narratives become widespread.
- Potential opportunities: For well-prepared contrarian investors, this is the moment when “others are fearful, I am greedy”. Extremely high VIX levels represent substantial risk, but they also indicate that many high-quality assets are being irrationally sold off, creating golden opportunities for long-term positioning.
Three Main Application Scenarios of the VIX Index
After learning how to interpret the VIX Index, it can be applied to real investment decision-making. It is not merely an observational indicator, but a practical analytical tool.
Application One: Assessing Overall Market Risk and Investor Sentiment
This is the most direct application of the VIX Index. Just as you check the fuel gauge and engine temperature before driving, taking a glance at changes in the VIX Index before starting a day of trading or reviewing your portfolio allows you to quickly grasp the current market “temperature”.
- VIX rising: This signals that market risk is increasing, reminding you to be more cautious and to avoid chasing highs or panic selling.
- VIX falling: This indicates that market sentiment is stabilizing and is generally favorable for the performance of risk assets.
Application Two: A Hedging Reference for Asset Allocation
The trend of the VIX Index can provide important guidance for your asset allocation strategy. By observing long-term VIX trends, you can make dynamic adjustments and optimize the risk-return profile of your portfolio.
- When the VIX remains at low levels for an extended period: This may indicate that market risk is being underestimated. At such times, you may consider moderately reducing exposure to high-risk assets such as equities, or increasing allocations to assets with negative correlation to equities (such as bonds or gold) as hedges.
- When the VIX spikes to extremely high levels: Excessive market panic may present opportunities to gradually buy high-quality stocks or index funds that have been unjustifiably sold off.
Application Three: Trading VIX-Related Financial Products (ETFs, Futures)
In addition to serving as an analytical tool, the VIX itself can also be traded. There are various derivative financial products in the market that track the VIX Index, mainly including VIX futures, VIX options, and VIX-related ETFs or ETNs (exchange-traded funds or notes).
⚠️ High-Risk Warning: It must be emphasized that directly trading VIX-related products involves extremely high complexity and risk, and is absolutely unsuitable for novice investors or long-term holding. These products are designed for short-term speculation or professional hedging, and their prices are subject to long-term erosion due to futures rollover costs (contango), resulting in a continuous decline in net asset value. Ordinary investors who wish to participate must first gain a thorough understanding of their mechanisms and risks, otherwise significant losses are highly likely. For most people, using the VIX as a reference indicator of market sentiment is far safer and more effective than trading it directly. If you are interested in learning more about ETFs, you may refer to ETF Investment Basics.
Further Reading (Highly Recommended)
What Is the S&P 500? A Beginner’s Investment Guide: Understanding Constituents, ETFs, and How to Buy
How to Build a Futures Investment System? Five Core Steps From Asset Allocation to Portfolio Strategy
Frequently Asked Questions About the VIX Fear Index (FAQ)
Q: Is a higher VIX Index always better?
A: The VIX Index itself has no concept of being “good” or “bad”. It is a neutral market indicator. A high VIX represents market panic and high volatility, which is a risk for most long-term investors. However, for speculators seeking short-term trading opportunities or professionals conducting hedging operations, high volatility may imply greater profit potential. Conversely, a low VIX represents market stability, which benefits bullish positions, but may feel dull to short-term traders.
Q: Can the fear index accurately predict stock market rises and falls?
A: No. This is a common misconception. The VIX Index predicts the “magnitude of volatility”, not the “direction”. A high VIX means the market expects significant movement in the future, but that movement could be a sharp rally or a steep decline. It reflects market uncertainty, not a crystal ball that predicts the future. It is a coincident or slightly lagging indicator that confirms the market’s current emotional state.
Q: Besides the US VIX, is there a similar volatility index in Hong Kong?
A: Yes. Drawing on the VIX Index methodology, Hong Kong Exchanges and Clearing introduced the “Hang Seng Index Volatility Index (VHSI)”. The role of the VHSI is similar to that of the VIX. It measures market expectations of the Hang Seng Index’s volatility over the next 30 days. When the Hong Kong equity market becomes turbulent, the VHSI typically rises as well, making it an important reference indicator for observing market sentiment in Hong Kong equities.
Q: How is the VIX Index calculated?
A: The calculation of the VIX Index is relatively complex and is not a simple statistical figure. In simple terms, it is derived by aggregating the prices of near-term and next-term call options and put options on the S&P 500 Index across a range of different strike prices, and applying a specific weighted formula. This process reflects how much the market is willing to pay for “insurance” (that is, options), thereby inferring expectations of future volatility.
Q: Should retail investors directly invest in VIX ETFs?
A: In general, it is strongly not recommended that retail investors, especially beginners, directly invest in VIX-related ETFs or ETNs. These products suffer from severe long-term value erosion issues (known as Contango Bleed) and are structurally unsuitable for long-term holding. They are short-term trading tools designed for professional traders, (typically for intraday or multi-day trades). Without the ability to monitor positions constantly and understand the structure of the futures market, rashly buying and holding VIX ETFs over the long term almost inevitably leads to losses.
Conclusion
In summary, learning to understand what the VIX Index is can give you an additional basis for judgment when markets are chaotic. It is not only a thermometer for measuring market volatility, but also a key tool for gauging the collective sentiment of investors. By adding this powerful “fear index” to your analytical toolbox, whether you are assessing overall market risk, adjusting asset allocation, or looking for potential contrarian investment opportunities, you can make your investment decisions more comprehensive and rational. The next time news reports that the fear index has surged again, you will no longer be a helpless bystander, but a smart investor who can read market signals.