Global Bull Market Guide: US, HK & A-Share Cycles

Updated: 2026/04/08  |  CashbackIsland

global-bull-market-cycles

Global Bull Market Guide: From US Stocks, Hong Kong Stocks to Mainland A Shares, Understanding Bull Market Cycles and Future Opportunities

The global stock market is heating up, especially after recent fluctuations, leaving investors with questions: How much longer can the current bull market continue? Which phase are we currently in? To answer this accurately, looking at a single market is not enough. This article provides an in-depth analysis of the history of US stock bull markets, a review of Hong Kong’s longest bull market, and a deconstruction of the unique logic of Mainland China’s stock bull markets, giving you a comprehensive understanding of the global bull market cycle and helping you gain an edge in a changing market to make wiser decisions.


What Is a Bull Market? Breaking Down the Basic Concept of Global Bull Market Cycles

Before entering the market, you must understand the rules of the game. The term “bull market” is heard every day, but its precise definition and internal rhythm are what distinguish professional investors from ordinary ones. Understanding the basic concept of global bull market cycles is the first step to mastering the roadmap to wealth growth.


Definitions and Criteria for Bull and Bear Markets

Market fluctuations are normal, but not all rises are considered bull markets. A widely accepted technical definition is:

  • Bull Market: Refers to a major stock index (such as the S&P 500 or HSI) rising 20% or more from its previous low. This is usually accompanied by widespread optimism, increased investor confidence, and a favorable economic outlook.
  • Bear Market: Refers to a major stock index falling 20% or more from its previous high. At this time, the market is generally pessimistic, investor confidence is low, and the economy may face recession risks.

It is worth noting that a pullback between -10% and -20% is usually called a “market correction” or “retracement”, a normal phenomenon within a bull market that does not represent a fundamental trend reversal. Understanding these three distinctions can effectively prevent making wrong decisions due to panic during normal market fluctuations.


The Bull Market Trilogy: Typical Phases from Accumulation, Expansion to Excess

A complete bull market cycle is not a straight upward line but resembles a symphony with its own rhythm of rises and falls. According to classic Dow Theory, a bull market is divided into three stages, and knowing which stage you are in is crucial:

  1. First Stage: Accumulation
    This is the end of the bear market, after a prolonged decline when bad news has mostly been priced in and valuations reach historical lows. Most investors are still fearful, but the smartest “smart money” begins quietly accumulating cheap shares. Market performance is characterized by low trading volume and slowly stabilizing stock prices.
  2. Second Stage: Public Participation
    As economic data improves and corporate profits recover, market confidence begins to return. Media coverage turns optimistic, and more retail investors enter the market, significantly increasing trading volume. This is the longest-lasting and most stable “primary upward wave” of the bull market, where earning potential is most apparent.
  3. Third Stage: Excess
    Market sentiment reaches its peak, and speculative activity is intense. From media and experts to ordinary investors, everyone is extremely optimistic about the stock market, even creating a “national stock hero” phenomenon. At this stage, stock price rises become very steep, but fundamentals can no longer support the inflated valuations. Smart money that entered earliest begins exiting in stages, often signaling the top of the bull market.

牛市三階段示意圖,展示了從醞釀期、爆發期到瘋狂期的股價和投資者情緒變化。

The Bull Market Trilogy: A complete bull market cycle typically goes through three stages, with each stage exhibiting distinct market participants and sentiment.


Extended Reading (Highly Recommended)

Bull Market Investment Strategies: 5 Key Deployment Tips to Avoid Chasing Highs and Earn Steadily


Review of Bull Market History in Three Major Markets: US, Hong Kong, and Mainland China

Although the global economy is interconnected, bull markets in different regions have distinctly different characteristics. Understanding the history and driving factors of bull markets in the US, Hong Kong, and Mainland China helps provide deeper insight into the current global bull market cycle.

美股、港股、A股三大牛市特點對比圖,分別展示了科技驅動、資金驅動和政策驅動的模式。

Bull Market Gene Map of the Three Major Markets: Each market’s bull market has unique core drivers and historical trajectories


History of US Stock Bull Markets: Causes and Lessons from the Longest Bull Market in History

From March 2009 to February 2020, the US stock market experienced the longest bull market in history, with the S&P 500 rising over 400%. The main causes of this super bull market were:

  • Monetary Easing Policies: After the 2008 financial crisis, the Federal Reserve (Fed) implemented long-term zero interest rates and quantitative easing, providing abundant liquidity and strong support for asset price increases.
  • Rise of Tech Giants: Represented by FAANG (Facebook, Apple, Amazon, Netflix, Google), tech giants drove growth through innovative business models and global market expansion, becoming the core engine of index growth.
  • Globalization Dividend: US multinational companies benefited from globalization, effectively reducing costs and expanding into emerging markets, continuously boosting profits.

Lesson: US bull markets are long and stable, with technological innovation as the core driving force. Investing in US stocks requires closely following technology trends. For beginners, participating through ETFs or CFDs is a good choice. For more details, see the 2026 US Stock CFD Complete Guide: Platform Comparison, Pros and Cons, and Beginner Teaching!


Review of Hong Kong’s Longest Bull Market: What Factors Created Hong Kong’s Golden Era?

The most celebrated bull market in Hong Kong history occurred from 2003 to 2007, with the HSI rising from under 9,000 points to nearly 32,000 points. Core driving factors included:

  • High Growth of Mainland China’s Economy: At the time, China was in its golden decade of economic takeoff, generating huge demand for raw materials and financial services. Many mainland companies listed in Hong Kong (state-owned and red-chip stocks) saw explosive profit growth, becoming the bull market leaders.
  • Abundant Capital Flow: Strong expectations of RMB appreciation attracted substantial international hot money to Hong Kong, while mainland capital also sought offshore investment channels, pushing market sentiment to its peak.
  • Valuation Undervaluation Effect: Compared to other global markets, H-shares were highly attractive, drawing global capital attention.

Lesson: As a linked-exchange rate market, Hong Kong’s bull market cycle is heavily influenced by “China factors” and “international capital flows”. Understanding capital movements and the mainland economic situation is key to judging Hong Kong bull markets. For those interested in investing, start with Hong Kong Stock Investment for Beginners: Learn How Stocks Make Money from Scratch.

Characteristics of Mainland China Stock Bull Markets: How Policy Markets Affect A-Share Cycles?

Mainland A-share bull markets are often described as “short bulls, long bears”, with strong cyclicality and a pronounced “policy market” characteristic. Examples include the 2005-2007 super bull triggered by share reform and the 2014-2015 fast bull driven by leveraged funds. Key features include:

  • Clear Policy-Driven Effects: The start and end of A-share bull markets are often closely linked to major fiscal policies or national strategies. Investors’ interpretation of policies greatly influences market sentiment.
  • High Retail Participation: Dominated by retail investors, the A-share market is prone to emotional trading, often resulting in collective chasing and selling, causing greater volatility than mature markets.
  • Rapid Cycle Shifts: Due to a lack of long-term investment ecology, A-share bull markets can accumulate huge gains in a short period, with rapid bubble formation and equally sharp bear market corrections.

Lesson: Investing in Mainland stocks requires not only analyzing fundamentals but also interpreting policy signals. In the A-share market, contrarian thinking and risk management are more important than simply following trends.


2026 Global Bull Market Cycle: Where Are We Now? Full Analysis of Three Key Indicators

History never repeats exactly, but it often rhymes. By understanding the past, we can better assess the present. To evaluate the global bull market cycle in 2026, three key dimensions cannot be overlooked they act like the compass, barometer, and wind vane of your investment voyage.

分析牛市週期的三大關鍵指標,包括經濟指標、市場情緒指標和估值水平。

Three-Dimensional Compass to Gauge Bull Market Position: Combining economic, sentiment, and valuation indicators for a more comprehensive market assessment.


Economic Indicators: GDP Growth, Interest Rate Trends, and Inflation Expectations

Macro conditions form the soil of the stock market; its fertility determines how high and how far a bull market can go.

  • GDP Growth Rate: The “accelerator” of the economy. Strong GDP growth signals robust corporate earnings prospects and forms the firmest foundation for a bull market. If growth slows or stagnates, the bull market’s base is at risk.
  • Interest Rate Trends: The “brake” of the market. Low rates reduce corporate borrowing costs and make equities more attractive relative to fixed-income assets. Once central banks raise rates to combat inflation, liquidity tightens, putting significant pressure on the bull market.
  • Inflation Expectations: Moderate inflation supports corporate profitability, but runaway inflation erodes purchasing power and forces tighter monetary policy, becoming a potential bull market killer.


Market Sentiment Indicators: Fear & Greed Index (VIX) and Capital Flows

“Be fearful when others are greedy, and greedy when others are fearful.” Sentiment is a key gauge in the late stages of a bull market.

  • Fear & Greed Index (VIX): Known as the “fear index”, the VIX measures the market’s expectation of volatility in the S&P 500 over the next 30 days. Typically, a low VIX level (such as below 20) indicates optimistic and complacent market sentiment, which is common in a bull market, but an extremely low VIX may also signal that the market is overheating. Conversely, a surge in the VIX reflects rising market panic. You can check the real-time VIX index on the CBOE official website.
  • Capital Flows: Observing whether funds flow into equity ETFs or bond ETFs helps gauge risk appetite. In a bull market, money flows into equities. A mass exodus to safe-haven assets signals caution is needed.


Valuation Levels: Historical P/E as a Warning Signal

No asset price can diverge infinitely from intrinsic value. Valuation is the core measure of whether the market is “too expensive”.

  • Price-to-Earnings Ratio (P/E Ratio): It is calculated as market price divided by earnings per share. Comparing the current overall market price-to-earnings ratio with its historical average (such as the average over the past 20 or 30 years) is one of the most commonly used methods to assess whether the market is overvalued or undervalued.
  • Shiller P/E (CAPE Ratio): Using inflation-adjusted earnings over the past 10 years, this smooths out economic cycles and is a more reliable measure of long-term market valuation.

When the P/E, especially the Shiller P/E, far exceeds historical averages, the market may have entered bubble territory. Even if the bull market continues short-term, the risk of correction is significantly higher


Extended Reading (Highly Recommended)

2026 US Stock CFD Complete Guide: Platform Comparison, Pros and Cons, and Beginner Tutorials!

Hong Kong Stock Investment for Beginners: Learn How Stocks Make Money from Scratch (Including 2026 Hot HK Stock Account Recommendations)


Conclusion

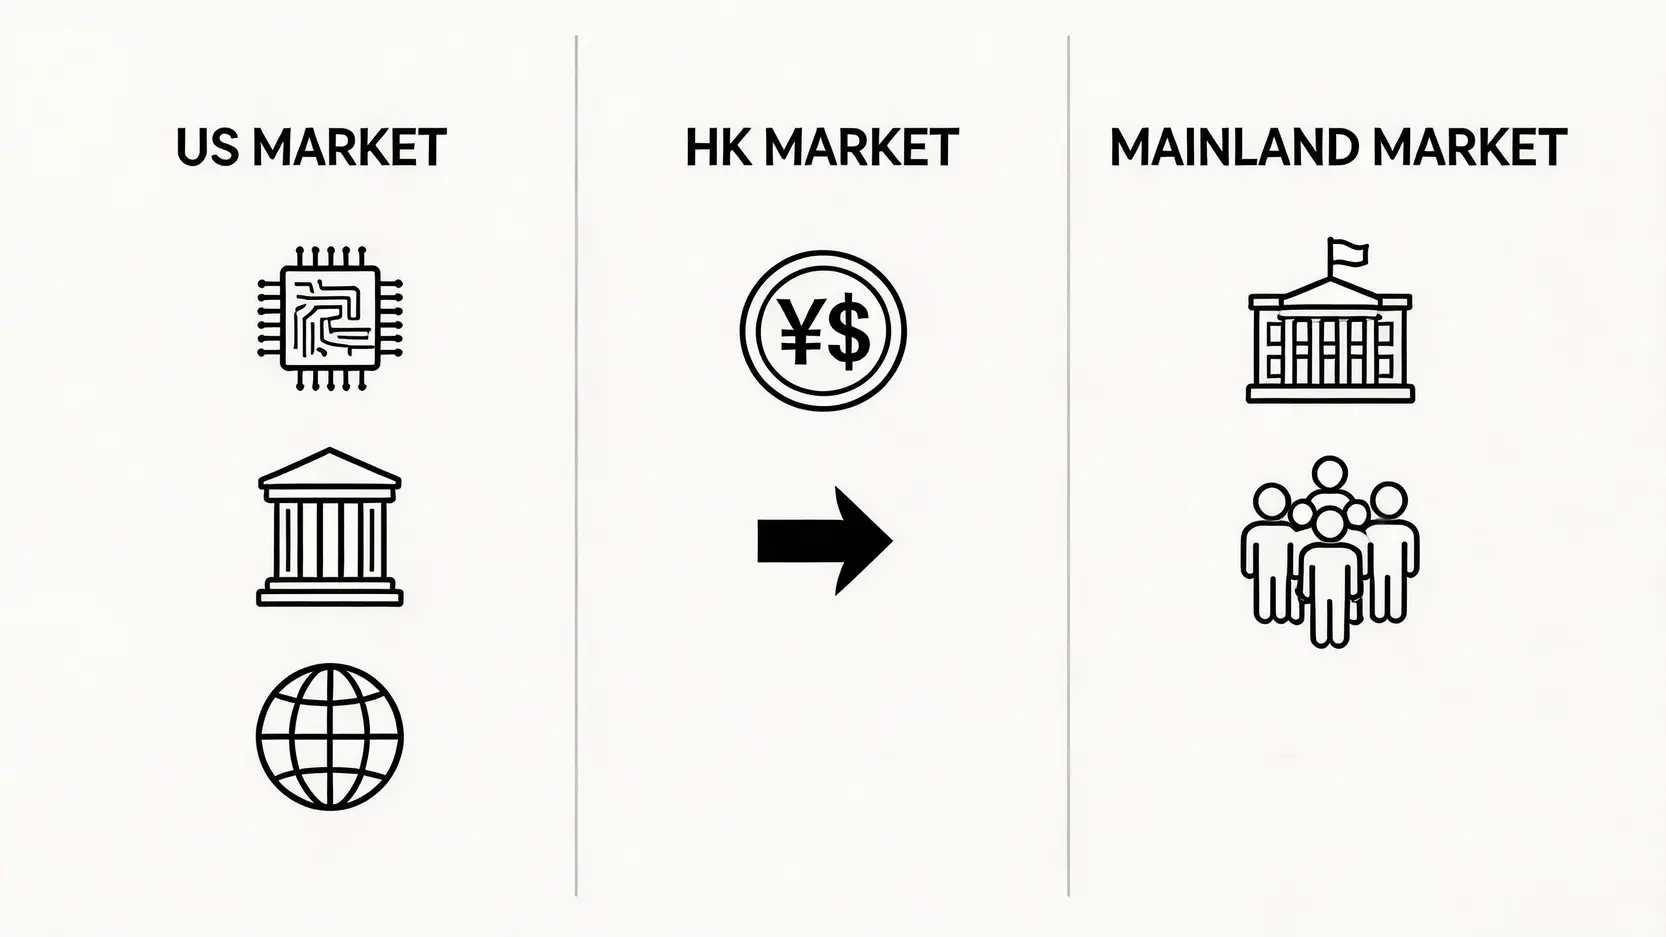
In summary, whether it is US stocks driven by technological innovation, Hong Kong stocks influenced by international capital flows, or Mainland China’s policy-oriented A-share market, each market’s bull cycle has its own historical logic and driving factors. Understanding the differences and commonalities of global bull market cycles is fundamental to creating a long-term successful investment strategy. Rather than blindly guessing market tops, investors should objectively assess their stage through economic, sentiment, and valuation indicators. This is the only way to remain rational through market cycles, truly navigate bull and bear phases, and achieve long-term financial growth.


Global Bull Market Cycle FAQ

Q: How long does a bull market typically last?

A: There is no fixed duration; it varies widely. In US history, the average bull market lasts about 4–5 years, while the longest bull (2009–2020) lasted nearly 11 years. In Mainland China, bull markets are usually shorter, often only 1–2 years. Duration depends on economic fundamentals, monetary policy, market structure, and investor sentiment.

Q: How should investors adjust strategy in the late stage of a bull market?

A: When signs of the excess phase appear (high valuations, mass speculation), gradually reduce risk exposure. Specific strategies include: 1. Sell profitable positions in batches to lock in gains. 2. Increase cash allocation. 3. Shift some funds to defensive sectors (utilities, consumer staples) or safe-haven assets like gold. 4. Avoid using high leverage to chase highs.

Q: What could trigger the next global bull market?

A: Potential triggers include: 1. Revolutionary tech breakthroughs, e.g., widespread commercial AI applications or mature new energy technologies creating new growth engines. 2. Major central banks entering a rate-cutting and easing cycle. 3. Resolution of geopolitical risks and improved global trade relations, boosting market confidence. 4. Deep bear markets followed by historically attractive asset valuations.

Q: What is the difference between a market correction and a bear market?

A: The key differences are in magnitude and duration. A market correction usually refers to a decline of 10–20% from recent highs, seen as a normal adjustment in a bull market, lasting weeks to months. A bear market involves declines over 20%, often with recession expectations, lasting a year or more, representing a reversal of the long-term trend.

编者
Evan Lin

Evan Lin

我是Evan Lin,从大学时期开始接触外汇交易,至今已有多年实战经验,熟悉技术分析与EA策略,热衷于研究市场脉动与风险管控,喜欢分享实战经验和交易技巧,和大家一起学习、一起进步!

If you liked this article, please share it!

Related Articles

  • Inflation Explained: Protecting Your Wealth in Taiwan
    Your Money Is Losing Value! Understanding How Inflation Affects the Purchasing Power of the Taiwan Dollar and Wealth Preservation in One Article Have you ever felt that NT$1,000 doesn't buy as much as it used to? A lunch box that once cost NT$80 now costs NT$120, and movie tickets have...
    2026 年 6 月 12 日
  • Trading Drawdown Recovery: Psychological Adjustment Guide
    The Taiwan Dollar Surges Past 31.5! With Hot Money and Foreign Capital Inflows, Is This an Opportunity or a Risk? An In-Depth Analysis The Capital Frenzy: The Three Major Drivers Behind the Taiwan Dollar Breaking Above 31.5 The New Taiwan dollar has recently become the absolute focal point of the...
    2026 年 6 月 10 日
  • Taiwan Dollar Surge: Stocks, Bonds, or USD?
    Taiwan Dollar Appreciation and Hot Money Inflows! An Investor's Action Guide: Should You Buy Stocks, Bonds, or Exchange for US Dollars at This Stage? One of the hottest topics in the market recently has been the capital-driven rally fueled by foreign investors' consecutive net buying of Taiwan stocks, pushing the...
    2026 年 6 月 10 日
返回顶部