Fed Dot Plot Explained: Predict 2026 Rate Moves

Complete Analysis of the Federal Reserve’s Interest Rate Path: Understand the Dot Plot and FOMC Meetings to Predict Rate Hike and Rate Cut Trends in 2026
Markets change rapidly, and every decision made by the Federal Reserve (Fed) affects investors around the world. Are you often confused by terms such as “rate hikes”, “rate cuts”, “hawkish”, and “dovish”? Forecasts of the Federal Reserve’s interest rate path also affect the performance of various assets, from stocks and bonds to real estate. This article provides a complete guide to the Federal Reserve’s interest rate path, covering everything from basic concepts to professional tools. It will help you understand the decision-making logic behind FOMC meetings and learn how to predict rate hike and rate cut trends in 2026, as well as the subsequent direction of interest rates, providing clear guidance for your investment positioning.
What Is the Federal Reserve’s Interest Rate Path, and Why Is It So Important to You?
Before exploring forecasting methods in depth, we must first understand the core concept of the “Federal Reserve’s interest rate path”. Simply put, it is the expected trajectory of future policy rates set by the Federal Reserve and provides the market with clues about future funding costs.
Definition: What Is the Federal Funds Rate?
First, the interest rate controlled by the Fed is not the deposit or lending rate that individuals directly encounter, but the Federal Funds Rate. This is the interest rate at which US banks lend money to one another overnight. The Fed uses tools such as open market operations (OMO) to keep this rate within a target range. Although individuals cannot participate directly in this market, it serves as the “faucet” of the entire financial system. All commercial interest rates, including mortgage rates, credit card rates, and corporate loan rates, are adjusted based on it.
The Significance of the Interest Rate Path: An Economic “Traffic Signal” for the Future
The “interest rate path” refers to market and Fed officials’ forecasts of the level the Federal Funds Rate will reach at a particular point in the future (such as the end of 2026 or during 2027). This path acts like a “traffic signal” for the economic outlook:
- Expected Path Moves Higher (Rate Hikes): This indicates that the Fed believes the economy is overheating and needs to apply the brakes to curb inflation.
- Expected Path Moves Lower (Rate Cuts): This indicates that the Fed believes the economy is weakening and needs to press the accelerator to stimulate consumption and investment.
- Expected Path Remains Unchanged: This indicates that the Fed considers the current interest rate level appropriate and economic conditions stable.
Therefore, understanding the interest rate path means gaining insight into how the world’s most powerful central bank views the future economy, making it crucial for all investors.
How Rate Hikes and Rate Cuts Affect Your Wallet: From Mortgages and Savings to the Stock Market
The Fed’s interest rate decisions may seem distant, but they directly affect our finances through the following channels:
- Deposits and Savings: When rates rise, bank deposit rates generally increase, allowing savers to earn more interest. Conversely, rate cuts reduce interest income from deposits.
- Mortgages and Consumer Loans: Rate hikes increase repayment pressure on variable-rate mortgages, car loans, and other loans, while rate cuts reduce the burden.
- Stock Market: Rate hikes are generally unfavourable for the stock market. Higher borrowing costs can erode corporate profits, while also making bonds and other fixed-income products more attractive, potentially causing capital to flow out of stocks. Learning the basics of US stock investing is highly useful for understanding these relationships.
- Corporate Investment: Rate hikes increase companies’ financing costs, potentially causing them to postpone or cancel investment plans and reducing economic activity.
Further Reading (Highly Recommended)
Decoding the Fed’s Secret Language: Three Key Tools for Predicting the Interest Rate Path
Predicting the Federal Reserve’s interest rate path cannot rely solely on guesswork. The Fed provides several semi-public communication tools to help the market understand its decision-making process. By mastering these tools, you can analyse the Fed’s direction like a professional.
[FOMC Meetings]: The Core of Decision-Making Eight Times a Year, With a Schedule and Key Highlights
The Federal Open Market Committee (FOMC) is the Fed’s decision-making body and consists of 12 members. It holds eight regularly scheduled meetings each year to determine interest rate levels and other monetary policies. A statement is released after every meeting. Four meetings (held in March, June, September, and December) are particularly important because the Chair holds a press conference afterwards and releases the latest Summary of Economic Projections (SEP) and the “dot plot”.
Below is the 2026 FOMC meeting schedule compiled from the Federal Reserve’s official website. It is recommended that you save it for future reference:
| Meeting Month | Meeting Dates | Whether Economic Projections and the Dot Plot Are Released |
| January | 27-28 | No |
| March | 17-18 | Yes |
| April | 28-29 | No |
| June | 16-17 | Yes |
| July | 28-29 | No |
| September | 15-16 | Yes |
| October | 27-28 | No |
| December | 8-9 | Yes |
[Dot Plot]: The Most Intuitive Interest Rate Forecast From Officials, Explained Step by Step
The dot plot is the most intuitive tool for understanding Fed officials’ views on future interest rates. It anonymously displays each FOMC member’s forecast for year-end interest rate levels over the coming years. One dot represents one official’s view. Understanding the dot plot requires only a few steps:
- Find the Median: Examine the distribution of dots for a specific year (such as 2026) and locate the middle dot. This represents the collective consensus of the FOMC.
- Observe the Distribution: Are the dots concentrated or widely dispersed? If the dots are highly dispersed, it indicates significant disagreement among officials and greater policy uncertainty.
- Compare Changes: Compare the latest dot plot with the previous quarter’s dot plot (from three months earlier). If the median moves higher, it indicates that the Fed’s overall stance has become more hawkish (with a greater inclination towards rate hikes). If it moves lower, the stance has become more dovish (with a greater inclination towards rate cuts).
Through the dot plot, investors can gain insight into the Fed’s internal policy direction and adjust their expectations for the future Federal Reserve interest rate path accordingly.
[Forward Guidance and the Chair’s Remarks]: Interpreting Hawkish and Dovish Signals
In addition to the data, the Fed Chair’s remarks during the post-meeting press conference and the wording of the meeting statement are forms of “forward guidance” filled with clues. The market carefully analyses every statement made by the Chair to determine whether the stance is “hawkish” or “dovish”.
- Hawkish: More concerned about inflation and inclined towards raising rates or maintaining high interest rates. Common phrases include “inflation remains persistent”, “more evidence is needed”, and “further tightening cannot be ruled out”.
- Dovish: More concerned about economic recession and unemployment and inclined towards cutting rates or maintaining low interest rates. Common phrases include “progress on inflation”, “two-sided risks”, and “policy is restrictive”.
The Chair’s remarks often trigger sharp market fluctuations because they represent the most immediate views of policymakers.
The Ultimate Economic Data Showdown: Three Core Indicators That Determine the Interest Rate Path

The Three Core Economic Indicators Behind Federal Reserve Decisions
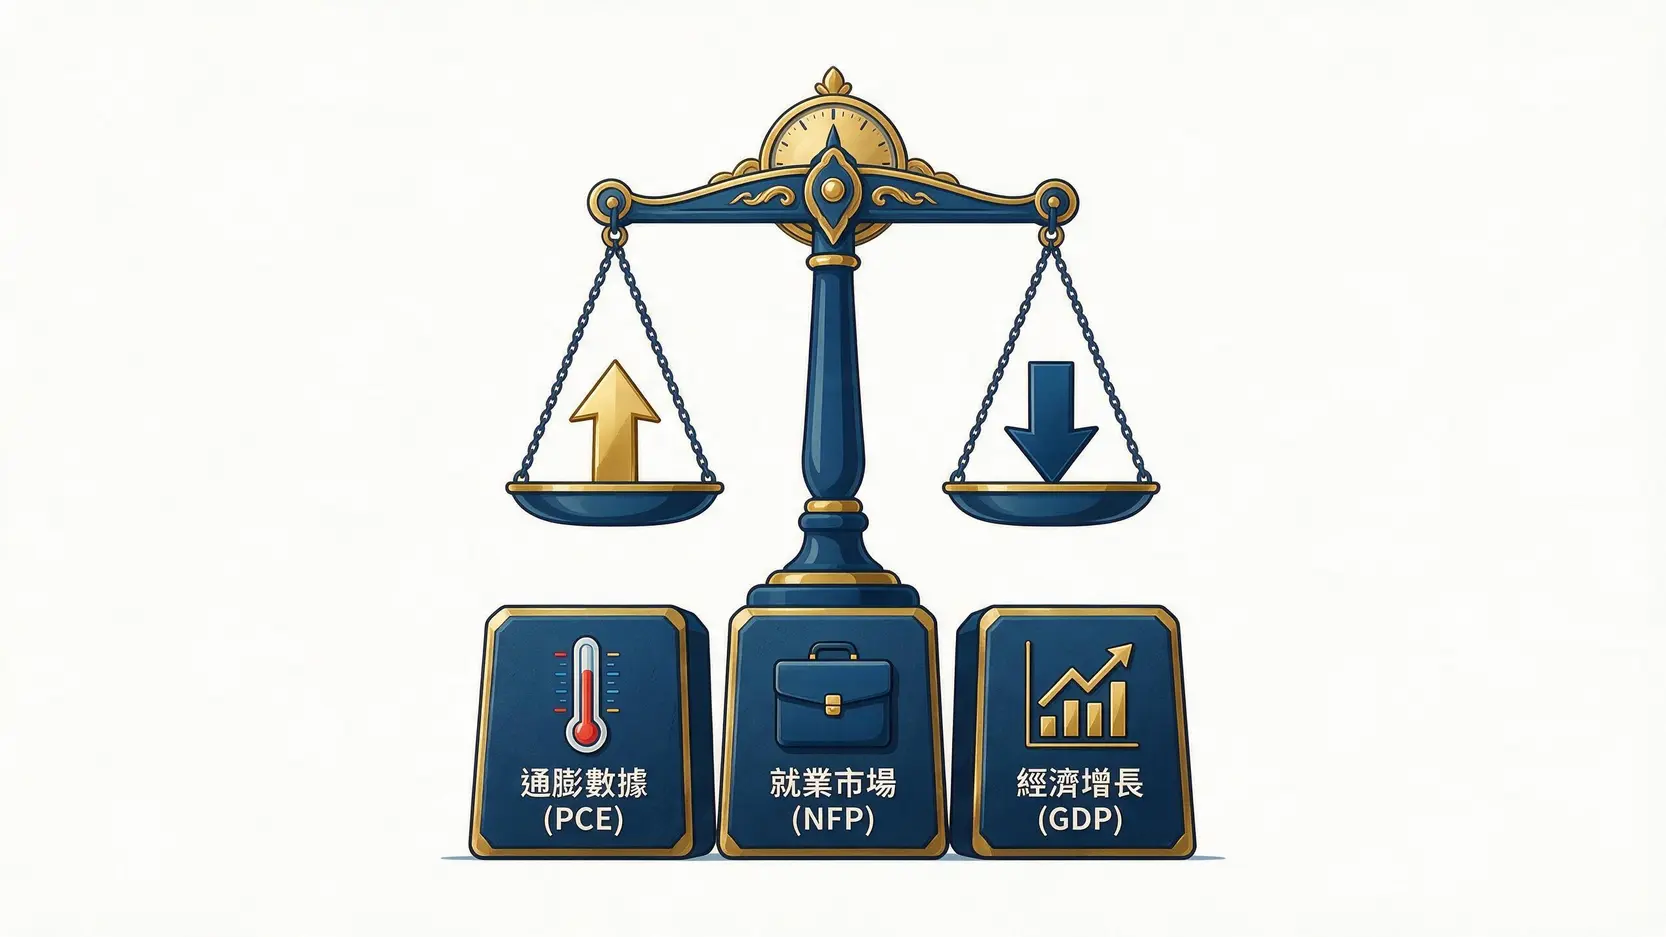
Fed decisions are not made in isolation, but are “data-dependent”. To predict the Federal Reserve’s interest rate path, investors must track the three core economic indicators that matter most to the Fed, an area that many investment beginners tend to overlook.
Inflation Data: Core Personal Consumption Expenditures Price Index (PCE) vs. Consumer Price Index (CPI)
Fighting inflation is one of the Fed’s core responsibilities. Although the market pays more attention to the Consumer Price Index (CPI), which is released earlier each month, the Fed’s official preferred inflation measure is the Personal Consumption Expenditures Price Index (PCE), particularly “core PCE”, which excludes food and energy prices.
- PCE: Released by the US Bureau of Economic Analysis (BEA), its weightings are adjusted according to changes in consumer behaviour, allowing it to reflect actual substitution effects more effectively. The Fed therefore considers it more comprehensive.
- CPI: Places greater emphasis on goods and services paid for “out of pocket” by consumers.
In general, PCE tends to fluctuate less than CPI. The Fed’s long-term inflation target is 2%. Only when core PCE clearly and consistently declines towards this target is the Fed likely to consider beginning a rate-cut cycle.
Labour Market: The Importance of the Non-Farm Payrolls Report (NFP) and the Unemployment Rate
Another core responsibility of the Fed is achieving “maximum employment”. Therefore, the health of the labour market is another major pillar in determining the interest rate path. Among the relevant indicators, the Non-Farm Payrolls (NFP) report attracts the most market attention.
- Non-Farm Payroll Growth: Reflects the strength of economic activity. If the data significantly exceeds expectations, it indicates a strong economy and may intensify inflationary pressure, reducing the urgency for the Fed to cut rates.
- Unemployment Rate: A low unemployment rate is positive, but an excessively low rate may indicate a tight labour market, increasing the risk of a wage-inflation spiral, which the Fed does not want to see.
- Wage Growth: The growth rate of average hourly earnings is a key indicator of inflationary pressure. If wages rise too quickly, they will directly push up costs in the services sector.
Understanding the Non-Farm Payrolls report can help you assess the Fed’s next move more accurately.
Further Reading (Highly Recommended)
Economic Growth: The Role of Gross Domestic Product (GDP)
Gross domestic product (GDP) is the ultimate indicator used to measure a country’s total economic output. Strong GDP growth is usually accompanied by robust consumption and investment, which may push inflation higher and support the Fed in maintaining higher interest rates. Conversely, weak GDP data or even negative growth indicates that the economy may face recession risks, significantly increasing pressure on the Fed to cut rates. GDP data is usually released quarterly. Although it is published less frequently, it provides the macroeconomic context for the Fed’s economic assessment.
FAQ: Key Questions About Federal Reserve Interest Rates
Q: How Many Times Does the Federal Reserve Meet Each Year? 2026-2027 Meeting Schedule
A: The Federal Reserve’s FOMC holds eight regularly scheduled meetings each year, approximately once every six weeks. The 2026 meeting dates are listed above. As for 2027, although the official dates will be announced in the middle or second half of 2026, based on past practice, the meetings will generally take place in January, March, May, June, July, September, November, and December. Please continue monitoring the latest official announcements.
Q: What Do “Hawkish” and “Dovish” Mean?
A: These terms describe the monetary policy preferences of central bank officials. “Hawkish” officials place greater emphasis on controlling inflation, even if doing so may sacrifice some economic growth. Therefore, they tend to support rate hikes or maintain high interest rates. “Dovish” officials place greater emphasis on promoting economic growth and employment and are willing to tolerate slightly higher inflation. Therefore, they tend to support rate cuts or maintain low interest rates.
Q: Apart From Interest Rates, What Other Monetary Policy Tools Does the Federal Reserve Have?
A: In addition to adjusting the Federal Funds Rate, the Fed has several other important tools. The most notable is “balance sheet policy”, including:
1. Quantitative Easing (QE): When interest rates have already fallen close to zero, the Fed injects liquidity into the market by directly purchasing government bonds and mortgage-backed securities (MBS), thereby lowering long-term interest rates.
2. Quantitative Tightening (QT): The opposite of QE, under which the Fed stops purchasing or directly sells the bonds it holds to withdraw liquidity from the market and push long-term interest rates higher.
Q: Are the Dot Plot’s Forecasts Always Accurate?
A: Not necessarily. First, the dot plot only reflects officials’ individual forecasts at a particular point in time and is not a commitment. These forecasts change as new economic data is released. Second, the chart includes forecasts from all FOMC members, but not all of them have voting rights in a given year. Therefore, it is more of an indicative reference than a precise roadmap. Investors should view it as a tool for observing changes in the Fed’s internal direction rather than as a 100% accurate prediction.
Conclusion
In summary, understanding the Federal Reserve’s interest rate path is not out of reach. By regularly monitoring FOMC meetings, learning how to interpret the dot plot, and continuously tracking the three core economic indicators of inflation, represented by core PCE, employment, represented by the Non-Farm Payrolls report, and economic growth, represented by GDP, you can assess market trends more accurately. By incorporating this knowledge into your investment decision-making framework, you will be better prepared to make wiser judgements whether the market faces rate hikes or rate cuts in the future.
Related Articles
-
US Airstrikes on Iran Trigger Oil Price Surge: Tomahawk Missiles and Global Economic Impact Did the World Change Overnight? In July 2026, news of US airstrikes on Iran shocked the world, triggering severe volatility in international crude oil prices. Brent crude futures briefly surged above US$120, causing oil prices to...2026 年 7 月 22 日
-
Strait of Hormuz Closure: Is a Fourth Oil Crisis Coming? Complete Event Timeline: From Iran’s Announcement to the Surge in International Oil Prices In July 2026, shocking news reverberated around the world: Iran’s Islamic Revolutionary Guard Corps announced through an official statement that it would “indefinitely close” the Strait of...2026 年 7 月 22 日
-
How Do Oil Prices Trigger Inflation? Understand the Butterfly Effect of the “Oil Price Transmission Chain” Every time you refuel and see oil prices continuing to rise, do you worry that this is only the beginning? From international crude oil prices to everyday consumer prices, an invisible “oil price transmission...2026 年 7 月 22 日