Gold Short-Term Trading: 3 Proven Strategies

Gold Short-Term Trading Strategies: Illustrated Guide to 3 High-Probability Techniques Used by Professional Traders
Faced with gold’s intense price volatility, short-term trading has become a popular choice for those seeking quick profits. However, without a solid gold short-term trading strategy, trading is little more than gambling. The market is flooded with information, and without systematic organization and practice, it is difficult to turn that information into real profitability. The reason successful traders achieve consistent profits lies in their deep understanding of technical analysis indicators and their disciplined execution of gold day trading techniques. This article provides a detailed illustrated guide to three gold short-term trading strategies commonly used by professional traders. From indicator settings to entry and exit timing, it will help you build your own trading system step by step so that you no longer place trades based on intuition alone.
Strategy 1: Trade With the Trend – Moving Average (MA) Trend-Following Strategy
Among all gold short-term trading strategies, trend trading is the most classic and beginner-friendly approach. The Moving Average (MA) is one of the best tools for identifying trend direction. Its core principle is simple: “ride rising markets higher and falling markets lower”. When a trend develops, follow it closely and profit from its momentum.
Setting Your Moving Average Parameters: Choosing Fast and Slow Lines
Short-term trading emphasizes responsiveness, so shorter-period moving average combinations are commonly used. Typical settings include:
- Fast Line (Short-Term MA): Usually set to 5MA or 10MA to capture the latest price changes and momentum.
- Slow Line (Long-Term MA): Usually set to 20MA or 30MA to confirm the primary bullish or bearish trend direction.
When the fast line crosses above the slow line, it indicates strengthening short-term momentum and a potential shift from a bearish to a bullish trend. Conversely, when the fast line falls below the slow line, it may signal a bearish trend reversal.
Entry Signals: Golden Cross and Death Cross
By using crossovers between the fast and slow moving averages, we can establish clear entry and exit signals, making this a favorite method among many intraday traders:
- Golden Cross: When the fast line (such as the 10MA) breaks strongly above the slow line (such as the 30MA), a Golden Cross is formed. This is a clear bullish entry signal, indicating strong upward momentum and a potential long (buy) opportunity.
- Death Cross: When the fast line falls below the slow line, a Death Cross is formed. This is a bearish signal, indicating potential market weakness and a possible short (sell) opportunity.

Illustration: Golden Cross and Death Cross Signals Using Moving Averages
Exit and Stop-Loss: Using Trailing Profits or Exiting When Price Breaks a Key Moving Average
After entering a trade, exiting effectively is critical to profitability. Below are two common exit methods:
- Price Breaks a Key Moving Average: For long positions, the slow moving average (such as the 30MA) can serve as the trend’s lifeline. As long as price remains above the slow MA, the position can be held. Once price clearly closes below the slow MA, it may indicate the trend has ended, and the position should be closed decisively.
- Trailing Take-Profit: Set a fixed profit target, such as a 2:1 risk-reward ratio. If your stop-loss is 20 points, set your take-profit at 40 points. Alternatively, use a trailing stop by continuously moving the stop-loss higher (for long positions) or lower (for short positions) as profits increase, thereby locking in gains.
Strategy 2: Range Trading – RSI Countertrend Strategy
Gold prices are not always trending. Roughly 70% of the time, they fluctuate within a trading range. During these “sideways markets”, trend-following strategies often fail, while the RSI countertrend strategy becomes highly effective. Its core principle is “buy oversold, sell overbought“, which is essentially buying low and selling high.
Identifying Trading Ranges: How to Recognize Support and Resistance
Before using the RSI strategy, the first task is confirming that the market is moving sideways. Observe the candlestick chart. If price repeatedly retreats after reaching a certain high and rebounds after reaching a certain low, these levels form resistance and support zones. When price moves back and forth between these levels like a ping-pong ball, it creates an ideal environment for the RSI strategy.
Entry Signals: Buy When RSI Enters Oversold Territory (<30), Sell When It Enters Overbought Territory (>70)
RSI (Relative Strength Index) measures the strength of buying and selling pressure and ranges from 0 to 100. The standard approach is as follows:
- Oversold Zone: When the RSI falls below 30, it suggests that the market has declined too rapidly in the short term and that selling pressure may be exhausted, creating a potential buying opportunity. Consider entering a long position when price is near the support zone.
- Overbought Zone: When the RSI rises above 70, it suggests that the market has advanced too far in the short term and that buying pressure may be weakening, creating a potential selling opportunity. Consider entering a short position when price approaches the resistance zone.

Illustration: Using RSI to Buy Low and Sell High Within a Trading Range
Professional Tip: To improve the probability of success, traders can wait for the RSI indicator to “turn back up” from the oversold zone before entering a long position, or “turn back down” from the overbought zone before entering a short position, helping to avoid trying to catch a falling knife.
Exit and Stop-Loss: Close Positions at the Midline or When Price Reaches the Opposite Side of the Range
Countertrend trading carries higher risk, making strict stop-loss and take-profit rules essential:
- Take-Profit: There are two common methods. First, close the position when the RSI returns to the midpoint level of 50, indicating that buying and selling pressure has returned to balance. Second, close the position when price successfully reaches the opposite side of the range (such as buying at support and exiting near resistance).
- Stop-Loss: Place the stop-loss below the support zone (for long positions) or above the resistance zone (for short positions). If price breaks below support or above resistance, it may signal the end of the trading range and the beginning of a new trend. In that case, the countertrend trade should be exited immediately.
Further Reading (Highly Recommended)
What Is a Candlestick? How to Understand the Secrets of the Market?
Strategy 3: Momentum Breakout – Bollinger Bands Breakout Strategy
When gold prices emerge from consolidation and prepare for a major move, the Bollinger Bands breakout strategy becomes a powerful tool for capturing the new trend. Bollinger Bands consist of three lines: the middle band (typically a 20MA), the upper band (middle band + 2 standard deviations), and the lower band (middle band – 2 standard deviations). The core logic is that prices spend most of their time trading within the bands, and a strong breakout beyond the bands often signals the beginning of a new trend. You can refer to Wikipedia’s authoritative explanation of Bollinger Bands to understand the statistical principles behind the indicator.
Identifying the “Squeeze” Phase: A Signal That a Major Move Is Approaching
Before a significant market move occurs, the market often enters a period of compressed energy. On Bollinger Bands, this appears as the distance between the upper and lower bands becoming increasingly narrow, forming a “Squeeze” pattern. It is like the calm before a storm. The narrower the bands become and the longer the squeeze lasts, the stronger the subsequent breakout may be. Gold intraday traders closely monitor this signal in anticipation of upcoming volatility.
Entry Signals: Strong Breakouts Above the Upper Band or Below the Lower Band
Once a “squeeze” develops, your task is simply to wait patiently for a breakout signal:
- Upside Breakout: When a strong bullish candlestick (red K) closes decisively above the upper Bollinger Band, it indicates an explosion of bullish momentum and provides a long (buy) entry signal.
- Downside Breakout: When a strong bearish candlestick (Black K) closes decisively below the lower Bollinger Band, it indicates the release of bearish pressure and provides a short (sell) entry signal.

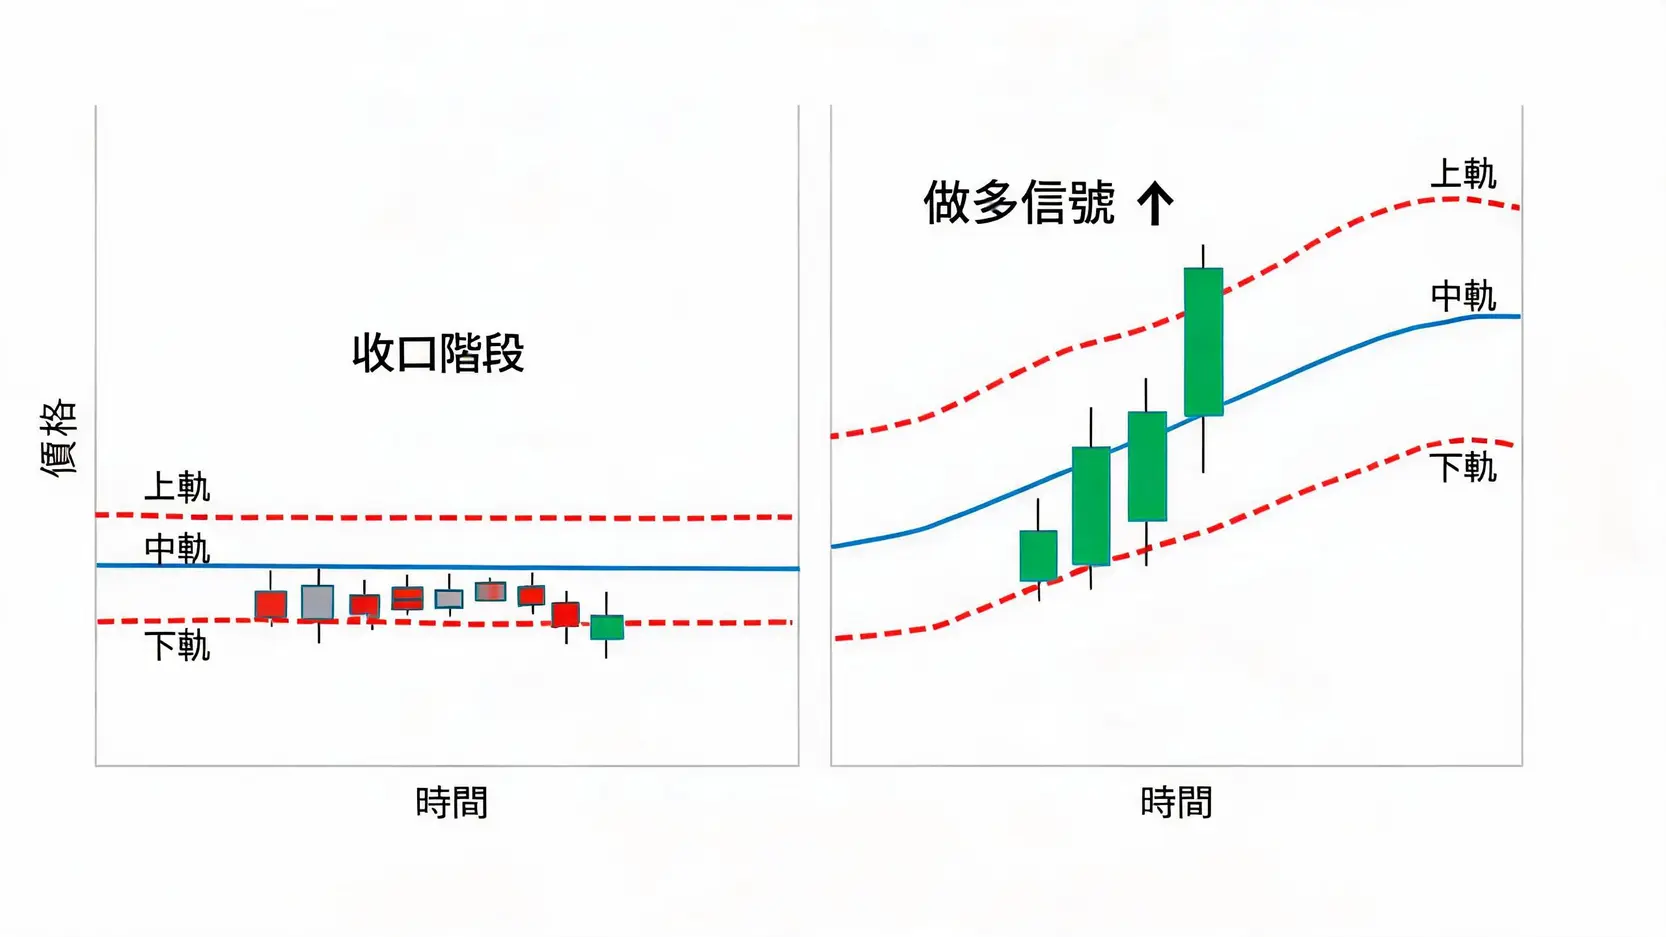
Illustration: The Momentum Expansion Process From Bollinger Band Squeeze to Breakout
Note: A “breakout” must be strong and convincing. Ideally, most of the candlestick’s body should be outside the band to avoid being misled by false “breakout attempts” or temporary price spikes.
Exit and Stop-Loss: Using the Middle Band or Reversal Signals as Exit Criteria
The goal of a breakout strategy is to capture a meaningful trend, so exit rules should also be based on trend-following principles:
- Exit Criteria: The simplest approach is to use the middle band (20MA) as a trailing profit line. After entering a long position, continue holding as long as price remains above the middle band. Once price pulls back and breaks below the middle band, it may signal that the trend is losing momentum, making it a suitable point to take profits.
- Stop-Loss Criteria: For long positions, the stop-loss can be placed below the middle band or below the low of the breakout candlestick. For short positions, the stop-loss can be placed above the middle band or above the high of the breakout candlestick.
Common Principles for Successful Gold Short-Term Trading
Regardless of which gold short-term trading strategy you choose, or whether you combine multiple strategies, the following two principles form the foundation of success. Their importance often exceeds that of the strategy itself.
Strict Money Management and Risk Control
No short-term trading strategy can achieve a 100% win rate. The biggest difference between a professional trader and an amateur lies in how they handle losses. You must establish your own risk management system:
- Position Sizing Control: Never allow a single trade to lose more than 2% of your total capital. For example, if you have $10,000, the maximum loss on any single trade should not exceed $200.
- Set a Risk-Reward Ratio: Plan your take-profit and stop-loss levels before entering a trade. In a healthy trade setup, the potential profit (take-profit) should be at least 1.5 times the potential loss (stop-loss), meaning the risk-reward ratio should be greater than 1.5.
- Never Average Down: If a trade is already losing money, never add to the position simply because the price appears “cheaper”. Doing so only magnifies a mistake.
Create a Trading Plan and Follow It Strictly
Impulse is the greatest enemy of short-term trading. Before the trading session begins, you should prepare a detailed trading plan that includes:
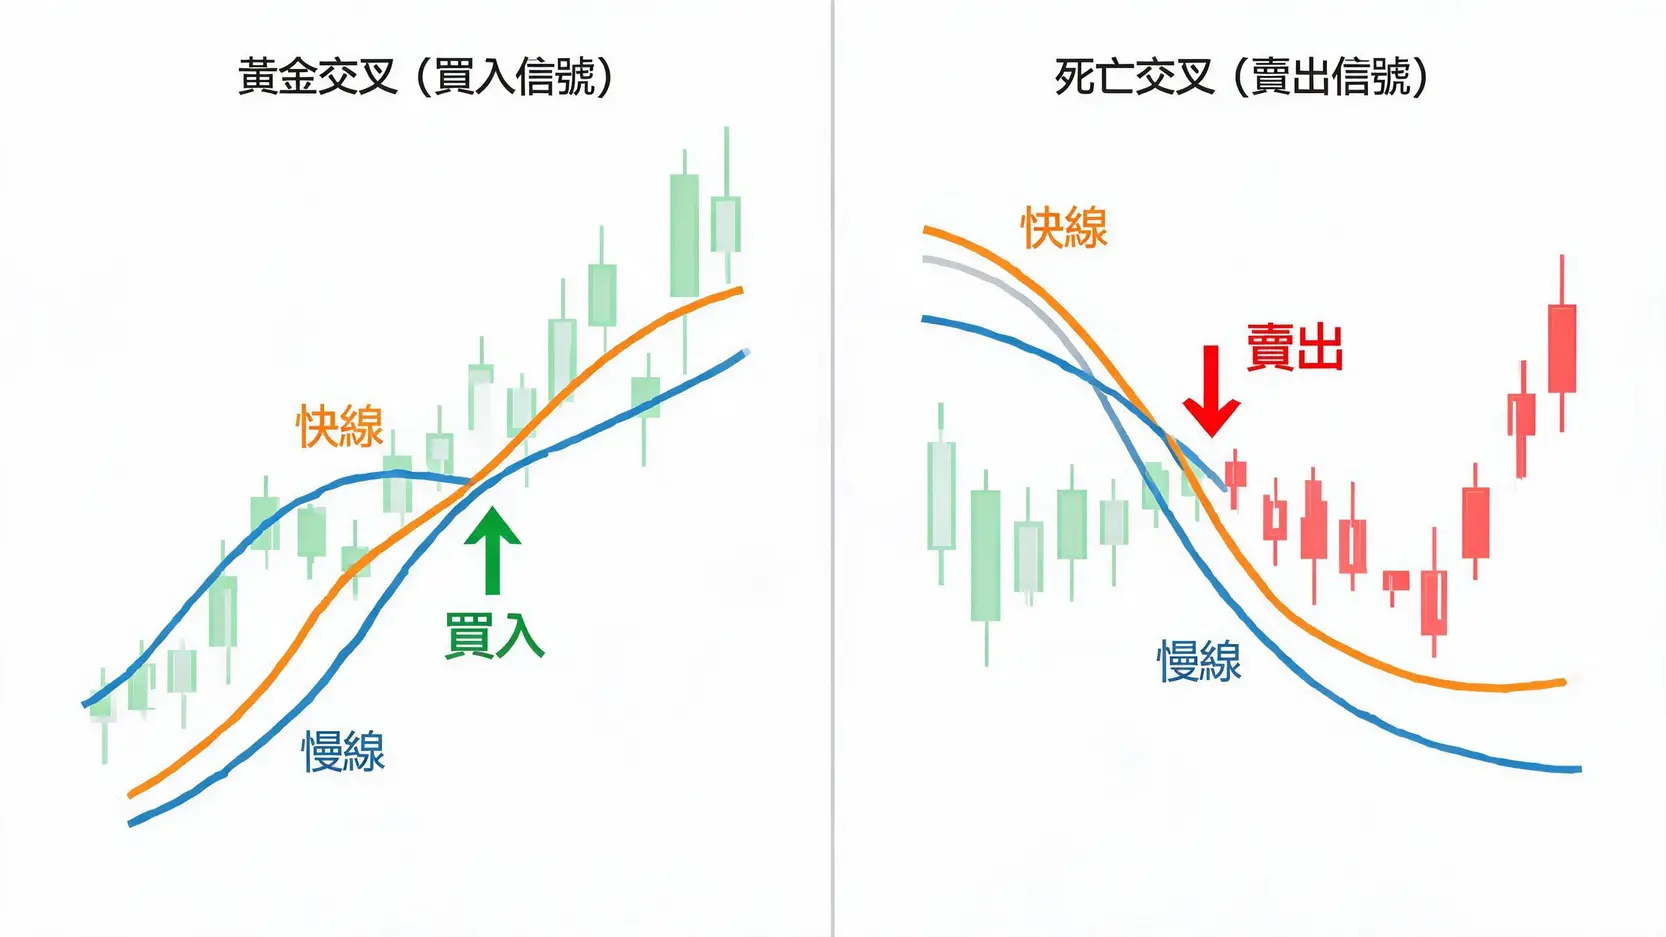
- Entry Conditions: What specific signal from which strategy must appear before entering a trade? (For example, a Golden Cross on the 15-minute chart.)
- Exit Conditions: Where is the stop-loss placed? What is the profit target?
- Market Conditions: Are there any major economic data releases scheduled today? Is the market trending or consolidating?
Once the plan is established, the only thing you should do during trading hours is “execute” it. Eliminate emotional interference and follow your rules like a machine. This is the true path toward long-term, consistent profitability.
Conclusion
Successful gold short-term trading does not rely on a single indicator or a magical holy grail. Instead, it requires a complete trading system that includes entry rules, exit rules, money management, and trading discipline. The Moving Average trend-following strategy, RSI countertrend strategy, and Bollinger Bands breakout strategy introduced in this article each correspond to different market conditions: trends, consolidations, and turning points. Beginners are encouraged to start with a demo account and repeatedly practice these three strategies while observing how they perform under different market conditions. Through this process, you can identify the approach that best suits your trading style and personality. Always place risk management above everything else. Only by surviving in the market can you have the opportunity to pursue profits.
Gold Short-Term Trading Strategy FAQ
Q: Which candlestick timeframe is best for gold short-term trading?
A: It depends on your trading style. For traders seeking multiple trades within a single day, 5-minute and 15-minute charts are the most common choices, as they provide more immediate price signals. For intraday swing traders who may only place one or two trades per day, 30-minute or 1-hour charts are often preferred for identifying the overall trend, while 5-minute or 15-minute charts are used to pinpoint precise entry points.
Q: Under what market conditions are these strategies likely to fail?
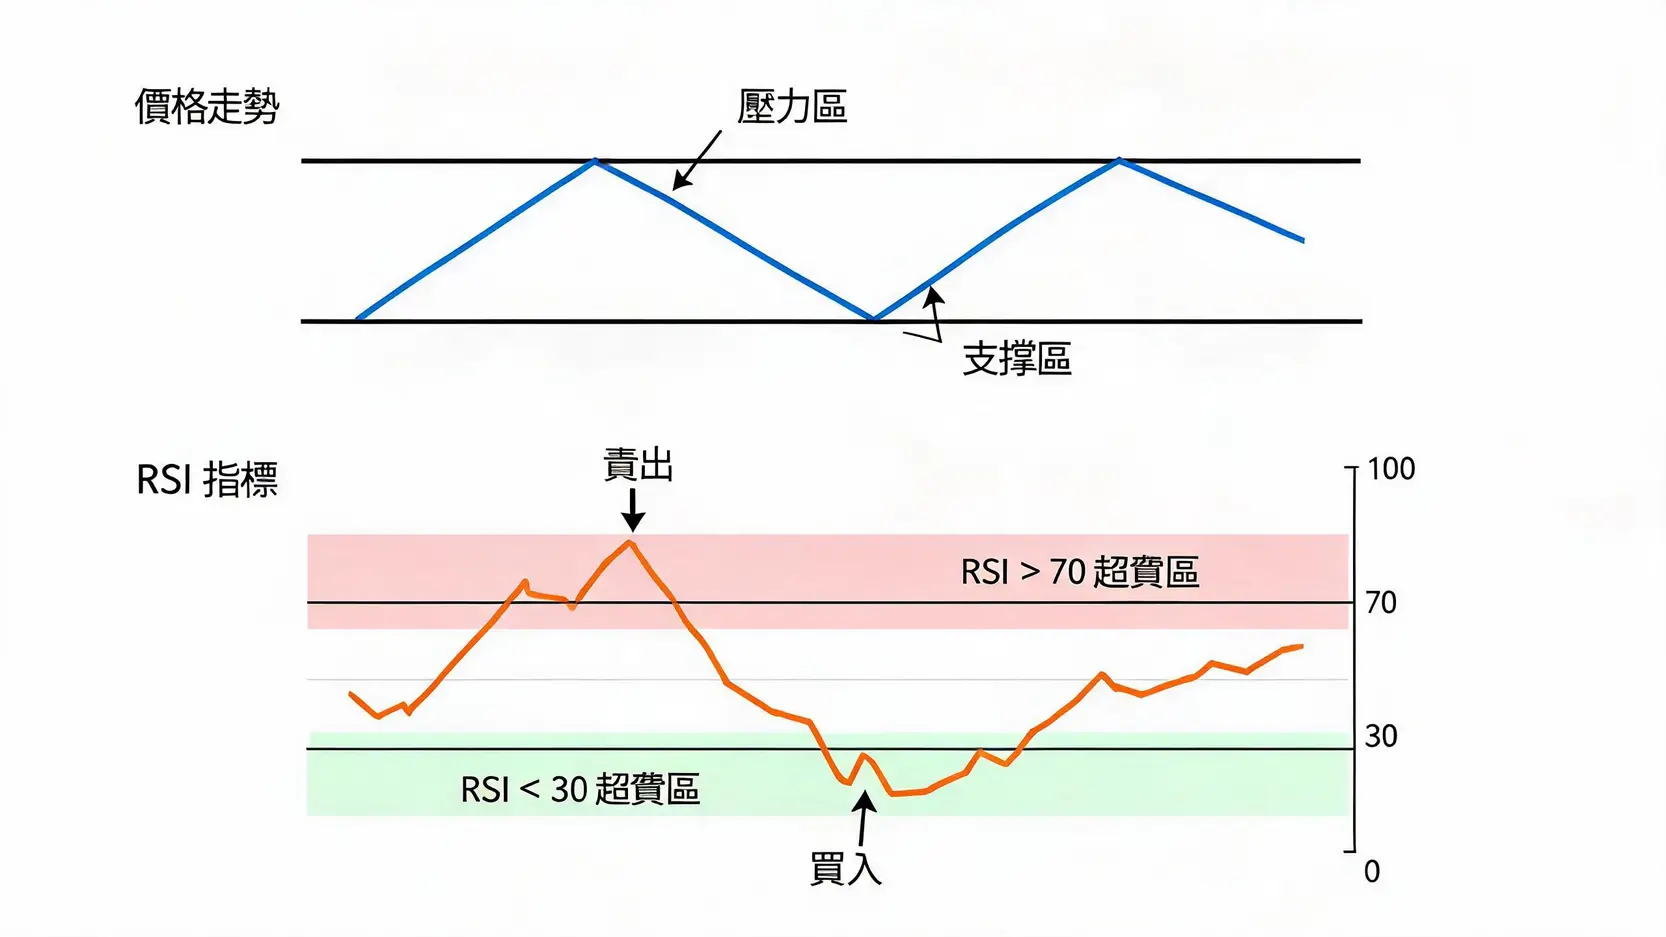
A: No strategy is universally effective. The MA trend-following strategy performs poorly during sideways markets, where frequent false Golden Cross and Death Cross signals can result in losses. Conversely, the RSI countertrend strategy can completely fail during strong one-way trends. For example, in a strong bull market, RSI may remain overbought for an extended period, and repeatedly shorting the market can lead to significant losses. The Bollinger Bands breakout strategy is vulnerable to “false breakouts”, where price breaks beyond the bands but quickly reverses, causing traders to buy high or sell low at the wrong time.
Q: Which strategy should beginners learn first?
A: For beginners, the most recommended starting point is the “Moving Average (MA) trend-following strategy”. The logic of trading with the trend is the most intuitive, easiest to understand, and relatively safer. Learning how to identify and follow trends is the first step toward building trading confidence. Once you become proficient with moving averages, you can gradually learn RSI and Bollinger Bands strategies to handle different market environments.
Q: How much capital is needed for gold short-term trading?
A: It depends on the platform and product specifications you trade. For example, when trading Gold CFDs, leverage may allow you to start with only a few hundred US dollars. However, the key consideration is not the minimum capital requirement but your “risk tolerance”. Beginners are advised to use only disposable funds that would not affect their daily lives if completely lost. In addition, always start with the smallest available position size, (such as 0.01 lots) when practicing.
Related Articles
-
Does Gold Always Rise When the Fed Cuts Rates? Understanding the Complete Relationship Between Interest Rates and Gold Prices Through 3 Key Perspectives A popular market saying goes: "When the Fed cuts rates, gold rises." This phrase has become almost a standard answer for gold investors. But what is the...2026 年 6 月 16 日
-
Has Gold Reached Its Peak? Can You Still Buy Gold in 2026? 3 Key Risks and a Decision-Making Framework Every Investor Must Understand Before Investing As gold prices continue to hit new highs, are you also struggling with the age-old question: "Can you still buy gold?" Market sentiment is running...2026 年 6 月 16 日
-
Why Does Gold Keep Rising? Experts Reveal the 5 Key Reasons Behind Gold's Record High Prices in 2026 Have you also been puzzled by the recent surge in gold prices? Not only has gold repeatedly broken through historical highs, but it has continued to deliver astonishing gains throughout 2026, leaving...2026 年 6 月 15 日


