Complete Analysis of International Gold Price Trends: A Beginner’s Guide to Reading XAU/USD Charts
News reports often mention that “international gold prices have reached new historical highs, repeatedly breaking through key levels in 2026”, but have you ever wondered how the underlying pricing mechanism actually works? To preserve gains and maintain stability in the investment market while keeping track of every market movement, you must first learn how to read XAU/USD technical charts. Whether you want to conduct an in-depth analysis of international gold price trends or add a safe-haven position to your asset allocation, understanding changes in international gold prices is an essential fundamental skill.
This article will take you through the core mechanisms of the global gold market, from the most basic pricing units to the macroeconomic factors that influence gold price movements. It will help you learn not only how to interpret price charts but also how to establish your own analytical framework and practical strategies in the rapidly changing gold investment environment.
What Is the International Gold Price? A Beginner’s Guide to Reading XAU/USD Charts
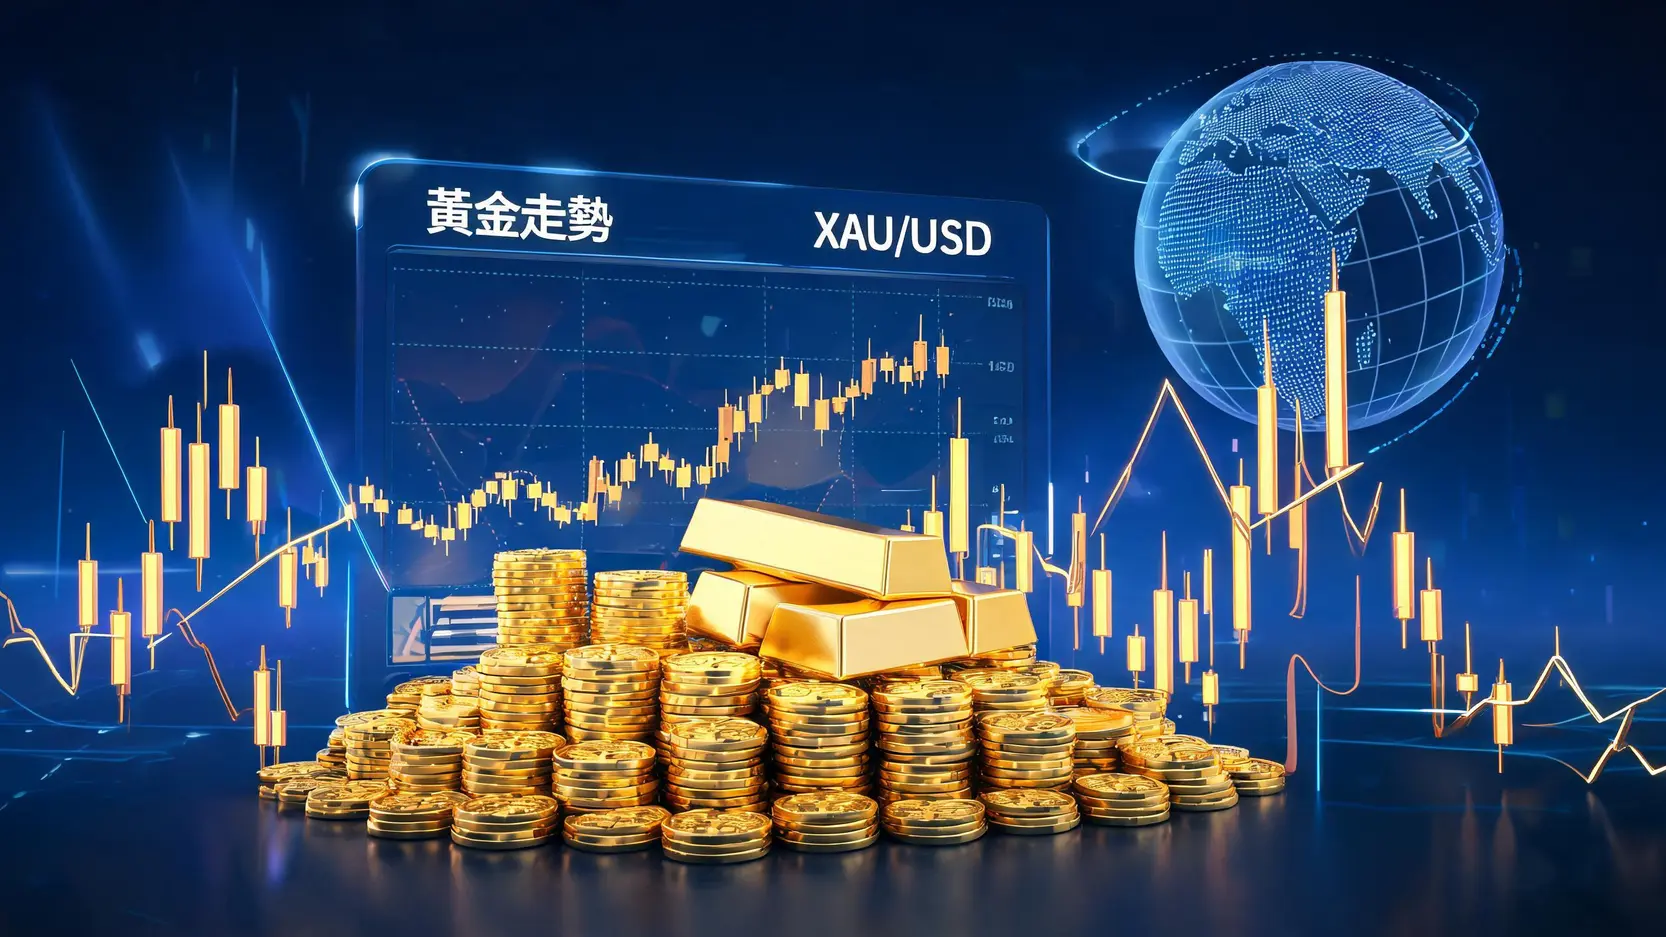
Before conducting an in-depth market analysis, you must first understand the language of gold. In financial markets, the symbol you will see most frequently is “XAU/USD”. This is more than just a code. It represents the global benchmark for gold trading. To understand XAU/USD as a beginner, you must first break down the symbol: XAU is the currency code assigned to gold under the International Organization for Standardization standard (ISO 4217), while USD represents the US dollar. Therefore, XAU/USD means “how many US dollars can be exchanged for one unit of gold”.
International Gold Price Unit: Troy Ounces and US Dollars
The gold units most familiar to readers in Taiwan may be the “Taiwan tael” or “mace”, while gold passbooks purchased through banks are generally priced in “grams”. However, when discussing international gold prices, the standard unit of weight is the “Troy ounce” (abbreviated as oz t). Unlike the avoirdupois ounce used in daily life to measure flour or steak, the Troy ounce is a unit of measurement specifically used for precious metals.
To help you quickly convert units when reading charts, the following practical weight conversion table is provided:
| Unit of Measurement |
Equivalent Weight in Grams
|
Applicable Markets and Scenarios |
| 1 Troy Ounce (oz t) |
Approximately 31.1035 Grams |
International Spot Market (XAU/USD) |
| 1 Taiwan Tael |
37.5 Grams |
Taiwan Jewelry Stores and Physical Gold Jewelry Trading |
| 1 Taiwan Mace |
3.75 Grams |
Taiwan Jewelry Stores (1 Taiwan Tael = 10 Taiwan Maces) |
| 1 Kilogram (kg) |
1,000 Grams |
Large Gold Bars and High-Value Gold Passbook Transactions |
Once you understand the differences between units, the next time you see news that “international gold prices have broken through a certain number of dollars per ounce”, you will immediately be able to visualize their actual value and weight.
London Gold Fixing Price and the New York COMEX Futures Market
International gold quotations are not arbitrarily determined by a single institution. Instead, they are driven by the interaction between two core markets: London and New York. The London market is the world’s largest physical gold trading center and publishes the “LBMA Gold Price” twice daily. This price is established through a bidding process involving several major multinational banks and serves as an important benchmark for large-scale physical gold deliveries by global mining companies, central banks, and major institutions.
On the other hand, the New York Commodity Exchange (COMEX) is the world’s leading gold futures trading center. The futures market reflects investors’ expectations for future gold prices. With extremely high liquidity and intense competition between buyers and sellers, it often acts as the engine driving sharp short-term fluctuations in XAU/USD spot prices. For retail investors, monitoring COMEX gold futures trading volume and open interest is one of the important indicators for assessing market trends.
Further Reading (Highly Recommended)
Complete Analysis of 10 Years of Gold Price Charts: Understanding Investment Strategies Through Historical Prices
Gold ETF Recommendations, Gold Passbooks, and Physical Gold: The Ultimate Comparison and Beginner’s Investment Guide
Four Major Macroeconomic Factors Affecting International Gold Price Trends
After learning how to read quotations, the next question is “why prices rise and fall”. Entering the second half of 2026, the global political and economic environment is increasingly complex. An accurate analysis of international gold price trends requires close attention to the following four major macroeconomic factors. These factors interact with one another and collectively shape long-term gold price trends and short-term fluctuations.
US Dollar Index Strength and US Federal Reserve (Fed) Interest Rate Policy
Gold and the US dollar have an extremely delicate inverse relationship. Since international gold is priced in US dollars, when the dollar strengthens, gold becomes more expensive for holders of other currencies, which often suppresses demand and causes gold prices to fall. Conversely, when the dollar weakens, gold prices usually receive support.
The force behind the strength or weakness of the US dollar is the interest rate policy of the US Federal Reserve (Fed). Looking back over the past few years, the market has moved from a rate hike cycle to monetary policy shifts in 2024 and 2025, followed by the current interest rate environment in 2026. When the Fed cuts interest rates or implements monetary easing policies, liquidity in the market increases and depreciation pressure on the US dollar intensifies. At the same time, as gold does not generate interest (it is a non-interest-bearing asset), the opportunity cost of holding gold falls significantly in a low-interest-rate environment. This is why rate cuts are often regarded as highly favorable for gold.
The Impact of Geopolitics on Gold Prices and Safe-Haven Sentiment
Whenever international instability occurs, whether through regional military conflicts, escalating trade tensions, or sudden public health crises, capital immediately seeks a safe haven. Gold is the oldest and most trusted safe-haven asset in history. The impact of geopolitics on gold prices is often extremely rapid and powerful.
Against the backdrop of 2026, the restructuring of global supply chains and technological and trade competition among major powers continue. Whenever the market’s “fear index” (VIX) surges or highly uncertain geopolitical conflicts frequently dominate news headlines, safe-haven capital flows into the gold market, pushing international gold prices higher in the short term. However, it is important to note that gains triggered by sudden events often emerge and disappear quickly. Without continued support from fundamentals, prices can easily fall back as the impact of the event fades.
Global Inflation and Changes in Real Interest Rates
“Inflation protection” is one of gold’s most widely recognized characteristics. When prices rise rapidly and the purchasing power of fiat currencies declines, physical gold can preserve purchasing power. However, the key factor that truly influences professional fund managers’ gold trading decisions in financial markets is the “real interest rate”.
The simple formula for real interest rates is: Real Interest Rate = Nominal Interest Rate – Inflation Rate. When the inflation rate exceeds the bank interest rate, the real interest rate becomes negative, meaning that keeping money in the bank results in a real loss. In this “negative real interest rate” environment, gold becomes most attractive. Therefore, when analyzing gold price trends, investors should not look only at inflation data, but should also compare the interest rate levels of central banks around the world.
Central Bank Gold Buying and the Physical Supply and Demand Structure
In addition to financial investment demand, the physical supply and demand structure of gold also provides a solid floor for prices. In recent years, one powerful source of support that cannot be ignored has been the “central bank gold buying trend”. To reduce dependence on a single currency (particularly the US dollar), and diversify foreign exchange reserves, central banks in many emerging-market countries (such as China, India, and Poland), have continued to purchase large amounts of physical gold over the past few years. By 2026, this defensive “de-dollarization” gold buying trend remains an important foundation supporting the long-term rise in international gold prices. In addition, industrial applications (such as electronic components) and traditional jewelry demand also experience seasonal fluctuations in line with the global economic recovery cycle.
How to Use International Gold Prices to Predict Domestic Trends? An XAU/USD Gold Spot US Dollar Investment Strategy
Many investors see international gold prices repeatedly reaching new highs and eagerly purchase gold passbooks or physical gold jewelry in Taiwan, only to find that their profits fall short of expectations. This is because domestic gold prices are not exactly equal to international quotations, as exchange rates and weight conversions are also involved. To master an XAU/USD gold spot US dollar investment strategy, investors must first understand this conversion logic.
The Golden Formula for Converting International Gold Prices Into New Taiwan Dollar Gold Prices
To accurately estimate or compare the gold passbook rates quoted by banks in Taiwan, investors can use the following classic conversion formula:
Gold Price per Gram in New Taiwan Dollars = (International Gold Price ÷ 31.1035) × US Dollar to New Taiwan Dollar Exchange Rate
For example, assume that the current international gold price is US$2,500 per ounce and the US dollar to New Taiwan dollar exchange rate is 32.0. Substituting these figures into the formula:
(2,500 ÷ 31.1035) × 32.0 ≈ 80.37 × 32.0 = NT$2,571.8 (per gram).
Using this formula, you can quickly assess whether current domestic bank quotations are reasonable. To check the latest domestic benchmark prices, it is highly recommended to refer to official and authoritative data, such as the Bank of Taiwan Historical Gold Passbook Price Inquiry, for the most accurate buying and selling reference.
How Exchange Rate Fluctuations Can Erase Your Gold Profits: Exchange Rate Hedging Strategies
As shown in the formula above, two variables affect gold prices in New Taiwan dollars: the international gold price and the US dollar exchange rate. In actual trading, an awkward situation often occurs when international gold prices rise sharply while the US dollar depreciates significantly (and the New Taiwan dollar appreciates). In this case, exchange rate losses may offset the profits from rising gold prices, leaving you with no profit even though you correctly anticipated the gold trend.
To address this “double-edged sword”, advanced investors usually adopt exchange rate hedging strategies. If you are highly bullish on gold but expect the New Taiwan dollar to appreciate strongly, you may consider opening a foreign currency account and using US dollars to purchase US dollar-denominated gold ETFs or US dollar gold passbooks. This allows you to earn capital gains purely from rising gold prices without being affected by fluctuations in the New Taiwan dollar exchange rate. This is one of the hidden traps most easily overlooked by beginners when checking international gold prices and developing investment strategies.
Recommended Practical Charting Software and Indicators: XAU/USD Technical Chart Reading Techniques
To do a good job, one must first sharpen one’s tools. Choosing user-friendly software is essential for reading XAU/USD technical charts effectively. The platforms currently most favored by professional traders include TradingView and Investing.com. These platforms not only provide real-time gold quotations but also include a wide range of built-in technical analysis indicators.
For beginners, there is no need to make charts overly complicated at the beginning. Mastering the following three core indicators is sufficient:
- Moving Average (MA): Observe the golden cross or death cross between the 50-day and 200-day moving averages. This can help you determine whether the current medium- to long-term trend is bullish or bearish.
- Relative Strength Index (RSI): When the RSI exceeds 70, the market may be overheated (overbought), creating a risk of a price pullback. When the RSI falls below 30, the market may be oversold, providing a reference for identifying potential buying opportunities.
- MACD Indicator: This is used to assess the strength of trend momentum. When the fast line crosses above the slow line, it is usually regarded as a signal of strengthening momentum.
By combining these technical indicators with the macroeconomic fundamental analysis discussed above, your gold investment decisions will become more logical and convincing.
Recommended Advanced Investment Tools
Gold Allocation Recommendations: Experts Explain 7 Gold Investment Tools to Strengthen Your Asset Safe Haven
Gold Investment Risks Revealed: Four Potential Risks You Should Know Amid Short-Term Volatility
Frequently Asked Questions (FAQ): Exploring the Relationship Between the US Dollar and Gold and Common Beginner Misconceptions
What Is XAU/USD?
XAU is the standard currency code for gold in international financial markets, while USD represents the US dollar. XAU/USD represents the “international spot gold quotation against the US dollar”, meaning how many US dollars one Troy ounce of gold is worth. It is the most important indicator used by investors worldwide to monitor gold price trends.
Why Do Gold Prices Usually Rise When the US Cuts Interest Rates?
This is the core logic behind the relationship between the US dollar and gold. Gold itself is a non-interest-bearing asset (and does not pay dividends or interest). When the US Federal Reserve cuts interest rates, bank deposit rates decline, prompting capital to flow into gold in search of a better store of value. At the same time, rate cuts weaken the US dollar, making US dollar-denominated gold relatively more attractive and driving prices higher.
Is International Gold Traded 24 Hours a Day?
Yes, the international spot gold market is a global market that operates almost continuously 24 hours a day. Trading moves from the Asian sessions in Tokyo and Hong Kong to the European session in London and then to the American session in New York, with capital flowing continuously across different time zones. However, the period with the greatest volatility and highest trading volume usually occurs when the end of the European session overlaps with the opening of the American session (approximately from 8:00 p.m. to 11:00 p.m. Taiwan time).
Is Physical Gold or a Gold ETF Better?
This depends on your investment objective. If you value “safe-haven protection under extreme conditions” and “wealth transfer”, physical gold (such as gold bars and gold coins) is the only option without counterparty risk. However, if your goal is to profit from price differences and you value liquidity, gold ETFs (such as GLD) offer the advantages of low transaction costs and rapid trading, making them more suitable as investment tools for daily asset allocation.
How Much Capital Should Beginners Prepare to Participate in the International Gold Market?
Investing in gold previously required a relatively high capital threshold, but financial technology has now significantly lowered the barrier to entry. You can make small regular fixed investments through a bank gold passbook (such as several thousand New Taiwan dollars per month) or purchase odd lots of gold ETFs through a brokerage. Therefore, even small investors can easily participate in global gold price movements.
Conclusion: Master International Gold Price Inquiries and Investment Strategies to Build a Stable Asset Allocation
In summary, understanding how international gold prices operate and the factors that influence them is essential knowledge for every mature investor. From learning the most basic unit conversions and mastering XAU/USD technical chart reading techniques to gaining a deep understanding of the long-term impact of US dollar exchange rates, inflation, and geopolitics on gold prices, this knowledge will form a solid defensive foundation.
Looking ahead to 2026 and the future global financial market, uncertainty will remain the norm. Staying alert to macroeconomic data, flexibly using various gold investment tools, and implementing exchange rate hedging strategies will help you identify entry and exit opportunities more accurately and allow gold to truly become the most reliable stabilizing asset in your investment portfolio.