Futures Trend Analysis: Candles & Chart Patterns

Futures Trend Analysis: From K-Line to Chart Patterns, 5 Steps to Learn How to Judge Futures Trends
Want to enter the futures market, but every time you open a pricing app, you feel confused looking at the red and green charts? Not sure how to judge future trends, and worried that you might enter the market in the wrong direction and suffer unnecessary losses? We understand these concerns. In fact, successful futures trading is not based on luck alone, but on a systematic futures trend analysis method. This article is designed specifically for beginners like you. It starts from zero and teaches you the most practical futures chart analysis techniques in the most straightforward way, helping you master the core ability to judge market direction, get started easily, and significantly improve your trading win rate. Are you ready to say goodbye to blind trading and start your profitable journey?
Basic Futures Chart Analysis: Why K-Line Is the First Step in Judging Trends
Before learning any complex analytical techniques, we must return to the most fundamental unit, the K-line (Candlestick). The K-line chart, also known as candlesticks, is the foundation of futures chart analysis. It is not just a record of prices, but a reflection of the intense battle between bulls and bears (buyers and sellers) within a specific period. Learning to interpret K-lines is equivalent to learning to understand the language of the market.
K-Line Components: Interpreting Market Sentiment from Open, Close, High, and Low
Each K-line consists of a “body” and “wicks” and records four key price data points:
- Open: The first traded price at the start of the time period.
- Close: The last traded price at the end of the time period.
- High: The highest traded price during the time period, represented by the top of the upper wick.
- Low: The lowest traded price during the time period, represented by the bottom of the lower wick.

K-Line (Candlestick) Basic Structure Diagram
These four price components directly reflect market sentiment:
- Bullish Candle: Usually shown in green or white. When the closing price is higher than the opening price, it indicates strong buying power and a bullish market sentiment.
- Bearish Candle: Usually shown in red or black. When the closing price is lower than the opening price, it indicates stronger selling pressure and a bearish market sentiment.
- Wick Length: A long upper wick means price once rose significantly but was pushed down by selling pressure. A long lower wick means price once fell but was supported by buying interest. The longer the wick, the more intense the battle between bulls and bears.
Basic Candlestick Patterns: Single K-Line Bullish and Bearish Signals
Certain formations of a single K-line can provide strong signals of market reversal or continuation. For beginners, mastering the following basic patterns is essential:
- Hammer: Appears in a downtrend. It has a small body and a long lower wick (usually more than twice the body length), with almost no upper wick. This is a strong bullish reversal signal, suggesting that buyers are starting to enter the market.
- Shooting Star: The opposite of a hammer. It appears in an uptrend, with a small body, a long upper wick, and a very short or no lower wick. This is a bearish reversal warning, indicating that sellers are beginning to take profits and upward momentum is weakening.
- Doji: The opening and closing prices are nearly the same, forming a very small body like a “+” shape. It represents a balance between buyers and sellers, indicating market indecision and potentially signaling that the current trend is about to end.
By observing these single K-line patterns, you can make an initial futures trend analysis of short-term market sentiment. To learn more about candlestick combinations and applications, you can refer to Gold Price Candlestick Chart Technical Analysis for Beginners, which provides more detailed guidance.
How to Judge Future Trends? 3 Essential Chart Analysis Techniques
After learning how to read individual K-lines, the next step is to connect them and conduct a more macro-level futures chart analysis. The following three techniques are the foundation of all technical analysis and core skills for judging future trends.
Technique 1: Drawing Trendlines Quickly Identify Uptrend, Downtrend, and Consolidation
Trendlines are the simplest and most direct tool in technical analysis. They help you instantly identify the main market direction.
- Uptrend Line: In a rising market, connect at least two consecutive lows to form a straight line. As long as price stays above this line, the uptrend remains intact.
- Downtrend Line: In a falling market, connect at least two consecutive highs to form a straight line. As long as price remains below this line, the falling trend continues.
- Sideways Trend (Range): When price fluctuates within a range without forming a clear uptrend or downtrend line, the market is in consolidation. In this case, patience is usually required until a clear direction emerges.
Technique 2: Identify Support and Resistance Levels — Capture Key Buy and Sell Opportunities
Support and resistance are key price levels in futures chart analysis, acting like the floor and ceiling of price movement.
- Support: A price level where buying interest increases as price falls, preventing further decline. It is usually a previous low or a high-volume trading area. When price pulls back to support, it is considered a potential buying opportunity.
- Resistance: A price level where selling pressure increases as price rises, preventing further upward movement. It is usually a previous high or a high-volume trading area. When price approaches resistance, it is considered a potential selling or wait-and-see zone.
Once a support level is broken, it often becomes a new resistance level. Conversely, once a resistance level is broken, it becomes a new support level. This role reversal provides important strategic guidance for traders.

Principle of Support and Resistance Role Reversal
Technique 3: Combine Volume Analysis — Confirm Trend Strength and Reliability
Price movements without volume confirmation may be false signals. Volume represents market participation and capital activity, making it an important indicator for validating trend authenticity.
- Price Up, Volume Up: A healthy uptrend. It indicates strong bullish sentiment and continuous capital inflow, making the trend highly reliable.
- Price Up, Volume Down: A warning sign for an uptrend. It may indicate weak follow-through buying and a potential reversal or consolidation.
- Price Down, Volume Up: Panic selling and confirmed downtrend. It indicates strong bearish sentiment and capital outflow.
- Price Down, Volume Down: A slowing downtrend. It may indicate reduced selling pressure and a possible market bottom or rebound.
A valid breakout (whether breaking a trendline or resistance level) usually requires significant volume expansion for confirmation. For more information on volume, you can refer to the authoritative explanation on Investopedia.
Advanced Futures Trend Analysis: Common Chart Patterns That Indicate Future Direction
Once you are familiar with K-lines, trendlines, and support and resistance, you can begin learning more complex chart patterns. These patterns are formed by multiple K-lines and, after long-term market validation, often indicate possible future price movements.
Reversal Patterns: How Head and Shoulders and Double Bottom Signal an Imminent Trend Reversal?
Reversal patterns usually appear at the end of a long-term trend, indicating that the market is about to change direction.
- Head and Shoulders: A typical bearish reversal pattern. It consists of a higher “head” and two lower “left shoulder” and “right shoulder”. When the price breaks below the “neckline” connecting the lows of the left and right shoulders, the pattern is confirmed and it is a strong sell signal.

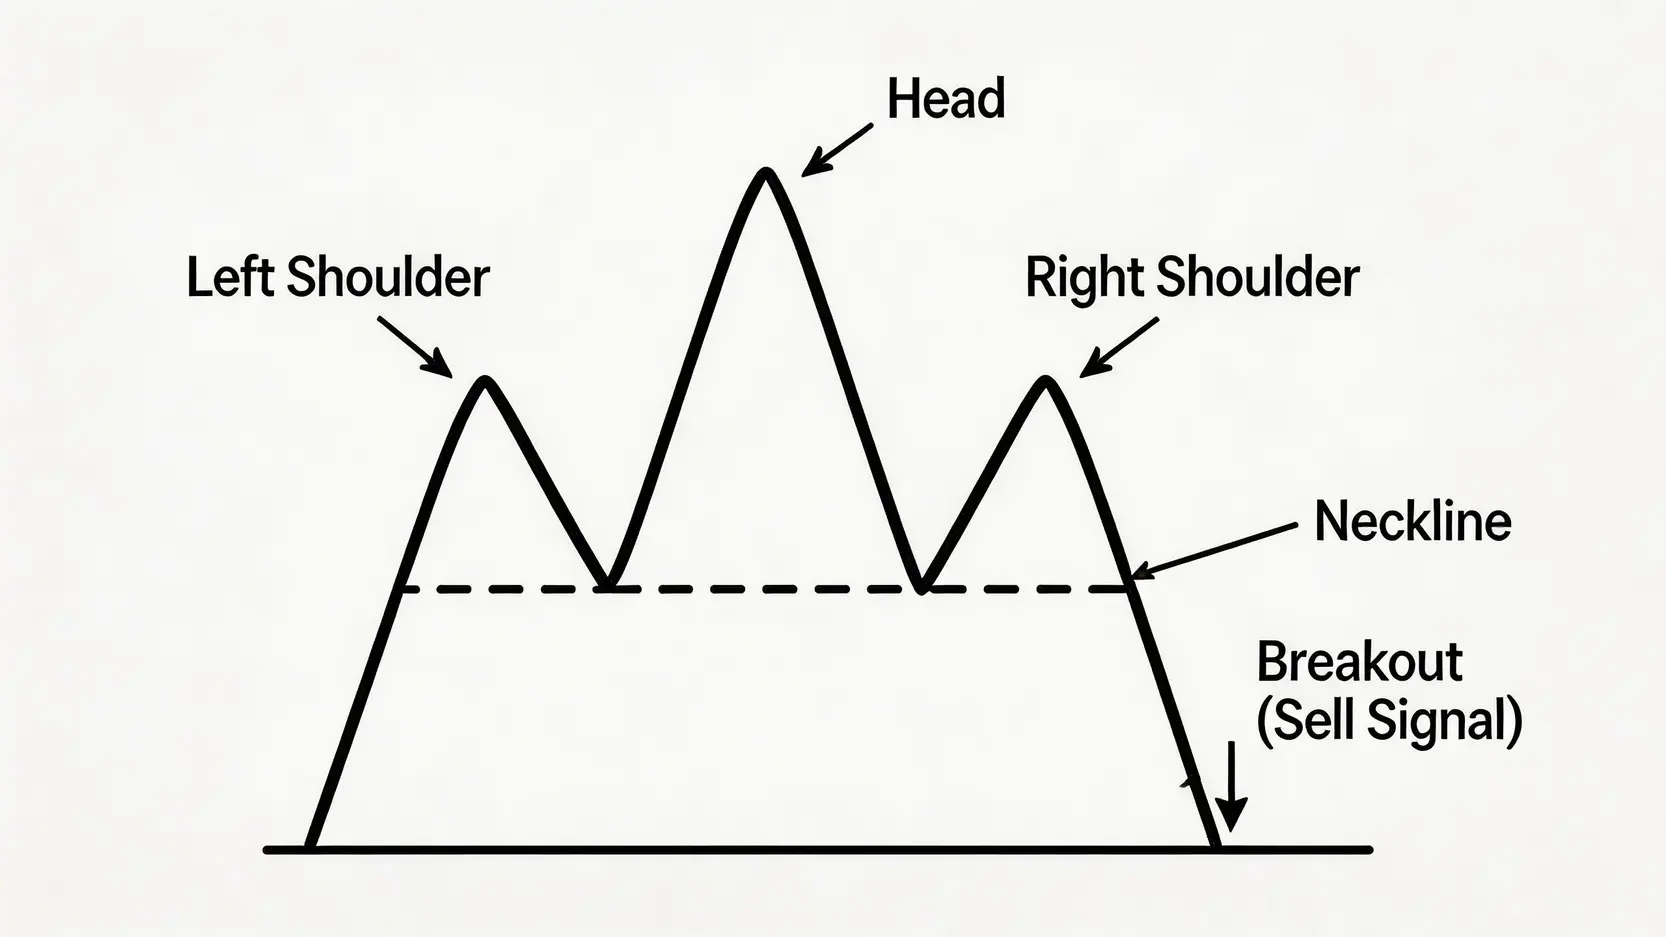
Head and Shoulders (Bearish Reversal Pattern)
- Double Bottom (W Bottom): Also known as a double bottom, it is a bullish reversal pattern. The price falls twice to a similar low level and then rebounds, forming a shape like the letter “W”. When the price breaks above the neckline formed by connecting the two rebound highs, the pattern is confirmed and it represents a potential buying opportunity.
Continuation Patterns: How Ascending and Descending Triangles Signal Trend Continuation?
Continuation patterns indicate that after a brief consolidation phase, the market is highly likely to continue its original trend.
- Ascending Triangle: Appears in an uptrend. The lows of price movements keep rising, forming an upward-sloping support line, while the highs are constrained by a horizontal resistance line. This is usually a sign of accumulating bullish strength. When price breaks above the horizontal resistance with increased volume, it signals that the trend will continue.
- Descending Triangle: The opposite of the ascending triangle, appearing in a downtrend. The highs of price movements keep falling, forming a downward-sloping resistance line, while the lows are supported by a horizontal support line. This indicates that bearish pressure is dominant. Once price breaks below the horizontal support with increased volume, the downtrend is likely to resume.
Further Reading (Highly Recommended)
Conclusion
In summary, learning how to judge futures trends is not based on intuition or simple guessing, but requires a systematic futures chart analysis approach. From interpreting the market sentiment behind individual K-lines, to using trendlines and support and resistance levels to map out the overall direction and key price zones, and then to recognizing chart patterns that signal future movements, this is a step-by-step learning process. The K-lines, trendlines, support and resistance levels, and basic patterns introduced in this article are the foundation of all futures trend analysis. It is hoped that beginners can start practicing from today, validate what they have learned on real charts, apply theory into practice, and gradually build their own trading strategy and market insight.
FAQ: Common Questions About Futures Trend Analysis
Q: What are the most commonly used technical indicators in futures analysis?
A: In addition to the basic tools mentioned in this article, the most commonly used technical indicators include the Moving Average (MA), which is used to determine long-term trends; the Relative Strength Index (RSI), which measures overbought and oversold conditions in the market; and the Moving Average Convergence Divergence (MACD), which is used to identify momentum and turning points in trends. Typically, 2 to 3 different types of indicators are combined for comprehensive analysis to improve accuracy.
Q: What time frame chart should be used for analyzing future trends?
A: The choice of time frame depends entirely on your trading style. Short-term traders or day traders may focus on 1-minute, 5-minute, or 15-minute charts. Swing traders may prefer 1-hour, 4-hour, or daily charts. Long-term investors usually focus on daily, weekly, or even monthly charts. A common strategy is to “combine long and short time frames”, using a higher time frame to determine the overall direction and a lower time frame to find precise entry and exit points.
Q: How can you avoid making wrong judgments in chart analysis?
A: No analysis method is 100% accurate. To reduce incorrect judgments, the key is: first, do not rely on a single signal and always seek confirmation from multiple indicators or patterns. For example, a candlestick reversal signal becomes more reliable when supported by increased volume and RSI divergence. Second, strictly apply risk management and set stop-loss levels as a capital protection baseline. Third, remain objective and avoid letting emotions (such as greed or fear) influence your analysis results.
Q: What is a “false breakout” and how can it be identified?
A: A “false breakout” occurs when the price briefly breaks through a key support or resistance level but fails to sustain it and quickly returns to the previous range, often acting as a market trap. Key ways to identify false breakouts include observing volume during the breakout: a genuine breakout is usually accompanied by significantly increased volume, while a false breakout may show weak or declining volume. In addition, confirmation through the closing price is important. If the candlestick does not close firmly above (or below) the breakout level, the probability of a false breakout is high.
Related Articles
-
Practical Guide After a Gold Plunge: 5 Gold Investment Strategies and Safe-Haven Asset Allocation Fully Revealed Facing the uncertainty of the global economy in 2026, as well as a market environment where gold prices frequently plunge and remain under pressure, blindly following the crowd often only leads to unnecessary losses....2026 年 7 月 3 日
-
Analysis of Gold Under Pressure: How Do Rising Oil Prices and a Stronger US Dollar Put Gold Prices Under Dual Pressure? Recently, “gold under pressure” has become a high-frequency term in financial news. Under the influence of multiple factors such as a stronger US dollar and oil price volatility, gold...2026 年 7 月 3 日
-
Gold V-Shaped Reversal: Master Bottom Reversal Signals From Identification to Trading Strategies in One Article In the gold market, price movements are often unexpected. One of the sharpest and most explosive patterns is the gold V-shaped reversal. After the market experiences a rapid decline, panic spreads, but the price then...2026 年 7 月 2 日


