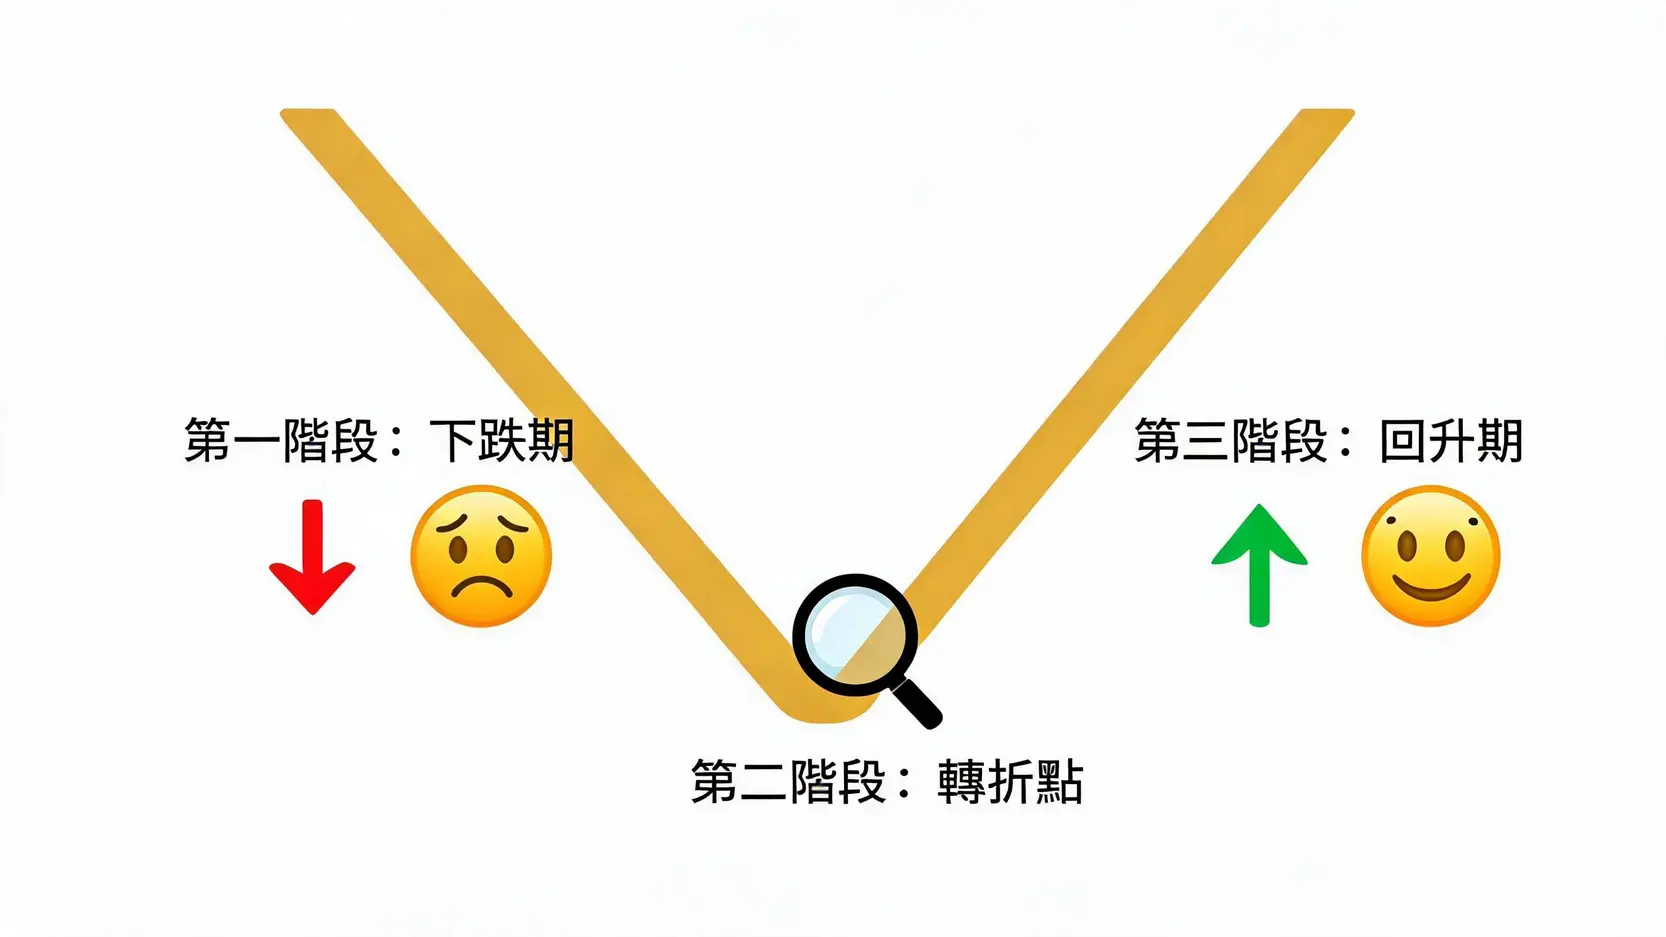
The Three-Part Structure of a Gold V-Shaped Reversal
Stage One: Decline Phase – Rapid and Violent Selling
This stage is characterized by consecutive, steep price declines with almost no meaningful rebound. It is usually triggered by sudden bearish news, a concentrated release of market panic, or heavy institutional selling. On the chart, you will see a series of large bearish candles, with the price quickly breaking below multiple key support levels. At this moment, market sentiment is extremely pessimistic. Retail investors cut losses or sell in panic, and the market is filled with calls to “sell”.
Stage Two: Turning Point – Characteristics and Signals of the Lowest Point
This is the core of the V-shaped reversal and also the most difficult stage to capture. After a severe sell-off, the price suddenly stops falling at a certain level. This lowest point, also known as the V point, is usually very sharp and lasts for an extremely short time. Its typical characteristics include:
- Price suddenly stops falling: Downward momentum comes to an abrupt halt, and bullish and bearish forces briefly reach a balance.
- Candlestick signals: It is often accompanied by candlesticks with long lower shadows, such as a hammer, a doji, or even the early signs of a bullish engulfing pattern.
- A sharp surge in volume: Near the lowest point, trading volume may suddenly expand. This is interpreted as panic selling being fully absorbed by strong buying pressure and is a key signal of “turnover”.
The emergence of this turning point means that bearish forces in the market have been exhausted, while new buying power (usually more forward-looking smart money) begins to enter quietly.
Stage Three: Recovery Phase – A Rally That Quickly Recovers Lost Ground
Once the turning point is established, the price will launch a counterattack with the same rapid momentum. The angle and speed of the rally are almost symmetrical to the decline phase. On the chart, you will see a series of large bullish candles, with the price quickly recovering previous losses. The driving forces behind this stage come from:
- Continued position increases by early buyers.
- Traders who were previously short were forced to cover their positions (known as short covering).
- Traders chasing the rally after seeing the trend reversal.
These three forces converge to form strong upward momentum, driving the price to recover quickly along a V-shaped path.
Four Key Elements for Identifying a V-Shaped Reversal and Improving the Accuracy of V-Shaped Reversal Technical Pattern Identification
To accurately identify a true gold V-shaped reversal among many candlestick combinations, you cannot rely only on the appearance of a “V” shape. You must combine the following four key elements for comprehensive analysis in order to effectively filter out false signals.
Pattern Characteristics: A Sharp Bottom and Symmetrical Rise and Fall
In a standard V-shaped reversal, the bottom is usually sharp, and the price stays at the lowest point for a very short time, sometimes only one or two trading periods. In addition, the left side of the pattern (the decline), and the right side (the rally), should have a certain degree of symmetry in terms of time span and price range. If the decline takes 10 candlesticks, then the rally back to the starting point of the decline should also take around 10 candlesticks. This symmetry reflects the rapid shift in market sentiment from extreme panic to extreme greed.
Candlestick Signals: Bottom Signals Such as Long Lower Shadows and Bullish Engulfing
In the sharp bottom area of the V shape, the candlesticks themselves provide very valuable clues. Pay attention to candlestick pattern signals that indicate a bottom may be forming:
- Hammer/Inverted Hammer: Shows strong buying support below. Even if the price is pushed sharply lower at one point, it is still pulled back by the close.
- Bullish Engulfing: A large bullish candle completely engulfs the previous bearish candle, symbolizing an absolute counterattack by bullish forces.
- Morning Star: A three-candlestick combination consisting of a bearish candle, a doji, and a bullish candle. It is a classic bottom reversal signal.
The appearance of these candlestick signals provides confirmation at the micro level for the formation of a V-shaped bottom.
Volume Analysis: Shrinking Volume During the Decline, Explosive Volume at the Bottom, and Rising Volume During the Rally
Trading volume is a thermometer for measuring market participation and a powerful tool for verifying whether a V-shaped reversal is real or false. In a healthy V-shaped reversal, trading volume usually follows these patterns:
- Decline phase: Trading volume gradually shrinks, indicating that selling momentum is weakening and the market is becoming increasingly reluctant to sell.
- Turning point (or bottom): Trading volume expands sharply, showing that panic selling has been fully exchanged and major funds have begun to build positions on a large scale. This is the most important volume signal!
- Rally phase: Trading volume continues to expand, with both price and volume rising. This indicates active buying, and the upward trend is healthy and sustainable.
If trading volume does not increase during the rally but instead decreases, forming a “rising price with shrinking volume” divergence, then the reliability of this V-shaped reversal should be significantly discounted.
Indicator Assistance: How RSI and MACD Send Bottom Reversal Signals
Technical indicators can help us confirm the possibility of a reversal from another dimension. Common indicators such as RSI (Relative Strength Index) and MACD, (Moving Average Convergence Divergence), often show “divergence” signals during a V-shaped reversal.
- RSI bullish divergence: When the gold price makes a new low, but the RSI indicator does not follow by making a new low and instead forms higher lows, it indicates that downward momentum is weakening and is a potential reversal signal.
- MACD bullish divergence: Similar to RSI, when the price makes a new low, but the lows of the MACD histogram or the fast and slow lines (DIF/DEA) are rising, this also forms bullish divergence, indicating that the trend may reverse.
Combining indicator divergence can greatly increase our confidence in judging V-shaped reversal bottom signals.
Further Reading, Highly Recommended
Futures Trend Analysis: Learn to Judge Futures Trends in 5 Steps, From Candlesticks to Chart Patterns
Differentiated Highlights: Techniques and Case Analysis for Distinguishing Real and False V-Shaped Reversals
The most tempting and most damaging thing in the market is nothing more than a “false” reversal. Learning to distinguish real and false V-shaped reversals is a key step from beginner to experienced trader. According to the definition from the authoritative financial website Investopedia, a V-shaped recovery is characterized by economic activity rebounding rapidly and sustainably after a sharp decline.
Characteristics of False Reversals, Bull Traps, and How to Avoid Them
A “bull trap”, also known as a “dead cat bounce”, refers to a brief rebound in a downtrend, after which the price returns to its decline and may even make a new low. Its characteristics include:
- A rebound without volume: The price rises, but trading volume does not expand effectively, which is a typical price-volume divergence.
- Failure to break through key resistance levels: The rebound is blocked and falls back at the neckline on the left side of the V shape or at an important moving average (such as the 20MA).
- A gentle upward angle: The strength and speed of the rebound are far weaker than the previous decline, making the pattern asymmetrical.
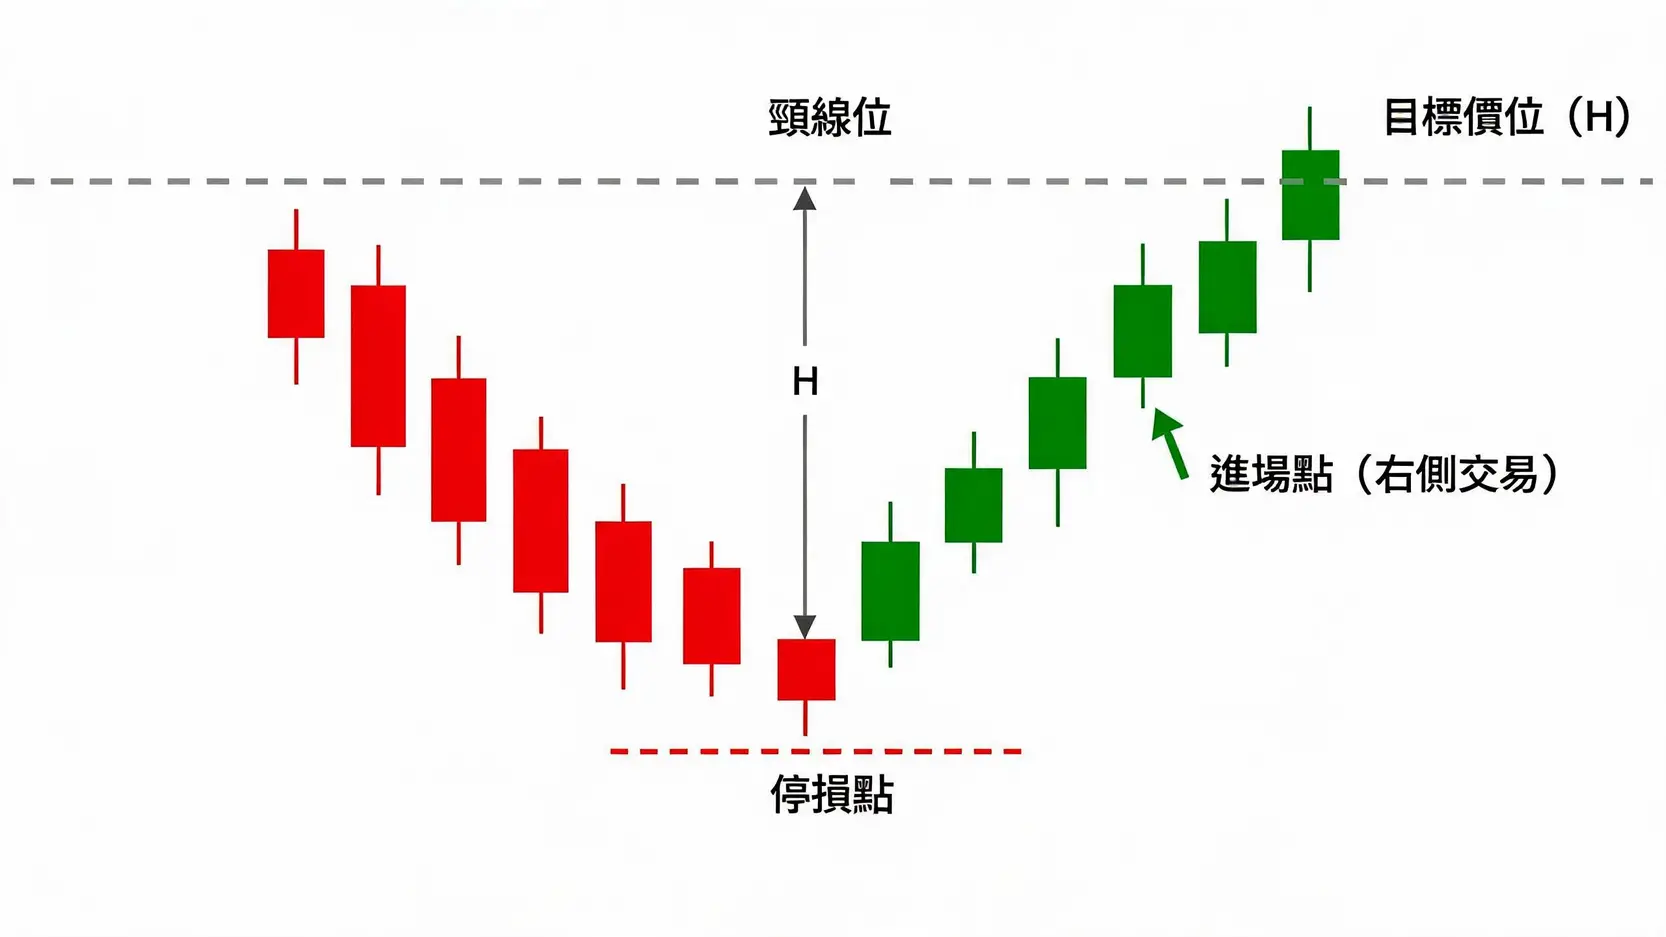
Avoidance method: Stay patient and do not rush to enter in the early stage of a V-shaped bottom formation. Wait for the price to clearly break through the neckline, (meaning the starting point of the decline on the left side of the V shape or the connecting line of rebound highs) with an expansion in trading volume before entering. This is the so-called “right-side trading method”.
Historical Market Review of a Real V-Shaped Reversal (Successful Case)
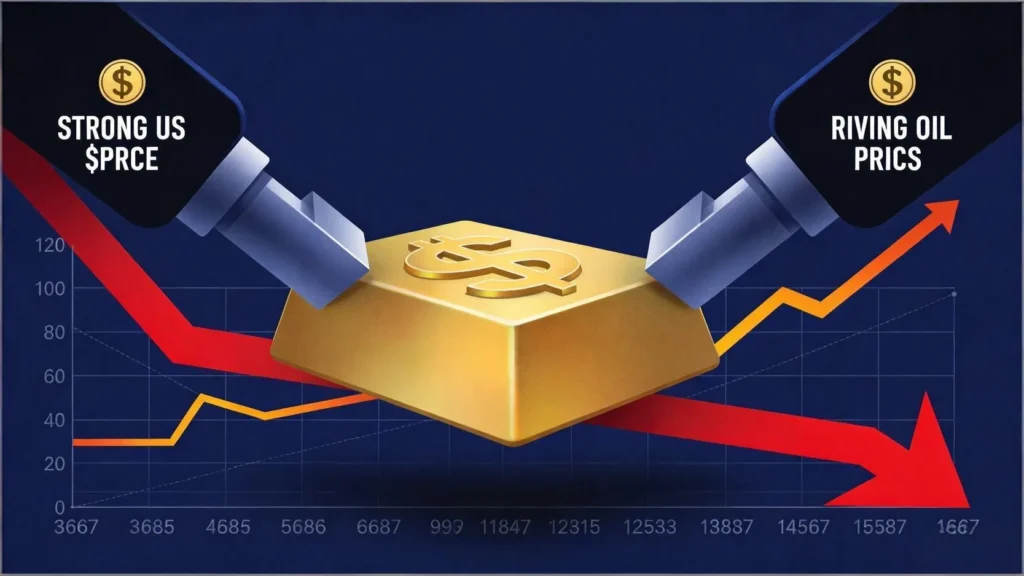
Take the global pandemic outbreak in March 2020 as an example. The gold price fell rapidly from around USD 1,700/oz to near USD 1,450, with a fierce decline. However, after hitting the low, as central banks around the world announced unlimited monetary easing policies, the gold price quickly turned upward. It not only recovered all its previous losses within just a few weeks, but also started a bull market that lasted for several months, eventually setting a new historical high. This is a typical perfect V-shaped reversal jointly driven by macro fundamentals and market sentiment.
How to Distinguish a V-Shaped Reversal From a W Bottom, Double Bottom?
V-shaped reversals and W bottoms are both bottom reversal patterns, but their structures and trading strategies are different.
| Features |
Gold V-Shaped Reversal |
W Bottom (Double Bottom)
|
| Bottom Structure |
Single Sharp Bottom |
Two Bottoms at Similar Price Levels |
| Formation Time |
Shorter, with a rapid reversal |
Longer, requiring time to build the second bottom |
| Market Psychology |
A rapid shift from extreme panic to extreme optimism |
After the market rebounds from the first bottom test, confidence remains insufficient and it tests the bottom again, ultimately confirming that the support is valid. |
| Trading Signal |
Break Through the V-Shaped Neckline |
Break Through the W Bottom Neckline (the Rebound High Between the Two Bottoms) |
In summary, V-shaped reversals are more intense and rare, while W bottoms provide more stable trading opportunities with multiple confirmations.
Practical Trading Strategies for Gold V-Shaped Reversals
The ultimate purpose of identifying patterns is to profit from trading. A complete V-shaped reversal trading strategy should include a clear entry point, stop-loss level, and target price.