Price-Volume Analysis: Divergence & Breakout Guide

Updated: 2026/03/25  |  CashbackIsland

volume-price-divergence-guide

[Volume-Price Analysis Tutorial] Understand “Price-Volume Divergence” in One Article! Master 7 Types of Volume-Price Relationships and Avoid False Breakout Traps

Have you ever chased highs and sold lows, only to get trapped right after buying into a rising stock? In fact, behind every price movement, trading volume hides the most genuine secrets of the market. Many successful investors are able to anticipate trends because they understand how to interpret “price-volume divergence”. This phenomenon, where trading volume and price movement are inconsistent, often serves as a strong signal that the market trend is about to reverse. This volume-price analysis tutorial will guide you step by step to fully understand the meaning of price-volume divergence, with illustrated analysis to help you learn how to use volume-price relationships to improve judgment, avoid seemingly attractive investment traps, and enhance your trading success rate. 


Why Do Professional Investors Focus on Trading Volume? Understanding the Foundation of Volume-Price Relationships

Before diving into complex price-volume divergence, we must return to the basics: why is trading volume so important? Simply put, if price is the market’s “expression”, then trading volume is the market’s “strength”. Looking only at the expression without considering the strength makes it easy to be misled by false movements.


What Is Trading Volume: A True Reflection of Market Momentum

Volume refers to the total number of shares (or contracts) traded by buyers and sellers in the market within a specific time period (such as one day or one hour). It directly reflects the level of market activity and the degree of emotional participation among market participants:

  • High volume: Indicates strong market attention at the current price level, with significant disagreement between buyers and sellers and intense competition. This may signal the beginning or end of a trend and represents momentum.
  • Low volume: Indicates a wait-and-see attitude in the market, with low participation and light trading. This usually occurs during consolidation phases within a trend or when a trend is nearing its end but direction remains unclear.

Trading volume is the most direct reflection of capital flow. Where capital flows, the market moves. Ignoring volume is equivalent to trading with one eye closed.


Healthy Volume-Price Relationships: Rising Price with Increasing Volume and Falling Price with Decreasing Volume

In a healthy market trend, price and trading volume should move in sync. This is the most fundamental principle of volume-price relationships:

  • Rising price with increasing volume: This is the most ideal bullish pattern. As price rises, trading volume expands simultaneously, indicating continuous buying pressure entering the market and strong consensus on the uptrend, making it more sustainable.
  • Falling price with decreasing volume: This represents a relatively “healthy” condition within a downtrend. As price declines, trading volume gradually shrinks, indicating sellers are reluctant to sell and bearish momentum is weakening. Although the trend remains downward, panic sentiment is not severe.

When the relationship between price and trading volume deviates from these two “healthy” patterns, it is time to be cautious, which is precisely where the concept of “price-volume divergence” comes into play.


Core Concept: What Does Price-Volume Divergence Mean?

Price-volume divergence” refers to a situation where the movement of price and the movement of trading volume become “out of sync” or “contradictory”. Price may continue its current trend (such as reaching new highs) while trading volume, the “strength”, fails to keep up or even declines. This is a critical warning signal that the underlying momentum of the current trend is weakening and may soon reverse.

Divergence mainly falls into two types: top divergence and bottom divergence.


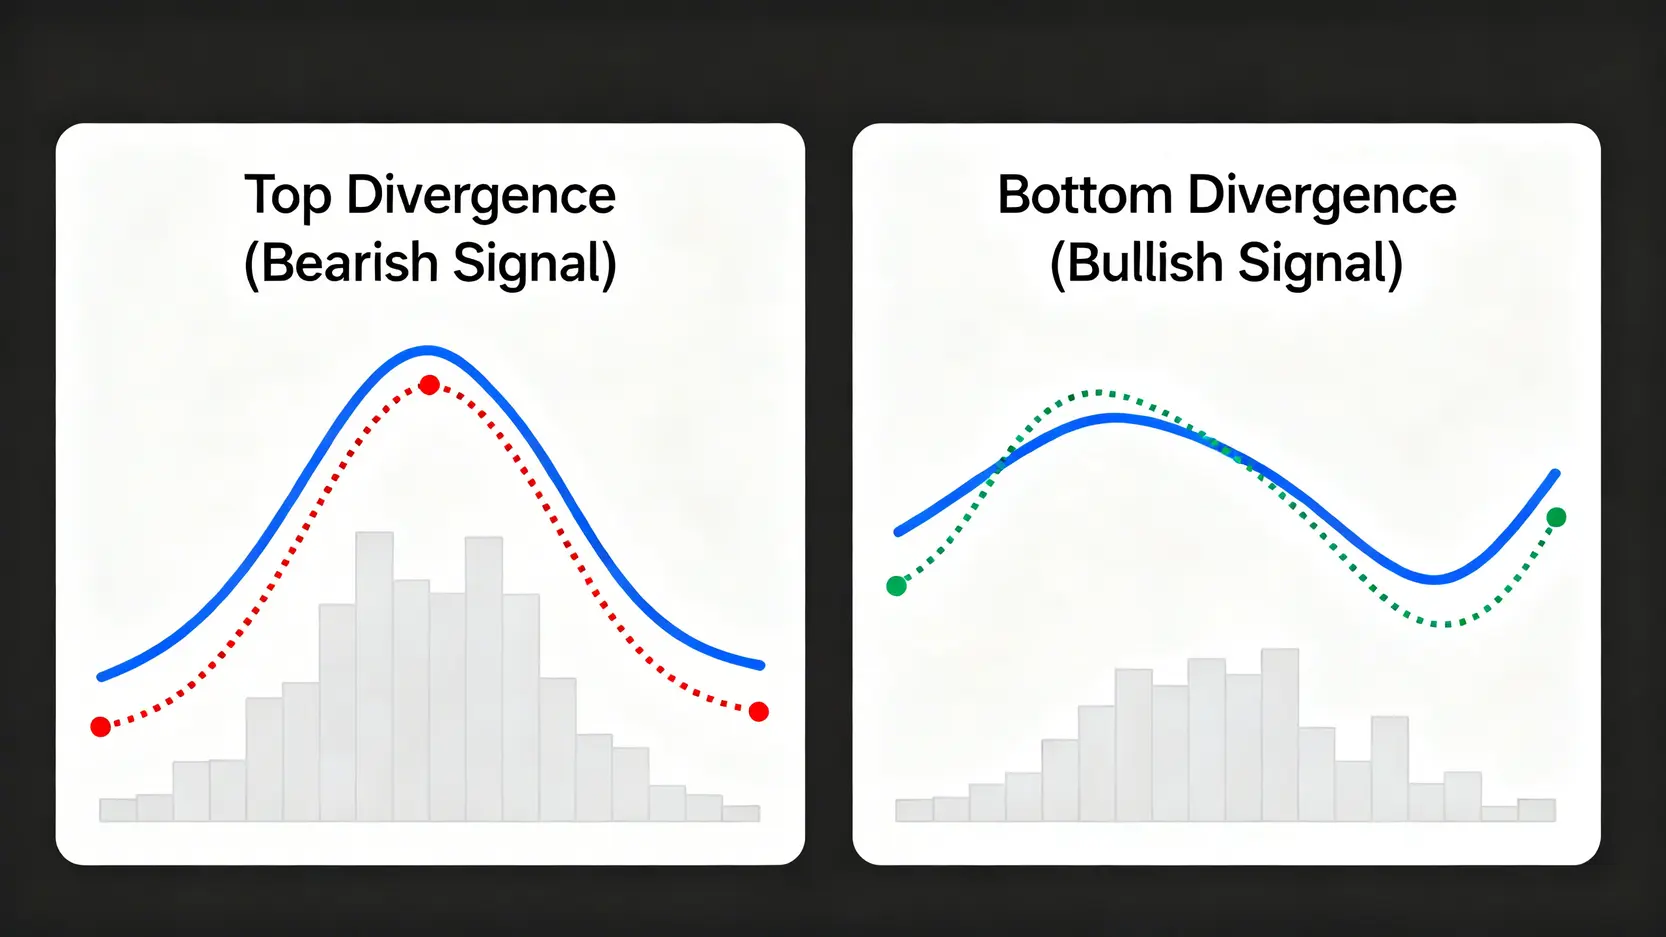
Top Divergence: A Warning Signal When Price Makes New Highs but Volume Declines

Top divergence occurs at the end of an uptrend and serves as a potential sell signal. Its characteristics are:

  • Price movement: The stock price continues to rise and even reaches a new high (Higher High).
  • Volume movement: Trading volume does not follow the price to a new high but instead declines or remains flat, forming a lower peak compared to the previous one (Lower High).

Market interpretation: This divergence of “rising price with decreasing volume” indicates that although prices are being pushed higher, buying strength is significantly weaker than before. This is a dangerous signal that the upward momentum is fading, and major market participants may already be quietly distributing their holdings, leaving retail investors chasing at high levels. Once buying interest fails to sustain, prices may reverse sharply, like a rocket losing fuel. This is also a typical feature of many “false breakouts”. In such situations, investors should consider reducing positions or setting stricter stop-loss levels.


Bottom Divergence: Opportunity When Price Makes New Lows but Volume Increases

Bottom divergence occurs at the end of a downtrend and serves as a potential buy or bottom-fishing signal. Its characteristics are:

  • Price movement: The stock price continues to fall and reaches a new low (Lower Low).
  • Volume movement: Trading volume does not continue shrinking with the falling price but instead starts to expand near the lows, or when price makes a new low, volume does not follow with a new low (Higher Low).

Market interpretation: This divergence of “falling price with increasing volume” or “falling price without decreasing volume” suggests that panic selling pressure is being absorbed by new buying interest. Although prices are still declining, selling momentum is nearing exhaustion, and capital is beginning to accumulate at lower levels. The expansion in volume indicates active position turnover, and the downtrend may soon end, leading to a rebound or reversal. At this stage, experienced investors closely monitor the market to identify suitable entry opportunities.

一張圖解釋頂背馳與底背馳,左側顯示價格創新高但成交量下降的頂背馳,右側顯示價格創新低但成交量上升的底背馳。

Illustration of Price-Volume Divergence: Top divergence (left) is a sell warning, bottom divergence (right) is a buying opportunity.


Further Reading (Highly Recommended)

[CFD Tutorial] The Ultimate Beginner’s Guide to Contracts for Difference: From Account Opening to 5 Practical Investment Strategies

2026 Apple (AAPL) Stock Price Full Analysis: Understand Charts, After-Hours Trading, and Future Investment …


Illustrated Guide to 7 Common Volume-Price Relationship Patterns

After understanding the core concept of divergence, we can expand volume-price relationships into more diverse market scenarios. The following seven classic patterns are essential in technical analysis and understanding them allows you to interpret market behavior more accurately. 

Pattern 1: Rising Price with Increasing Volume (Trend Confirmation)

Characteristics: Price rises while volume bars grow progressively larger.
Meaning: This is the healthiest volume-price relationship, indicating strong buying interest and broad market consensus on the uptrend. The trend is likely to continue, making it suitable for trend-following strategies such as holding long positions or adding to positions.


Pattern 2: Rising Price with Decreasing Volume (Weakening Momentum, Top Divergence Warning)

Characteristics: Price continues to rise, but trading volume starts to shrink.
Meaning: A typical top divergence signal. Buying enthusiasm is insufficient, and the uptrend is sustained mainly by inertia, making a reversal likely. Caution is advised, and investors should consider taking profits in stages and avoid chasing highs.


Pattern 3: Falling Price with Increasing Volume (Panic Selling or Bottom Formation, Possible Bottom Divergence)

Characteristics: Price declines while trading volume expands sharply.
Meaning: This depends on the context. If it occurs at low levels after a prolonged downtrend, it may signal panic selling with institutional accumulation, representing a “volume expansion bottom formation”, a form of bottom divergence. However, if it occurs at the early stage of a decline or at high levels, it may indicate panic selling and a further intensification of the downtrend.

Pattern 4: Falling Price with Decreasing Volume (Continuation of Downtrend or Easing Selling Pressure)

Characteristics: Price continues to decline while trading volume also decreases.
Meaning: Selling pressure is gradually easing, but buying interest remains weak. This usually indicates that the downtrend continues, although the pace of decline may slow. Without clear signs of stabilization (such as a high-volume bullish candlestick), entering the market prematurely is not advisable.


Pattern 5: High-Level Price Consolidation with Increasing Volume (Distribution by Major Players)

Characteristics: Price consolidates at high levels without significant upward movement, but trading volume frequently spikes.
Meaning: This often indicates that major players are using consolidation to create buying interest while quietly distributing their holdings to retail investors chasing prices. This “high-level turnover” is usually a precursor to a market top, and if buying interest cannot sustain, a sharp decline may follow.

Pattern 6: Low-Level Price Consolidation with Increasing Volume (Accumulation by Major Players)

Characteristics: After a prolonged downtrend, price moves sideways at low levels with limited fluctuation, while trading volume increases intermittently.
Meaning: In contrast to high-level distribution, this may indicate that major players are quietly accumulating remaining floating shares in the market. Once sufficient accumulation is achieved, an upward trend may begin. This is a potential bottom signal worth monitoring patiently.

主力出貨與吸籌的對比圖。左側高檔出貨圖顯示主力在高價區將籌碼賣給散戶;右側低檔吸籌圖顯示主力在低價區向散戶收購籌碼。

Major Player Operation Patterns: High-Level Price Consolidation with Increasing Volume (Distribution) vs. Low-Level Price Consolidation with Increasing Volume (Accumulation)


Pattern 7: Flat Price with Decreasing Volume (Market Waiting, Preparing for Breakout)

Characteristics: Price fluctuates within a narrow range while trading volume shrinks significantly.
Meaning: Both buyers and sellers are in a stalemate, with minimal trading interest as the market waits for a clear direction. After volume contracts to an extreme, a breakout or breakdown with increased volume often follows. Patience is key until direction is confirmed.


Practical Application of Price-Volume Divergence: 3 Steps to Improve Trading Success Rate

No matter how much theory you learn, it ultimately needs to be applied in practice. Simply placing trades upon spotting divergence can easily result in being “shaken out” by short-term market fluctuations. The following three steps can help you apply volume-price analysis more systematically and improve the accuracy of your decisions. 

Step One: Determine the Current Stock Price Trend (High or Low Level)

This is the most critical step. The same price-volume divergence signal carries completely different meanings depending on where it occurs. Before applying it, ask yourself:

  • Is the current price at a relatively high level after a prolonged uptrend, or at a relatively low level after a prolonged downtrend?
  • A top divergence appearing at high levels has a much higher probability of reversing downward than one appearing during a consolidation phase within an uptrend.
  • A bottom divergence appearing at low levels has a much higher chance of reversing upward than one appearing during a temporary rebound within a downtrend.

Learning how to determine the macro position of a stock trend is a prerequisite for successfully applying price-volume divergence. 

Step Two: Identify Divergence Signals Between Price and Trading Volume

Open your charting software and compare the price chart with the trading volume chart below. Carefully observe whether the peaks and troughs of price move in sync with the peaks of trading volume.

  • To identify top divergence: connect the two most recent price highs, then connect the corresponding two volume highs. If the price line slopes upward while the volume line slopes downward, this forms a standard top divergence structure.
  • To identify bottom divergence: connect the two most recent price lows, then connect the corresponding volume bars. If the price line slopes downward while the volume line (or its troughs) is flat or sloping upward, this forms a potential bottom divergence structure.


Step Three: Cross-Verify With Other Technical Indicators (Such as MACD, RSI)

Price-volume divergence is a strong warning signal, but it is not foolproof. To filter out false signals, it is essential to combine it with other technical indicators you are familiar with for cross-verification. This is also a key difference between professional and amateur trading. Research from the authoritative financial information website Emerald also supports the importance of multi-dimensional analysis.

  • Combining with MACD: when price reaches a new high but the MACD indicator’s DIF value and histogram do not, this forms “indicator divergence”. If “price-volume divergence” also appears at the same time, the reliability of a trend reversal increases significantly. For a deeper understanding, refer to this MACD indicator tutorial.
  • Combining with RSI: RSI (Relative Strength Index) can also be used to observe divergence. When price reaches a new high while RSI declines, it indicates insufficient upward momentum.

When multiple signals such as price-volume divergence and indicator divergence point in the same direction, your confidence and trading success rate in making decisions will increase significantly.


Further Reading (Highly Recommended)

MACD Indicator Tutorial: Understand Fast and Slow Lines, Histogram, Golden Cross, and Divergence in One Article!

[CFD Tutorial] The Ultimate Beginner’s Guide to Contracts for Difference: From Account Opening to 5 Practical Investment Strategies


Frequently Asked Questions (FAQ) About Price-Volume Divergence

Q: Does price-volume divergence always lead to a stock price reversal?

A: Not necessarily. Price-volume divergence is a strong “warning signal”, not a 100% “guarantee of reversal”. It indicates that the internal strength of the current trend is weakening and the “probability” of reversal is increasing. However, the market may sometimes digest the divergence through sideways consolidation before continuing the original trend, which is known as “passivation”. Therefore, the best strategy is to treat divergence as a risk alert, combine it with other indicators and stop-loss strategies, rather than blindly trading against the trend.

Q: Which time frame should be used when analyzing volume-price relationships?

A: This depends on your trading style. Generally, the longer the time frame (such as daily or weekly charts), the more reliable the price-volume divergence signals and the more significant the potential trend reversal. Short-term traders may observe 15-minute or 60-minute charts, but divergence signals on shorter time frames may only lead to temporary pullbacks or rebounds rather than major trend changes. For most investors, it is recommended to start analysis with daily charts.

Q: How can I avoid being misled by “false divergence” signals?

A: The best way to avoid being misled is through “multiple verification”. First, ensure the divergence occurs at key price levels (such as long-term support or resistance). Second, as mentioned above, check whether other technical indicators (such as MACD or RSI) also show divergence. Finally, patiently wait for confirmation from price action, for example, after a top divergence, the appearance of a high-volume bearish candlestick breaking below a key neckline is more reliable than selling based on divergence alone.

Q: What do the colors of volume bars represent?

A: The color of the volume bars usually follows the color of the day’s candlestick. If the closing price is higher than the opening price (a bullish candlestick), the volume bar is shown in red; conversely, if the closing price is lower than the opening price (a bearish candlestick, black or green), the volume bar appears in black or green. This helps us quickly determine whether buying or selling pressure dominates on high-volume days. For example, a high-volume bearish candlestick appearing at elevated price levels is a very dangerous sell signal.


Conclusion

In summary, mastering “volume-price divergence” is an essential step for every investor moving from beginner to advanced. Volume is a key clue that reveals the market’s true intentions, while price-volume divergence serves as an important warning signal of trend reversals, helping you identify risks in advance or capture opportunities. Remember, in financial markets, no single indicator is foolproof. Only by combining the concepts from this volume-price analysis guide with trend assessment, candlestick patterns, and other technical indicators can you evaluate market conditions more comprehensively and ultimately make smarter, higher-probability investment decisions.

If you liked this article, please share it!

Related Articles

  • How to Buy Bitcoin in 2026: A Beginner’s Guide
    How to Get Started with Bitcoin? The Complete 2026 Bitcoin Buying Guide for Beginners After watching Bitcoin repeatedly reach new highs in recent years and successfully pass spot ETF reviews in the US and Hong Kong in 2024, officially entering mainstream financial markets, many investors have turned their attention to...
    2026 年 7 月 20 日
  • Gold V-Shaped Rebound: Bottom Signal or Bull Trap?
    Is Gold’s V-Shaped Rebound a Bottom-Fishing Signal? A Complete Guide to Trading Strategies Amid “$100 Price Swings” What Is a Gold V-Shaped Rebound? More Than Just a Technical Pattern The gold market has recently experienced sharp rises and falls, with prices frequently displaying dramatic “gold V-shaped rebounds”. Single-day “$100 price...
    2026 年 7 月 20 日
  • 2026 PPI Guide: PPI vs CPI and Stock Market Impact
    What Is PPI Data? 2026 Latest Analysis: Understand the Differences from CPI and How It Affects Stock Market Trends With market information constantly changing, do you always hold your breath while waiting for CPI data to be released? But did you know that a more forward-looking inflation indicator, PPI data...
    2026 年 7 月 20 日
返回顶部