RSI Indicator Guide 2026: Divergence & Key Strategies

Updated: 2026/03/25  |  CashbackIsland

rsi-indicator-guide-2026

RSI Indicator Guide 2026: From Beginner to Master, Learn RSI Divergence, Parameter Settings, and 5 Key Applications in One Article

Among the many technical analysis tools, the RSI indicator (Relative Strength Index) is a key instrument for measuring market momentum and predicting trend reversals. Many investors have a basic understanding of the meaning of the RSI indicator, but do not fully understand its practical applications, especially the highly profitable “RSI divergence” signals, and are often unsure how to “set RSI parameters to match their trading style. This article provides a complete RSI usage guide, from core definitions to advanced practical strategies, allowing you to fully master this powerful indicator and optimize your trading decisions. Whether you are a short-term trader or a long-term investor, you will find the answers here. 


What Is the RSI Indicator (Relative Strength Index)?

RSI, short for “Relative Strength Index” , was developed in 1978 by technical analysis pioneer J. Welles Wilder, Jr. It is a momentum oscillator used to measure the speed and magnitude of recent price movements, thereby evaluating whether stocks, forex, or other assets are in an “overbought” or “oversold” condition. The RSI value ranges from 0 to 100 and is displayed as a line beneath the price chart.


The Core Meaning of the RSI Indicator: Measuring the Relative Strength of Buyers and Sellers

The core concept of the RSI indicator is straightforward: it calculates the relative strength between the average gains on up days and the average losses on down days over a specific period. In simple terms:

  • When upward forces in the market are much stronger than downward forces, the RSI value rises toward 100.
  • When downward forces in the market are much stronger than upward forces, the RSI value falls toward 0.

Therefore, RSI acts like a thermometer of market sentiment, allowing us to quantify the balance of power between buyers and sellers. Its popularity lies in its ability to provide deeper insights into market momentum beyond simply observing price candlesticks. For more about the original definition of RSI, you may refer to the authoritative financial website, Investopedia


How to Interpret RSI Values? Identifying “Overbought” and “Oversold” Conditions

The most basic way to interpret RSI values is to observe whether it has entered the “overbought” or “oversold” zones. This is one of the fundamental RSI usage methods:

  • Overbought: When the RSI value is above 70, it usually indicates that the asset has risen too quickly in a short period and the market may be overheated, with buying momentum gradually weakening and the risk of a potential decline or correction increasing. This serves as a warning signal to remain cautious when chasing prices.
  • Oversold: When the RSI value is below 30, it usually indicates that the asset has fallen too much in a short period and the market may be overly pessimistic, with selling pressure nearing exhaustion and the potential for a rebound or recovery increasing. This serves as a potential signal to observe buying opportunities.
  • Neutral: When RSI fluctuates between 30 and 70, it indicates a relatively balanced market or a lack of a clear trend.

RSI 指標的超買與超賣區間示意圖,顯示 0 至 30 為超賣區,30 至 70 為中立區,70 至 100 為超買區。

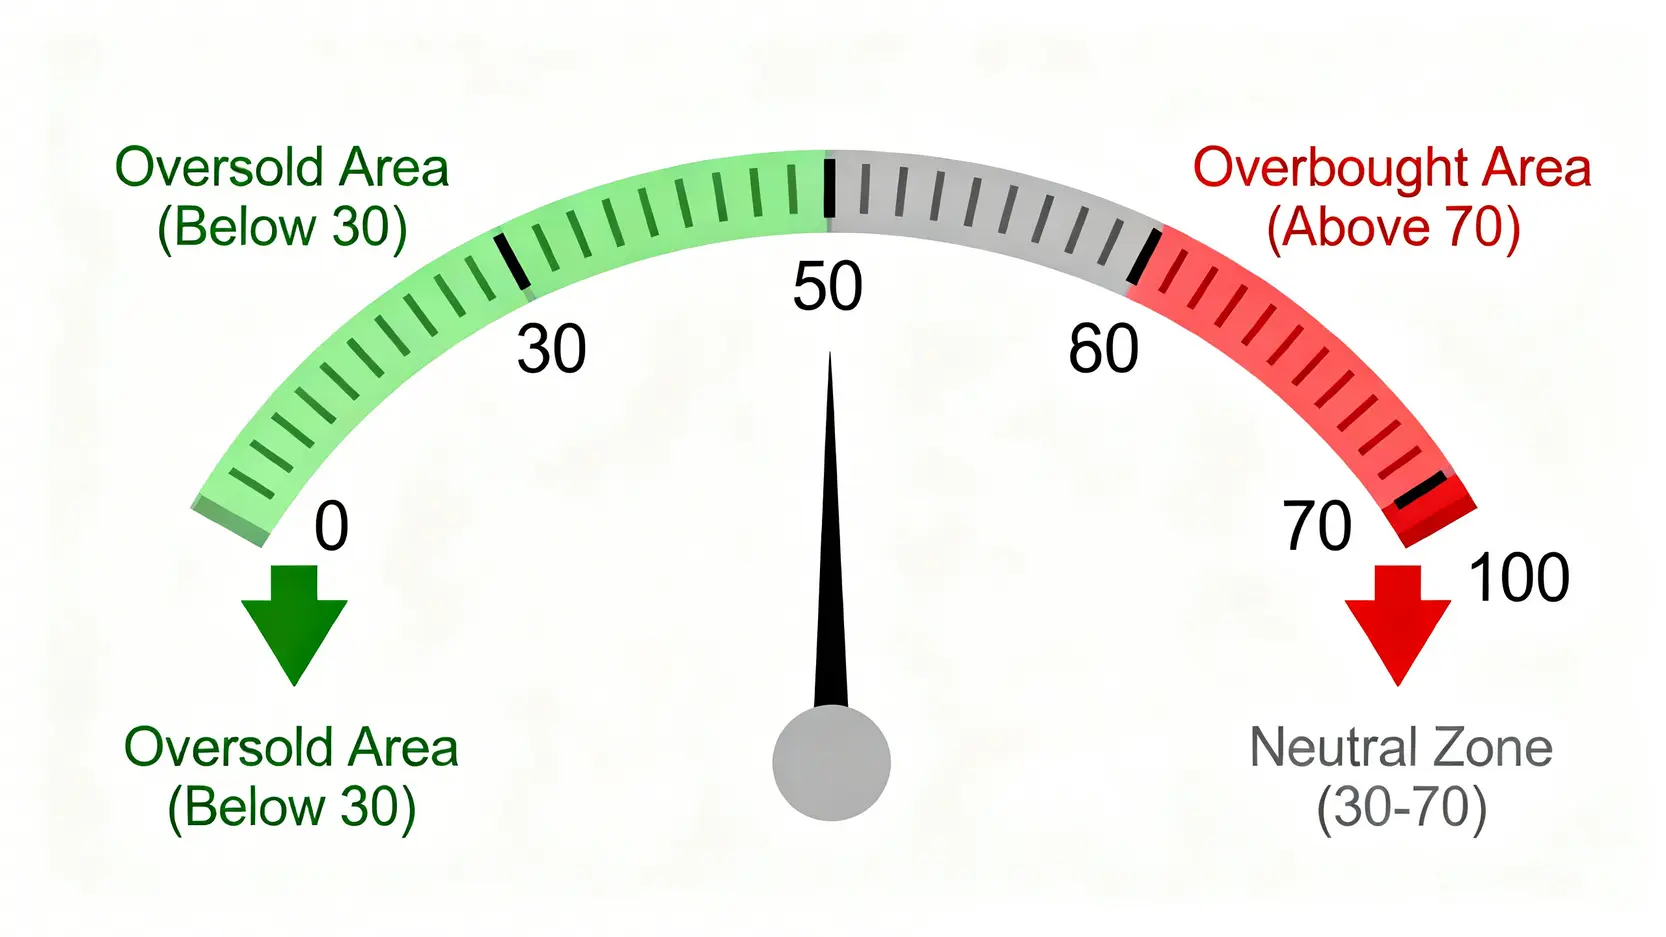
The Three RSI Zones: Below 30 Indicates Oversold, Above 70 Indicates Overbought.

It is important to note that 70 and 30 are not absolute rules. In strong bull markets, RSI may remain above 70 for an extended period (known as “stagnation”), while in bear markets it may remain below 30. Therefore, relying solely on overbought and oversold signals requires combining with other analysis tools to improve accuracy.


A Complete Analysis of RSI Parameter Settings: What Should Beginners Use?

Correct RSI parameter settings are key to maximizing its effectiveness. Different parameter settings directly affect the sensitivity of the RSI indicator, allowing it to adapt to different trading cycles and strategies.


Why Is the Default Parameter 14? Optimal RSI Settings for Short-Term and Long-Term Trading

In most charting software, the default RSI parameter is “14”. This number originates from Wilder’s recommendation, as he believed that 14 days (approximately half a month), effectively reflects medium-term market momentum without being too sensitive or too slow.

However, the optimal parameter is not fixed and should be adjusted based on your trading style:

  • Short-term traders (Day Trading or Scalping): May consider lowering the parameter, such as 6, 7, or 9. A shorter period allows RSI to react faster to price changes and capture overbought and oversold signals earlier, but it also generates more false signals.
  • Long term traders (Swing / Position Trading): Holding positions for several days to weeks or longer, may increase the parameter to 21 or 30. A longer period smooths price fluctuations and filters out short-term noise, helping focus on the main trend. Signals are fewer but generally more reliable.

Professional tip: There is no “best” parameter, only “the one most suitable for your strategy”. It is recommended to conduct backtesting to find the most suitable setting for your target market and timeframe.


How to Properly Set the RSI Indicator in Charting Software?

Setting the RSI indicator in TradingView MetaTrader 4 or 5 (MT4/MT5) or major brokerage platforms is straightforward. The general steps are as follows:

  1. Open your chart and locate the “Indicators” or “Insert” menu.
  2. Search for “RSI” or “Relative Strength Index” in the indicator list.
  3. After adding it, the indicator will appear below the main chart. A settings window will usually pop up, or you can click the “settings” icon next to the indicator.
  4. In the “Inputs” or “Parameters” tab, find the “Length” or “Period” field and adjust it to your desired value (such as 6, 14, or 21).
  5. In the “Style” tab, you can customize the RSI line color, thickness, and the values and appearance of the overbought and oversold levels (typically 70 and 30).

(This is where the illustration would show the RSI parameter settings interface in charting software)


Further Reading (Highly Recommended)

CFD Guide: The Ultimate Beginner’s Guide to Contracts for Difference, From Account Opening to 5 Practical Investment Strategies

MACD Indicator Guide: Understand Fast and Slow Lines, Histogram, Golden Cross, and Divergence in One Article


Advanced RSI Usage Guide: 5 Core Trading Strategies

After mastering the basic definitions and settings, the next step is to apply advanced RSI usage strategies to improve your trading success rate. The following introduces five core practical strategies.


Strategy One: Using Overbought (> 70) and Oversold (<30) to Identify Reversal Opportunities

This is the most basic counter-trend trading strategy. When RSI enters the overbought zone (above 70), it indicates the market may be overheated, suggesting it may be time to consider reducing positions or looking for sell signals. Conversely, when RSI enters the oversold zone (below 30), it indicates the market may be overly pessimistic, suggesting a potential buying opportunity. Remember not to act immediately when RSI enters these zones. It is better to wait for confirmation signals (such as reversal candlestick patterns) or RSI turning away from extreme levels.


Strategy Two: Identifying Buy and Sell Signals Through Golden Cross and Death Cross

This strategy introduces a second RSI line, typically combining short-term and long-term RSI, (such as RSI 7 and RSI 14).

  • Golden Cross: When the short-term RSI crosses above the long-term RSI, it indicates strengthening short-term momentum and is considered a positive buy signal.
  • Death Cross: When the short-term RSI crosses below the long-term RSI, it indicates weakening short-term momentum and is considered a warning sell signal.


Strategy Three: Using the RSI Midline 50 as the Bull-Bear Boundary

The RSI midline, 50, can be viewed as the “dividing line” between bullish and bearish forces.

  • When RSI breaks above 50 and remains above it, it indicates a bullish market dominated by buyers, favorable for buying in line with the trend.
  • When RSI falls below 50 and remains below it, it indicates a bearish market dominated by sellers, suggesting avoiding long positions or considering short positions.


Strategy Four: Combining RSI With Trendline Breakouts

You can draw trendlines on the RSI chart. When RSI breaks its own trendline, it often signals that price may soon break its corresponding trendline. For example, during an uptrend, if price has not yet broken support but RSI has already broken its upward trendline, it may signal a potential weakening trend.


Strategy Five: Identifying Hidden Divergence (as a Signal of Trend Continuation)

Unlike regular divergence that predicts reversals, hidden divergence is used to confirm “trend continuation”.

  • Hidden Bullish Divergence: In an uptrend, price forms a higher low while RSI forms a lower low, indicating strong underlying buying momentum and a potential continuation of the trend.
  • Hidden Bearish Divergence: In a downtrend, price forms a lower high while RSI forms a higher high, indicating persistent selling pressure and a potential continuation of the trend.


Mastering RSI Divergence: The Ultimate Signal for Predicting Trend Reversals

“RSI divergence” is the most advanced and valuable application of the RSI indicator and is widely used by professional traders. Divergence occurs when price movement and RSI movement are “out of sync”, often signaling a potential trend reversal.


What Is “Bearish Divergence” and How to Identify Sell Signals?

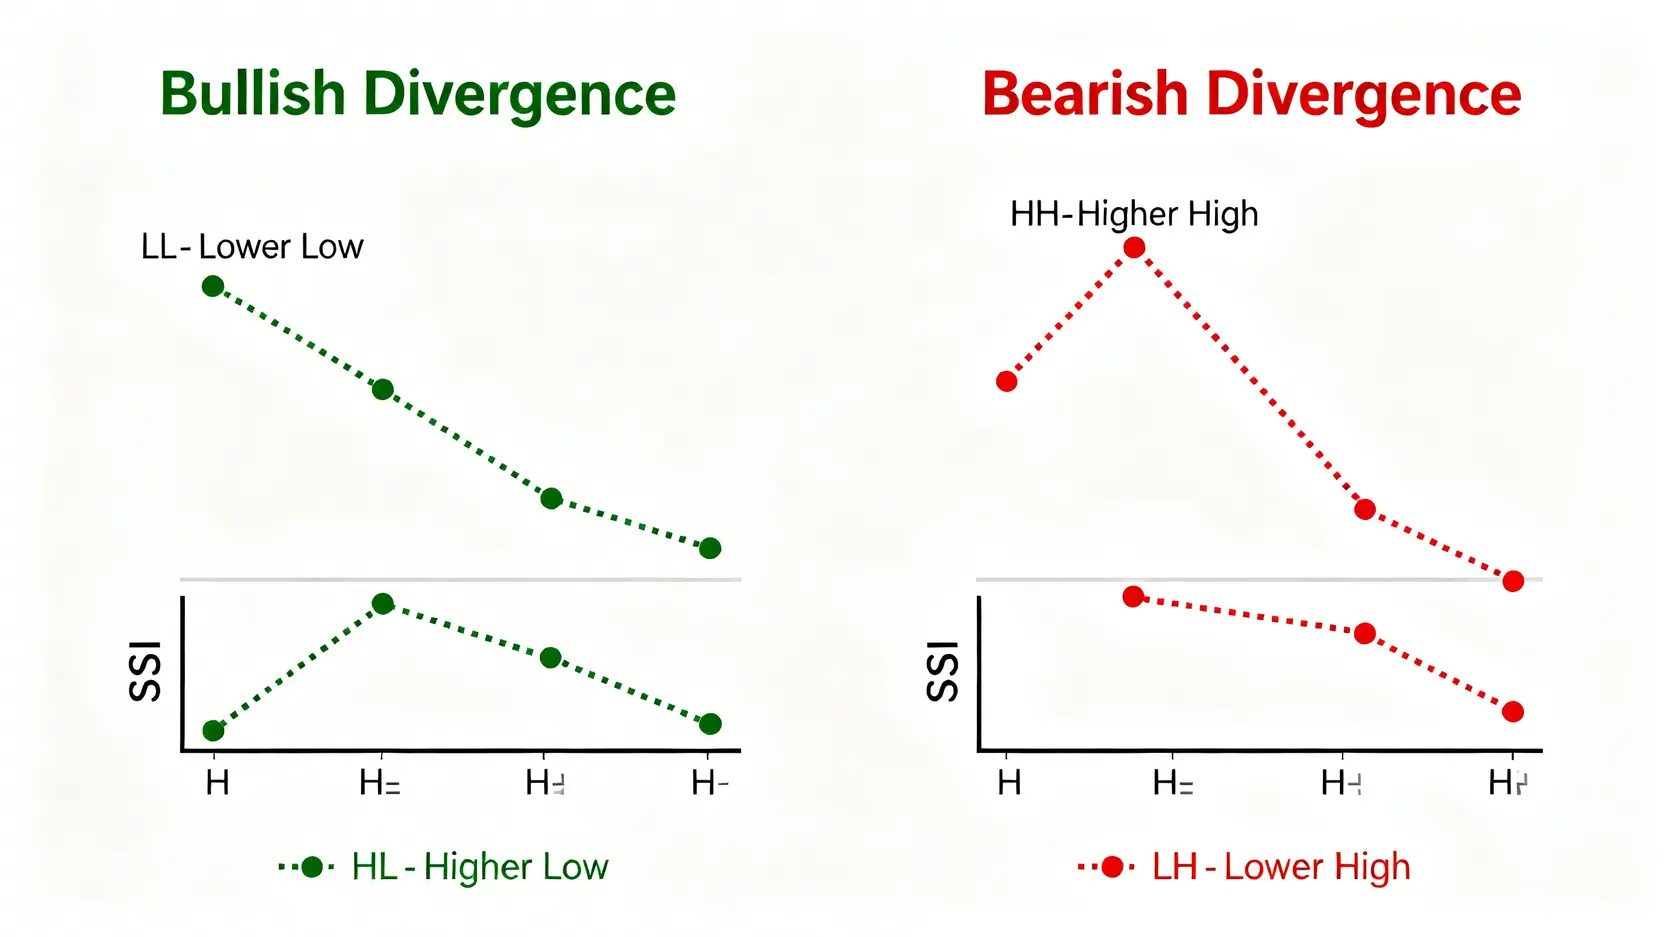
Bearish divergence usually appears at the end of an uptrend and is a strong sell or warning signal. Its characteristics are:

  • Price trend: Forms a higher high (HH) compared to the previous peak.
  • RSI trend: Fails to form a new high and instead forms a lower high (LH).

This phenomenon of “price making new highs while the indicator does not” means that although the price continues to reach new highs, the underlying momentum driving the rise has begun to weaken. It’s like a sports car still speeding forward, but its engine is losing power and could stall at any moment. When a bearish divergence appears, traders should remain highly alert, consider gradually closing long positions, or prepare to look for shorting opportunities.


What Is “Bullish Divergence” and How to Identify Buy Opportunities?

Bullish divergence usually appears at the end of a downtrend and provides an excellent opportunity to identify bottom reversals. Its characteristics are:

  • Price trend: Forms a lower low (LL) compared to the previous trough.
  • RSI trend: Fails to form a new low and instead forms a higher low (HL).

This phenomenon of “price making new lows while the indicator does not” suggests that although the price continues to fall, the selling pressure is weakening and buying strength is quietly accumulating. It’s like a ball bouncing on the ground, each bounce may be lower, but internal pressure is building, ready to spring back strongly. A bullish divergence is a golden signal for identifying potential buying opportunities.


RSI Divergence Practical Illustration and Key Considerations

(This is where the illustration would show actual candlestick charts and RSI comparisons for bearish and bullish divergence)

RSI 頂背馳與底背馳的對比圖,圖示說明價格與指標走勢相反時如何形成看漲或看跌的背馳信號。

RSI Divergence Is a Key Signal for Predicting Market Reversals: Bearish and Bullish Divergence.

Considerations when using divergence:

  1. Divergence does not mean an immediate reversal: It is a “warning” signal, and price may continue in the same direction for some time before reversing.
  2. It requires confirmation from other signals: The best practice is to combine divergences with other basic technical analysis tools such as price breaking key trendlines, reversal candlestick patterns, or volume analysis.
  3. Divergence signals are more reliable on higher timeframes: Such as daily or weekly charts, compared to shorter timeframes like 5-minute or 15-minute charts.


Further Reading (Highly Recommended)

CFD Guide: The Ultimate Beginner’s Guide to Contracts for Difference, From Account Opening to 5 Practical Investment Strategies

MACD Indicator Guide: Understand Fast and Slow Lines, Histogram, Golden Cross, and Divergence in One Article!


Frequently Asked Questions (FAQ) About the RSI Indicator

Q: What is the difference between the RSI indicator and the KD indicator? How should they be used together?

A: RSI (Relative Strength Index) and KD (Stochastic Oscillator) are both oscillators, but they are based on different calculations. RSI measures the relative strength between “gains” and “losses” over a period, reflecting momentum; KD measures the position of the current closing price within a recent price range, reflecting overbought and oversold conditions. Generally, KD is more sensitive but generates more noise, while RSI is smoother. They can be used together: for example, when both enter the oversold zone and RSI shows a bullish divergence, the buy signal becomes stronger.

Q: What does it mean when the RSI indicator becomes “passivated”? How should it be handled?

A: Passivation refers to a situation in a strong trending market (extreme bull or bear market) where RSI remains in the overbought zone (>70) or oversold zone (<30) for an extended period and loses its effectiveness. In such cases, relying solely on overbought or oversold signals for counter-trend trading is risky. To handle this: 1) temporarily ignore RSI’s overbought/oversold function and instead use trend indicators such as trendlines or moving averages; 2) look for “hidden divergence” signals, as they confirm trend continuation and are more suitable in passivated conditions.

Q: Is RSI divergence always accurate? What limitations should be considered?

A: No technical indicator is 100% accurate, and RSI divergence is no exception. Its limitations include: 1) the possibility of multiple consecutive divergences, where price briefly pulls back and then continues in the original direction; 2) in very strong trends, divergence signals may appear too early, leading to significant losses for counter-trend traders; 3) in sideways markets, divergence signals are less meaningful. Therefore, RSI divergence should be treated as a “warning signal” that requires confirmation, not a direct “execution signal”.

Q: Is the RSI indicator applicable to all markets, such as cryptocurrencies or forex?

A: Yes. RSI is based on price momentum, so it can be applied to stocks, indices, forex, futures, precious metals, and cryptocurrencies. However, due to differences in market volatility, parameter adjustments may be necessary (such as time periods and overbought/oversold threshold lines). For example, in highly volatile markets like cryptocurrencies, some traders adjust the overbought/oversold levels to 80/20 to filter out more noise.


Conclusion

In summary, the RSI indicator not only shows the market’s temperature (overbought/oversold levels), but its use in detecting “RSI divergences” is also a powerful tool for anticipating potential reversals. Learning to adjust “RSI parameters settings” flexibly according to different market conditions and trading styles is key to maximizing the indicator’s effectiveness. This “RSI Usage Guide” covers five strategies from basic to advanced, designed to help you trade more confidently. Open your trading platform now and start practicing with the RSI indicator, letting data and logic optimize every trading decision!

If you liked this article, please share it!

Related Articles

  • Volatility Surface Guide: Skew Trading Strategies
    Practical Applications of Volatility Surfaces: From Options Modeling to Advanced Skew Trading Strategies In options markets, implied volatility is never a flat line. Instead, it forms complex "smile" or "skew" surfaces. For advanced traders, mastering the practical applications of volatility surfaces is equivalent to possessing a lens that reveals market...
    2026 年 6 月 3 日
  • Foreign Capital Flow Model: Track Institutional Money
    Building a Foreign Capital Flow Copy Trading Model: A Stock Market Indicator for Accurately Tracking Institutional Positioning In Asia-Pacific stock markets, foreign capital inflows and outflows often determine the direction of the index. However, simply looking at daily net buy and sell data is no longer enough. Only by building...
    2026 年 6 月 3 日
  • Options Buying Strategies for Extreme Market Risks
    Options Buyer Strategies During Extreme Market Conditions: Black Swan Hedging and Cross-Market Arbitrage During Volatility Surges The most terrifying aspect of financial markets is not a gradual decline, but overnight flash crashes and cross-market capital withdrawals accompanied by volatility surges. In the highly unpredictable global macroeconomic environment of 2026, geopolitical...
    2026 年 6 月 3 日
返回顶部