MACD Divergence Guide: Top, Bottom & Trading Strategy

Ultimate Guide to Applying MACD Divergence: From Top and Bottom Divergence Definitions to Practical Strategies
Do you often watch stock charts but miss the best entry and exit points? When the market price hits a new high, have you ever wondered why technical indicators don’t move upward accordingly? This is likely a signal of “MACD divergence”. This discrepancy between price and indicator trends is a powerful tool many experienced traders use to identify potential market turning points. This article will clearly explain the core concepts of MACD divergence, show you how to use MACD bearish divergence for risk assessment, and apply MACD bullish divergence to capture potential entry opportunities, allowing you to position early and become a smarter investor.
What Is MACD Divergence? Why Is It an Important Leading Indicator?
Before diving into MACD divergence, let’s quickly revisit the MACD indicator itself. It is an essential part of technical analysis, and understanding its composition is fundamental to mastering divergence.
Quick Review of the MACD Indicator: The Relationship Between DIF, MACD, and the Histogram
The MACD (Moving Average Convergence Divergence) indicator consists of three core components:
- DIF Line (Fast Line): Calculated by subtracting the long-term EMA (typically 26 days) from the short-term EMA (typically 12 days), it reflects short-term market momentum and reacts quickly
- MACD Line (Slow Line, or Signal Line): This is the EMA of the DIF line (typically 9 days), mainly used to smooth DIF fluctuations and help identify trend continuation
- Histogram: The difference between the DIF line and MACD line (DIF – MACD). The histogram’s height represents the gap between the fast and slow lines, indicating market momentum strength. When above zero, it signals bullish momentum; below zero, bearish momentum
Together, these three form a powerful trend and momentum indicator, with divergence emerging as an advanced signal based on their interaction with price action
Core Definition of Divergence: When Price and Indicator Trends Diverge
“Divergence” occurs when the asset’s price direction and the MACD indicator trend show a clear “discrepancy” or “contradiction”. Normally, when the price reaches a new high, the momentum indicator should also hit a new high, and vice versa. When this synchronization is broken, divergence forms.
You can think of it like an athlete running uphill:
- Normal Situation: The higher he climbs (price new high), the faster his heartbeat and speed (indicator new high).
- Divergence Situation: He reaches a new height (price new high), but his heartbeat and speed slow down (indicator fails to reach new high). This is a warning signal that his stamina (market momentum) may be exhausted, and he may stop or retreat (price reversal) at any time.

Therefore, MACD divergence is considered a leading indicator, signaling weakening trend momentum and a potential market pullback or reversal
MACD Bearish Divergence: Warning of a Downtrend
MACD bearish divergence is a sell or position-reduction signal traders must pay close attention to. It usually appears at the end of an uptrend, indicating that upward momentum is waning and bearish forces may soon take control.
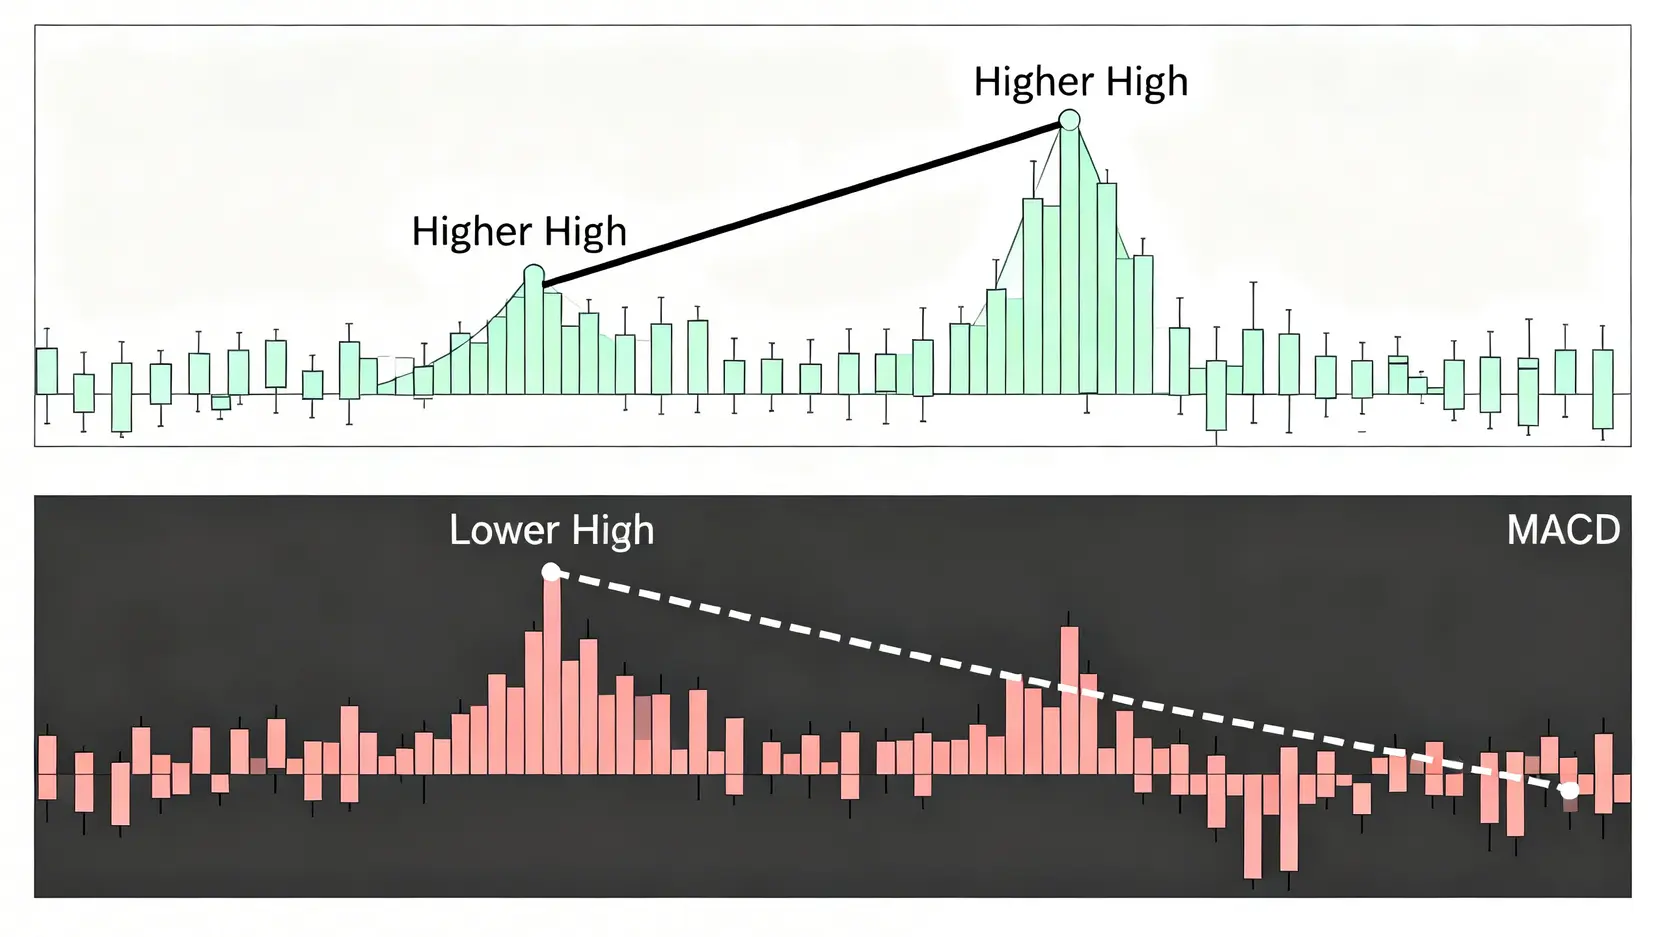
How to Identify Bearish Divergence: Price Hits New High While Indicator Falls (With Illustrated Example)
The criteria for MACD bearish divergence are straightforward, focusing on two consecutive highs:
- Price Trend: On the price chart, the second high is higher than the first, forming a “Higher High”.
- MACD Trend: Observe the MACD indicator below (typically the DIF line or histogram). The second high is lower than the first, forming a “Lower High”.
When “price new high” and “indicator lower high” occur simultaneously, a standard MACD bearish divergence structure forms. This means that although prices are still rising, the internal buying power driving the uptrend has weakened.

Practical Application of MACD Bearish Divergence: When to Reduce Positions or Sell?
Upon spotting a MACD bearish divergence signal, do not panic sell immediately. Experienced traders treat it as a strong warning and combine other analysis to plan actions:
- Scale Down Positions: For existing long positions, consider selling part of the holdings to lock in profits after divergence appears.
- Tighten Stop Loss: Move stop loss to just below recent key support levels to protect gains and prevent losses from sudden reversals.
- Seek Short Opportunities: Aggressive traders can use bearish divergence as an early signal to look for short positions, but typically wait for right-side confirmation, such as price breaking key support or uptrend line, before entering.
Remember, the core of applying MACD bearish divergence is risk management, it alerts you that market direction may be changing.
Further Reading (Strongly Recommended)
MACD Bullish Divergence: Capturing Rebound Opportunities
Conversely, MACD bullish divergence signals a potential market bottom and rebound. It often appears at the end of a downtrend, indicating that selling pressure is nearly exhausted and bullish forces are preparing to counterattack, providing an important reference for identifying optimal entry points
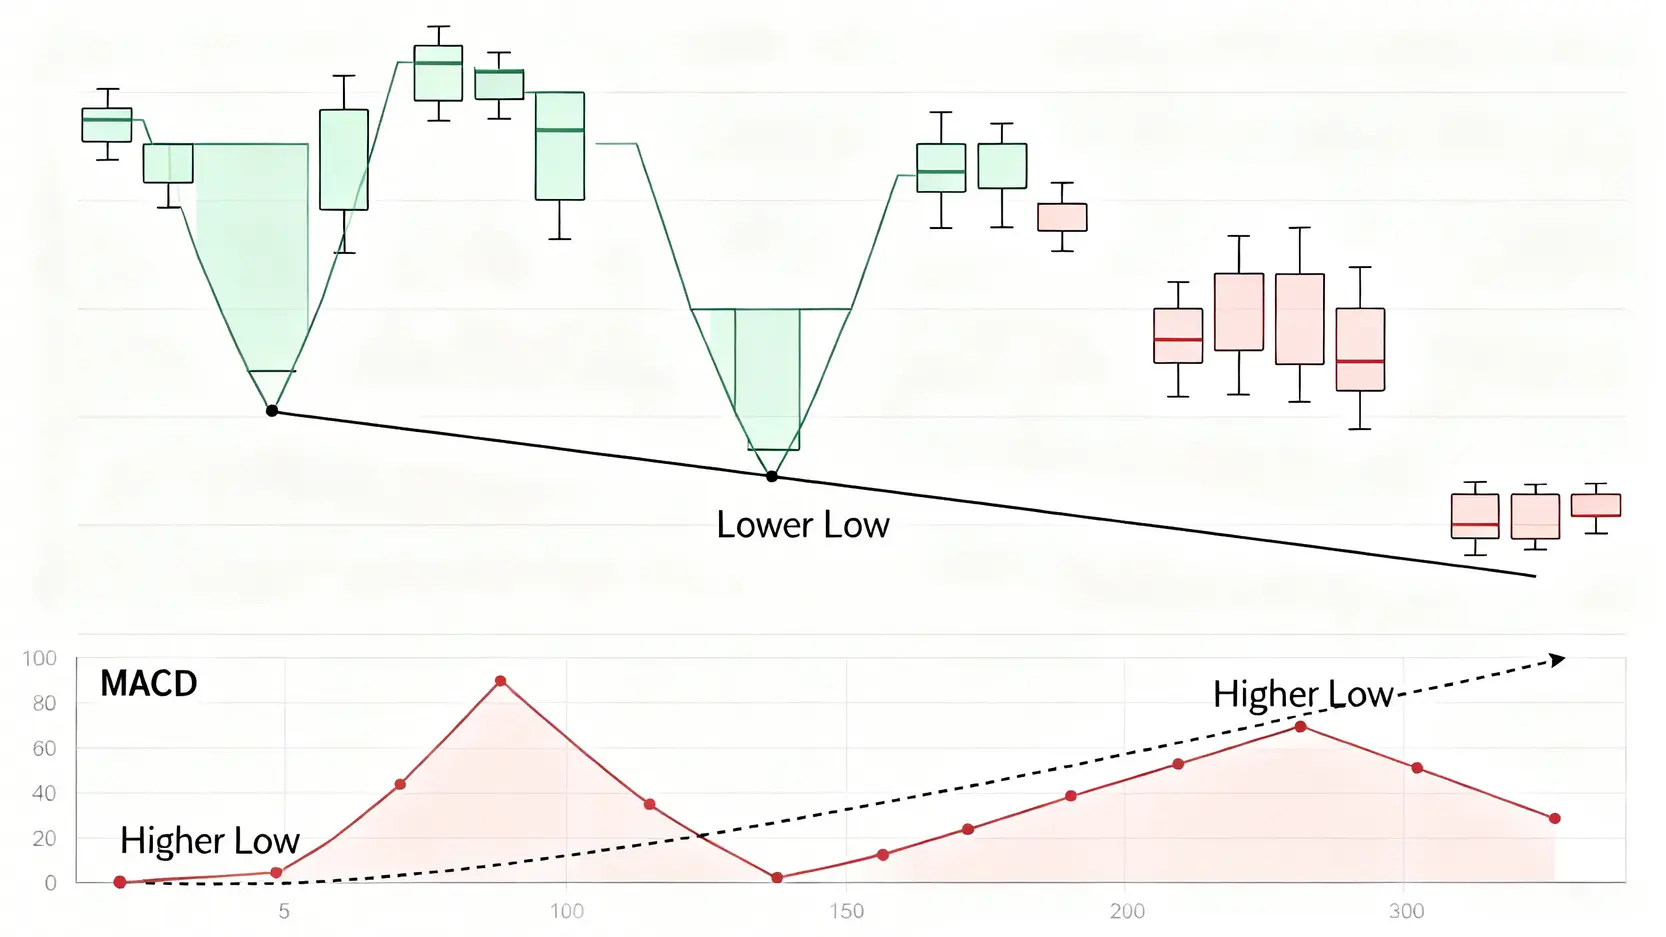
How to Identify Bullish Divergence: Price Hits New Low While Indicator Rises (With Illustrated Example)
The method mirrors bearish divergence, but in reverse:
- Price Trend: On the price chart, the second low is lower than the first, forming a “Lower Low”
- MACD Trend: The MACD indicator’s second low is higher than the first, forming a “Higher Low”
When “price new low” coincides with “indicator rising”, a strong MACD bullish divergence pattern is established. This indicates that although prices continue to fall, market panic may have peaked, selling momentum is weakening, and the likelihood of a trend reversal increases.

Practical Application of MACD Bullish Divergence: How to Identify Potential Golden Entry Points?
MACD bullish divergence provides a potential entry signal, but wise traders do not buy full positions immediately. A stepwise approach is recommended:
- Establish a Watch Position: When bullish divergence first appears, enter a small position to test the waters.
- Wait for Right-Side Confirmation: A more conservative approach is to wait for confirmation, such as price breaking short-term downtrend lines, forming bullish candlestick patterns (e.g., morning star, hammer), or DIF line crossing above MACD line (golden cross) before adding to the position.
- Set Stop Loss: Always set clear stop-loss levels below prior lows to protect against failure of the divergence signal and further price declines.
Learning to strategize entries using MACD bullish divergence can significantly improve trading success.
Common Mistakes and Precautions in Applying MACD Divergence
While powerful, MACD divergence is not foolproof. Many beginners lose money due to misuse. Here are common pitfalls and professional tips for improving accuracy.
Mistake 1: Ignoring Market Trend and Misusing Divergence in Sideways Markets
MACD divergence works best at the end of clear trending markets (up or down). In sideways, low-volatility “consolidation markets”, MACD fluctuates near zero, generating frequent and invalid divergence signals. Searching for divergence here leads to repeated losses.
Mistake 2: Relying Solely on Divergence Without Other Technical Confirmations
No technical indicator is perfect; MACD divergence is no exception. Sometimes the market shows “divergence after divergence”, where price briefly retraces after the first divergence, then continues to new highs/lows, forming second or third divergence. Entering heavy positions on the first divergence alone is highly risky. Professional practice seeks multiple confirmations, as noted on authoritative finance sites like Investopedia.
Professional Tip: Combine Volume and Trendline Analysis to Enhance MACD Divergence Accuracy
To master MACD divergence, learn “resonance” analysis, looking for multiple indicators or signals pointing in the same direction. Two highly effective combinations are:
- Volume Analysis:
- In bearish divergence, if price hits a new high while volume shrinks (volume-price divergence), the reliability of a top reversal increases.
- In bullish divergence, if price hits a new low while volume shrinks (selling exhausted) or volume rises on subsequent rebounds, the likelihood of a confirmed bottom is higher.
- Trendline Analysis:
- After a bearish divergence, wait for price to break below the uptrend line for a strong sell confirmation.
- After a bullish divergence, wait for price to break above the downtrend line for a relatively safe buying opportunity.
Frequently Asked Questions (FAQ)
Q: Are MACD divergence signals always accurate? Do they appear frequently?
A: No technical indicator is 100% accurate. MACD divergence is a high-probability “probabilistic” tool, not a “certainty” tool. It can significantly improve your success rate in identifying market turning points, but false signals may still occur. Its frequency depends on market volatility and the time frame you use. In highly volatile markets or short time frames (e.g., 15-minute charts), divergences appear more often but include more noise; in longer time frames (e.g., daily or weekly charts), signals are fewer, but once they appear, their reliability is usually higher.
Q: Should the MACD parameters (12, 26, 9) be modified?
A: For most traders, using the default parameters (12, 26, 9) is optimal. These settings have been tested over long periods and are widely accepted. Arbitrary adjustments may lead to “over-optimization”, where the parameters perform perfectly on historical data but fail in live trading. Beginners and intermediate traders are advised to focus on understanding and applying divergence signals with the standard parameters rather than chasing “magic numbers”.
Q: Will price immediately reverse after a bearish or bullish divergence appears?
A: Not necessarily. Divergence signals momentum exhaustion, but the transition from exhaustion to full reversal takes time. Sometimes the market experiences “divergence neutralization”, where the indicator lingers at high or low levels while price continues to make minor new highs or lows. This is why it’s recommended not to enter full positions at the first sign of divergence but to wait for price action confirmation (such as breaking trendlines or key levels) to filter out most neutralized moves and improve entry precision
Q: Is MACD divergence effective across different time frames?
A: Yes, the principle of MACD divergence applies to all time frames, from 1-minute to monthly charts. The key is understanding that “the larger the time frame, the more significant the signal”. A daily bullish divergence may indicate a rebound or the start of a multi-week or multi-month uptrend, while a 5-minute bullish divergence may only lead to a short rebound lasting minutes or hours. Therefore, interpret divergence signals within the context of their respective time frames, short-term traders can focus on intraday charts, while long-term investors should prioritize daily and weekly signals
Conclusion
In summary, MACD divergence is a highly valuable technical analysis tool that helps investors understand the true momentum behind price movements and identify potential market turning points. By mastering MACD bearish and bullish divergence, and combining them with volume, trendlines, and other tools, you can make more informed and forward-looking trading decisions. Incorporating MACD divergence strategies into your analysis framework is a key step toward improving trade success rates and optimizing your investment portfolio.
Related Articles
-
How to Get Started with Bitcoin? The Complete 2026 Bitcoin Buying Guide for Beginners After watching Bitcoin repeatedly reach new highs in recent years and successfully pass spot ETF reviews in the US and Hong Kong in 2024, officially entering mainstream financial markets, many investors have turned their attention to...2026 年 7 月 20 日
-
Is Gold’s V-Shaped Rebound a Bottom-Fishing Signal? A Complete Guide to Trading Strategies Amid “$100 Price Swings” What Is a Gold V-Shaped Rebound? More Than Just a Technical Pattern The gold market has recently experienced sharp rises and falls, with prices frequently displaying dramatic “gold V-shaped rebounds”. Single-day “$100 price...2026 年 7 月 20 日
-
What Is PPI Data? 2026 Latest Analysis: Understand the Differences from CPI and How It Affects Stock Market Trends With market information constantly changing, do you always hold your breath while waiting for CPI data to be released? But did you know that a more forward-looking inflation indicator, PPI data...2026 年 7 月 20 日