Apple (AAPL) Stock Price 2026: Charts & Investment Guide

Updated: 2026/02/12  |  CashbackIsland

2026蘋果(AAPL)股價全解析:一篇看懂走勢圖、盤後交易與未來投資策略

2026 Apple (AAPL) Stock Price Full Analysis: A Complete Guide to Price Charts, After-Hours Trading, and Future Investment Strategies

Want to invest in the global tech leader Apple (Apple) but feel confused by the complex information around Apple’s stock price and after-hours volatility? Many investors watch the flashing numbers and professional Apple stock price charts, unsure where to start when judging the right time to enter. In fact, to accurately grasp the pulse of the AAPL stock price, you not only need to understand the basic quotes, but also the driving forces and market sentiment behind them. This article provides a complete Apple stock investment guide, from real-time quotes and chart analysis to decoding the mysterious Apple after-hours trading, so you can master all key information at once and make smarter investment decisions. 


What Is the Apple Stock Price (AAPL)? A Basic Lesson for Beginner Investors

For investors new to the US stock market, Apple is undoubtedly one of the most attractive targets. But before you put money to work, let’s first build some foundational understanding of the AAPL stock price.


Why Is Apple’s US Stock Ticker AAPL?

In the stock market, every listed company has a unique ticker symbol that helps investors identify and trade it quickly. Apple is listed on the NASDAQ exchange in the US, and its ticker symbol is “AAPL”. This four-letter symbol is the common language global investors use to buy and sell Apple shares. When you enter AAPL in any brokerage app or financial website, you can instantly find all information related to Apple’s stock price.


The Five Key Factors That Influence Apple’s Stock Price

AAPL stock price movements are not random, but the result of multiple factors working together. Understanding these factors helps you better anticipate future price trends:

一張示意圖,展示影響蘋果股價的五大關鍵因素:新產品、財務報告、供應鏈、市場競爭和宏觀經濟。

These five core factors jointly drive every move in Apple’s stock price.

  • 🍎 New product launches: Apple’s annual fall event is a major market focus. The release of a new iPhone, Mac, or other innovative products directly affects market expectations for the company’s future revenue, and in turn influences the stock price.
  • 📊 Company financial reports: Apple releases quarterly earnings, including revenue, profit, earnings per share (EPS), and forward guidance. These figures are the most direct proof of operating performance and often trigger sharp stock price swings after release, especially during after-hours trading.
  • 🔗 Global supply chain conditions: From chip shortages to production line efficiency, any disruption across the supply chain can affect Apple’s shipment volumes and put pressure on the stock price.
  • ⚔️ Competitive landscape: Competition from tech giants like Samsung and Google, as well as regulatory pressure such as antitrust investigations, are factors investors consider when assessing Apple’s long-term moat.
  • 🌍 Macroeconomic environment: Interest rate moves, inflation, and the global economic cycle also affect consumer purchasing power and overall stock market valuation levels, and the AAPL stock price cannot remain unaffected.


How to Read Apple Stock Price Charts? Three Tips to Instantly Understand the Trend

When faced with complex Apple stock price charts, many beginners feel overwhelmed. In fact, by mastering a few basic techniques, you can read bullish and bearish signals from the market and identify potential buying and selling opportunities.


Candlestick Chart Basics: What Do Red and Green Candles Represent?

The candlestick chart (Candlestick Chart) is the foundation of technical analysis. Each “candle” contains four key price points: the opening price, closing price, highest price, and lowest price.

K線圖教學圖解,顯示綠色陽線與紅色陰線的開盤價、收盤價、最高價與最低價的結構。

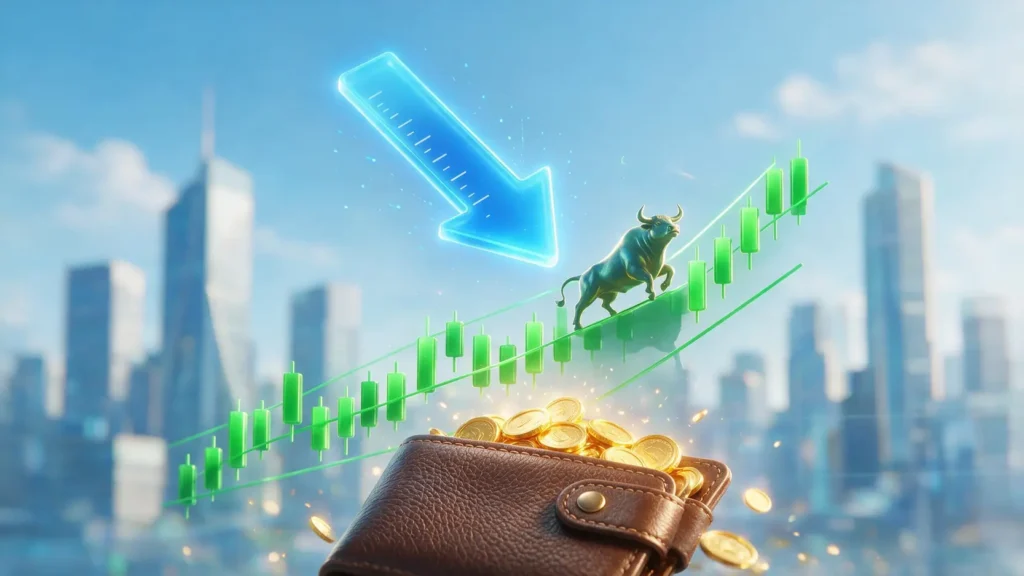
Understanding candlestick structure: green candles represent gains, red candles represent losses.

  • Green candle (or red, depending on regional convention): indicates that the “closing price is higher than the opening price”, showing the stock rose that day and bullish sentiment dominated the market.
  • Red candle (or black candle): indicates that the “closing price is lower than the opening price”, showing the stock fell that day and bearish sentiment was stronger.
  • Upper and lower wicks: the thin lines above and below the candle body represent the day’s highest and lowest prices. The longer the wicks, the more intense the price volatility that day.


Using Volume to Judge Market Activity and Buying and Selling Strength

Volume shows the total number of shares traded within a specific period and is usually displayed below the candlestick chart. It is a key indicator for assessing whether a price trend is healthy.

  • Price up, volume up: a healthy pattern, indicating strong buying support behind the uptrend, with potential for further gains.
  • Price up, volume down: upward momentum may be weakening, and the risk of a trend reversal should be monitored.
  • Price down, volume up: panic selling pressure is emerging, the downtrend may continue, and this is a dangerous signal.
  • Price down, volume down: selling pressure is easing, the stock price may be approaching a bottom, or it may simply be a temporary pullback.


Using Moving Averages (MA) to Identify Support and Resistance Levels

A moving average (Moving Average, MA) is a line created by connecting the average stock price over a past period, helping smooth out short-term fluctuations and reveal longer-term trends. Commonly used MAs include the 5-day MA (weekly line), 20-day MA (monthly line), and 60-day MA (quarterly line).

  • MA trending upward: indicates the stock price is in an uptrend.
  • MA trending downward: indicates the stock price is in a downtrend.
  • Price above the MA: the MA acts as a “support” level, and pullbacks to this level may find buying support.
  • Price below the MA: the MA acts as a “resistance” level, and rebounds to this level may encounter selling pressure.


Further Reading (Highly Recommended)

[2025 Broker Recommendations] How to Choose a Broker? Five Selection Criteria for Beginners and a Comparison of Popular Brokers 

What Is Apple After-Hours Stock Trading? Why Is It So Important?

You may often hear news reports such as: “Apple earnings beat expectations, and the stock surged 10% after hours”. For professional investors, this “after-hours trading” period is a critical moment to gain an early edge. So what exactly is Apple after-hours stock trading?


The Significance of After-Hours Prices: A Key Indicator for Early Market Reactions to News

The regular US stock market trading hours are 9:30 a.m. to 4:00 p.m. Eastern Time. After the market closes at 4:00 p.m. until 8:00 p.m., trading can still take place. This period is known as “after-hours trading”.

After-hours trading is important because many major announcements, such as company earnings reports, M&A deals, or significant news, are usually released after the market closes. This makes after-hours prices the market’s “first reaction” to such news. By observing changes in AAPL’s stock price after hours, investors can anticipate possible price action at the next day’s open and position themselves in advance.


How to Check Real-Time AAPL After-Hours Quotes? Recommended Tools and Websites

If you want to check real-time Apple after-hours quotes, there are many reliable channels. Most US stock brokers’ trading platforms provide after-hours quote features. In addition, many well-known financial websites are also excellent sources of information, such as TradingView and Yahoo Finance. They offer detailed after-hours market data and charts to help investors track the most active stocks. 

Apple Stock Price Outlook: Is It Worth Investing in 2026?

Looking ahead, Apple’s stock price growth potential remains a key market focus. Despite challenges such as global economic uncertainty and market saturation, Apple is still actively expanding across multiple areas in search of the next growth curve.


Potential Analysis of AI Development and New Product Lines Such as Vision Pro

Artificial intelligence (AI) is the most important trend in today’s tech industry, and Apple is actively integrating AI deeply into its operating systems and hardware. From a smarter Siri to various generative AI applications, it is expected to significantly enhance the user experience and may also create new paid services. In addition, the highly anticipated mixed reality headset Vision Pro, while initially priced high, represents Apple’s vision for the future of “spatial computing”. If Vision Pro succeeds in building an entirely new ecosystem, its long-term potential could be enormous. For investors who follow tech trends, gaining a deeper understanding of an AI concept stock investment guide will help you stay on top of market movements.


A Summary of Top Analysts’ Investment Ratings and Target Prices

Wall Street analysts are generally positive about Apple’s future. Most analysts give AAPL a “buy” or “hold” rating. They are optimistic about Apple’s strong brand loyalty, stable growth in services revenue, and continued innovation. Based on reports from multiple top investment banks, analysts’ target prices are generally above the current stock price, suggesting they believe Apple’s stock price still has room to rise over the next year. Of course, investors should still make their own judgments and use analysts’ views as one reference.


How to Buy Apple Stock? Four Steps to Easily Become an Apple Shareholder

After reading the analysis above, do you also want to become an Apple shareholder and share in the growth dividends of this great company? The process of buying Apple stock is actually very simple. You only need to complete the following four steps. 💪

購買蘋果股票的四個步驟流程圖:選擇券商、開戶驗證、入金、下單交易。

Four steps to easily become an Apple shareholder.


Step One: Choose a Safe and Reliable US Stock Broker

This is the most critical step. It is essential to choose a broker that is regulated by authoritative institutions (such as FINRA in the US), offers low trading fees, and has a user-friendly platform interface. There are many well-known online brokers on the market, most of which provide Chinese-language interfaces and customer support, making them very suitable for investors in Chinese-speaking regions.


Step Two: Complete Online Account Opening and Identity Verification

Nowadays, the broker account opening process can almost entirely be completed online. You will need to prepare identity documents (such as a passport or ID card) as well as proof of address. Follow the website instructions to fill in your personal information, complete the investment experience questionnaire, and upload the required documents. The review is usually completed within 1 to 3 business days.


Step Three: Funding Your Account and Placing Trades

After successfully opening an account, the next step is to transfer funds into your brokerage account. This process is known as “funding”. You can transfer funds via bank wire transfer to the account designated by the broker. Once the funds have arrived, you can start trading!

  1. Log in to the broker’s app or website.
  2. Enter Apple’s stock ticker symbol “AAPL” in the search bar.
  3. Click “Trade” or “Place Order”.
  4. Choose the order type (market order or limit order) and enter the number of shares you want to buy.
  5. After confirming that all order details are correct, submit the order.

Congratulations! You have successfully purchased your first Apple stock.


Frequently Asked Questions (FAQ) About Investing in Apple Stock Price

How Much Does One Share of Apple Stock (AAPL) Cost Right Now?

The AAPL stock price changes at all times. You can check the most up-to-date quote through any brokerage platform or mainstream financial websites (such as Yahoo Finance and Google Finance). The stock price fluctuates due to market supply and demand, company news, and overall economic conditions.

Does Apple Pay Dividends? How Many Times a Year?

Yes, Apple pays dividends. At present, Apple adopts a quarterly dividend policy, which means it pays dividends four times a year. Although its dividend yield is not particularly high among tech stocks, its stable dividend policy also reflects the company’s healthy cash flow position.

What Is the All-Time High for the AAPL Stock Price?

Apple’s all-time high stock price is continuously updated over time. To check the latest all-time high, it is recommended to review a long-term stock price chart directly. The all-time high is an important psychological level. Breaking above it often indicates the stock has entered a new upward range.

Is There a Minimum Quantity Requirement to Buy AAPL Stock?

No. Many US stock brokers now offer “fractional shares”, which means you can use a small amount of money (for example, US$1 or US$5) to buy a fraction of Apple stock. This significantly lowers the investment threshold and is especially suitable for investors with limited capital or beginners.


Conclusion

In summary, investing in Apple’s stock price is not only about believing in a company’s future, but also about participating in the global trend of technological innovation. Through this guide, we believe you now have a deeper understanding of how to analyze AAPL stock price charts and the importance of after-hours trading. Remember, successful investing requires a combination of fundamental analysis and technical observation, along with constant respect for the market. Continuously monitoring Apple’s earnings, new product developments, and macroeconomic changes will be your best way to successfully invest in Apple’s stock price.

编者
Evan Lin

Evan Lin

我是Evan Lin,从大学时期开始接触外汇交易,至今已有多年实战经验,熟悉技术分析与EA策略,热衷于研究市场脉动与风险管控,喜欢分享实战经验和交易技巧,和大家一起学习、一起进步!

If you liked this article, please share it!

Related Articles

  • Order Flow Analysis Tools: Track Institutional Activity
    In-Depth Review of Intelligent Order Flow Detection Tools: Understanding Institutional Activity and Identifying Real Market Buying and Selling Pressure What Is Order Flow, and Why Is It a “Leading Indicator” for Price Prediction? Candlestick charts and technical indicators can be misleading, but the real-money "Order Flow" within the market cannot....
    2026 年 6 月 4 日
  • Social Sentiment Indicators: Predicting Stock Trends
    Social Sentiment Quantitative Indicators: Mining PTT and Dcard Discussions to Predict Stock Prices What Are Social Sentiment Quantitative Indicators, and Why Are They Becoming Increasingly Important? In an era of information overload, financial markets are no longer driven solely by cold financial statements and macroeconomic data. The "Shipping King" phenomenon...
    2026 年 6 月 4 日
  • Taiwan FSC Futures Broker Verification Guide
    Avoid Fraudulent Platforms! A Visual Guide to Taiwan FSC Licensed Futures Merchant Verification and Scam Prevention In recent years, driven by heightened volatility in global financial markets and the impact of monetary easing policies worldwide, more investors have begun seeking diversified investment instruments. However, underground futures operators and overseas fraudulent...
    2026 年 6 月 4 日
返回顶部