S&P 500 Annual Returns: Historical Data & ETF Strategies

Updated: 2026/03/24  |  CashbackIsland

S&P 500 年回報率全攻略:數據分析歷年回報與最佳美股ETF投資策略

A Complete Guide to S&P 500 Annual Returns: Data Analysis of Historical Returns and the Best US Equity ETF Investment Strategies

Looking for a stable investment approach endorsed by Warren Buffett himself? Countless investors are highly interested in the “S&P 500 index annual return”, yet feel confused about the actual historical S&P 500 returns and how to choose the most suitable US equity ETF. After all, while historical data may be appealing, the actual returns from investing in US equity ETFs involve many details. This article will provide an in-depth analysis of the historical return data of the S&P 500 index, interpret the true state of the market from the data, and offer a detailed comparison of the most popular tracking ETFs available, giving you a clear and actionable investment blueprint to help you take the first steady step toward wealth growth. 


What Is the S&P 500 Index? Why Is It the Gold Standard for Measuring the US Stock Market?

Before exploring S&P 500 annual returns in depth, it is essential to understand its nature. The S&P 500 index, formally known as the “Standard & Poor’s 500 Index”, is a stock market index maintained by Standard & Poor’s. It is not a stock that can be purchased directly, but rather a “basket” containing the stocks of 500 of the most representative large listed companies in the US. The movement of this index reflects changes in the total market value of these 500 companies, and is therefore widely regarded as an authoritative indicator of the overall health of the US economy and stock market.

標普 500 指數概念圖,一個籃子裡裝著代表科技、金融、醫療等行業的 500 家公司圖標。

The S&P 500 index is like an investment portfolio composed of 500 top US listed companies, covering all key sectors of the economy.


The Composition of the S&P 500: Not Just 500 Companies, but a Reflection of the US Economy

To be included in the S&P 500 index, a company must meet strict criteria, including market capitalization, liquidity, profitability, and industry representation. This ensures that the index components are industry leaders, such as Apple, Microsoft, and Amazon, among other well-known giants. These companies span key sectors such as technology, finance, healthcare, and consumer goods, with operations across the globe. Therefore, when you invest in an ETF that tracks the S&P 500, you are not only investing in 500 companies, but also indirectly investing in the core of the US economy. For more authoritative information about this index, you may refer to the official website of S&P Dow Jones Indices

Why Even Warren Buffett Recommends S&P 500 Index Funds for Ordinary Investors?

“Oracle of Omaha” Warren Buffett has repeatedly stated in public that for most ordinary investors who do not have the time or expertise to research individual stocks, consistently buying and holding low-cost S&P 500 index funds (or ETFs) is the best investment strategy. His reasoning is both practical and compelling:

  • Extreme diversification: A single investment provides exposure to 500 leading US companies, effectively diversifying “unsystematic risk” arising from poor performance of individual companies or declining industries.
  • Very low cost: Compared to actively managed funds that require fund managers to select stocks, passive ETFs that track indices have very low management fees. Over the long term, the cost savings can be substantial, and these savings directly translate into your returns.
  • Betting on the US economy: Investing in the S&P 500 essentially reflects confidence in the long-term innovation capability and growth potential of the US economy. History has shown that despite multiple recessions and market crashes, the US economy has consistently demonstrated resilience and returned to a growth trajectory.
  • Outperforming most professionals: Buffett has pointed out that many high-fee professional fund managers often underperform the S&P 500 index over the long term. Rather than trying to select the few managers who may outperform the market, it is better to simply capture the market’s average return. This is the core principle of the passive investment strategy he advocates.


Further Reading (Highly Recommended)

US Equity ETF Recommendations 2026: A Complete Guide to Market-Tracking and Gold ETFs with Risk Analysis

2026 Complete Guide to US Equity CFD Trading: Platform Comparison, Pros and Cons, and Beginner Tutorial!


A Complete Analysis of Historical S&P 500 Returns

When it comes to investing, data is the most powerful evidence. The S&P 500 index is highly regarded precisely because of its stable long-term return performance. Let us take a deeper look at historical S&P 500 returns and see what key insights the data reveals.


Chart Analysis: Average Annual Returns of the S&P 500 Over the Past 10, 20, and 50 Years

Historical data shows that the long-term annualized return of the S&P 500 index is highly attractive. Although annual returns fluctuate significantly, when viewed over a longer time horizon, the overall growth trend is very clear.

Time Period Average Annualized Return (Approximate)

Description

Past 10 Years ~12.5% Experienced the long bull market of the 2010s, and even with corrections during the period, returns remained strong
Past 20 Years ~9.8% Covers the impact of the 2008 financial crisis, but long-term holders still achieved steady growth
Past 50 Years ~10.5% Has gone through multiple oil crises, the tech bubble, and financial crises, demonstrating its strong ability to withstand economic cycles

Note: The above data are approximate averages for reference only. Actual returns may vary depending on the calculation period and whether dividend reinvestment is included.


Total Return Including Dividend Reinvestment: The Power of Compounding Passive Income

Many beginners, when looking at S&P 500 returns, focus only on the growth of the index level (price return) and overlook a very important component, dividends. Most companies in the S&P 500 distribute dividends to shareholders on a regular basis. When you invest in related ETFs, you receive these dividends. If the dividends received are used to purchase more ETF shares, (that is dividend reinvestment), your assets will grow at an accelerated rate through “compounding”.

一張比較圖表,顯示了股息再投資對 S&P 500 總回報的巨大影響,總回報的增長曲線遠高於僅計算價格回報的曲線。

The Power of Compounding: Reinvesting dividends allows your total return (green line) to significantly outperform returns based solely on price growth (blue line).

The so-called “total return” refers to the combined calculation of price growth and dividend reinvestment. Over the long term, dividend reinvestment contributes significantly to total returns and may account for more than one-third of the total return! This is also the key to achieving passive income and long-term wealth appreciation.


Performance in Bull and Bear Markets: What Do Historical Fluctuations Tell Us?

Investing in the S&P 500 is not a smooth straight line. The market has bull markets (upward periods) and bear markets (downward periods). Looking back at history, the S&P 500 has experienced multiple sharp declines:

  • 2000 Dot-Com Bubble Burst: The index fell by nearly 50% within two years.
  • 2008 Global Financial Crisis: The index dropped by more than 55% from its peak.
  • 2020 COVID-19 Outbreak: The index declined by more than 30% within just one month.

These dramatic declines are enough to cause panic for any investor. However, history also tells us that after every bear market, the market has rebounded more strongly and reached new highs. This provides the most important insight: short-term market fluctuations are normal, while the long-term trend is upward. For S&P 500 investors, the key to success is often not attempting to time the market, but maintaining discipline during downturns, holding positions, or even regularly adding more.

標普 500 指數長期走勢圖,顯示儘管經歷了 2000 年、2008 年和 2020 年的大幅下跌,但市場長期趨勢依然向上。

History shows that short-term market fluctuations are normal, while the long-term trend is upward. After every crisis, the market recovers and reaches new highs.


How to Invest in the S&P 500? Comparison of Three Popular US Equity ETFs (VOO, SPY, IVV)

Since the index cannot be purchased directly, the best way to invest in the S&P 500 is through ETFs that track it. There are many options available in the market, among which three ETFs issued by different providers are the most well-known and have the highest trading volumes: VOO, SPY, and IVV. Understanding their differences will help you choose the most suitable US equity ETF return tool.


VOO vs SPY vs IVV: Comparative Analysis Table of Management Fees, Tracking Error, and Size

These three ETFs have the exact same objective, to replicate the performance of the S&P 500 index. Their holdings are almost identical, so their long-term performance is also very similar. The main differences lie in some subtle but important details, especially management fees.

Category VOO (Vanguard S&P 500 ETF) SPY (SPDR S&P 500 ETF Trust) IVV (iShares CORE S&P 500 ETF)
Issuer Vanguard  State Street (State Street Global Advisors) BlackRock 
Total Expense Ratio 0.03% (Lowest) 0.09% 0.03%
Assets Under Management (AUM) Huge Largest, longest history Huge
Liquidity / Trading Volume Very High Highest, suitable for frequent traders or options traders Very High
Structure ETF (Dividend Reinvestment Available) Unit Investment Trust (UIT) ETF (Dividend Reinvestment Available)


Which One Is Best for You? Investment Advice and Selection Guide for Beginners

For the vast majority of investors seeking long-term holding and steady growth, the selection criterion is very simple: prioritize the option with the lowest total expense ratio.

  • Top Recommendation: VOO and IVV
    These two ETFs have an expense ratio of only 0.03%, meaning you only need to pay 0.3 USD in management fees annually for every 10,000 USD of assets held. Over an investment horizon spanning decades, this small fee difference will compound into a considerable amount in your portfolio. There is virtually no substantial difference between the two, and either can be chosen.
  • Specific Use: SPY
    SPY is the first ETF in the market, with the longest history, the largest scale, and the highest average daily trading volume. This makes it a favorite among institutional investors, day traders, and options traders. If you have these specific needs, SPY is undoubtedly the best choice. However, for ordinary long-term investors, its relatively higher 0.09% expense ratio makes it slightly less attractive than VOO and IVV.

In summary, if you are an investor planning to buy and hold for the long term, choosing VOO or IVV directly is the right move. Do not underestimate the 0.06% fee difference, time will magnify it.


Further Reading (Highly Recommended)

Complete Comparison of the Three Major US Indices: Dow Jones, Nasdaq, and S&P 500 Trend Analysis …

US Equity ETF Recommendations 2026: A Complete Guide to Market-Tracking and Gold ETFs with Risk Analysis


Calculate Your Real Returns: Costs and Risks of Investing in S&P 500 ETFs

After understanding the historical average return of the S&P 500, you also need to consider the factors that affect your actual “take-home” returns. These factors mainly include taxes and potential investment risks, which are important components of real US equity ETF returns.


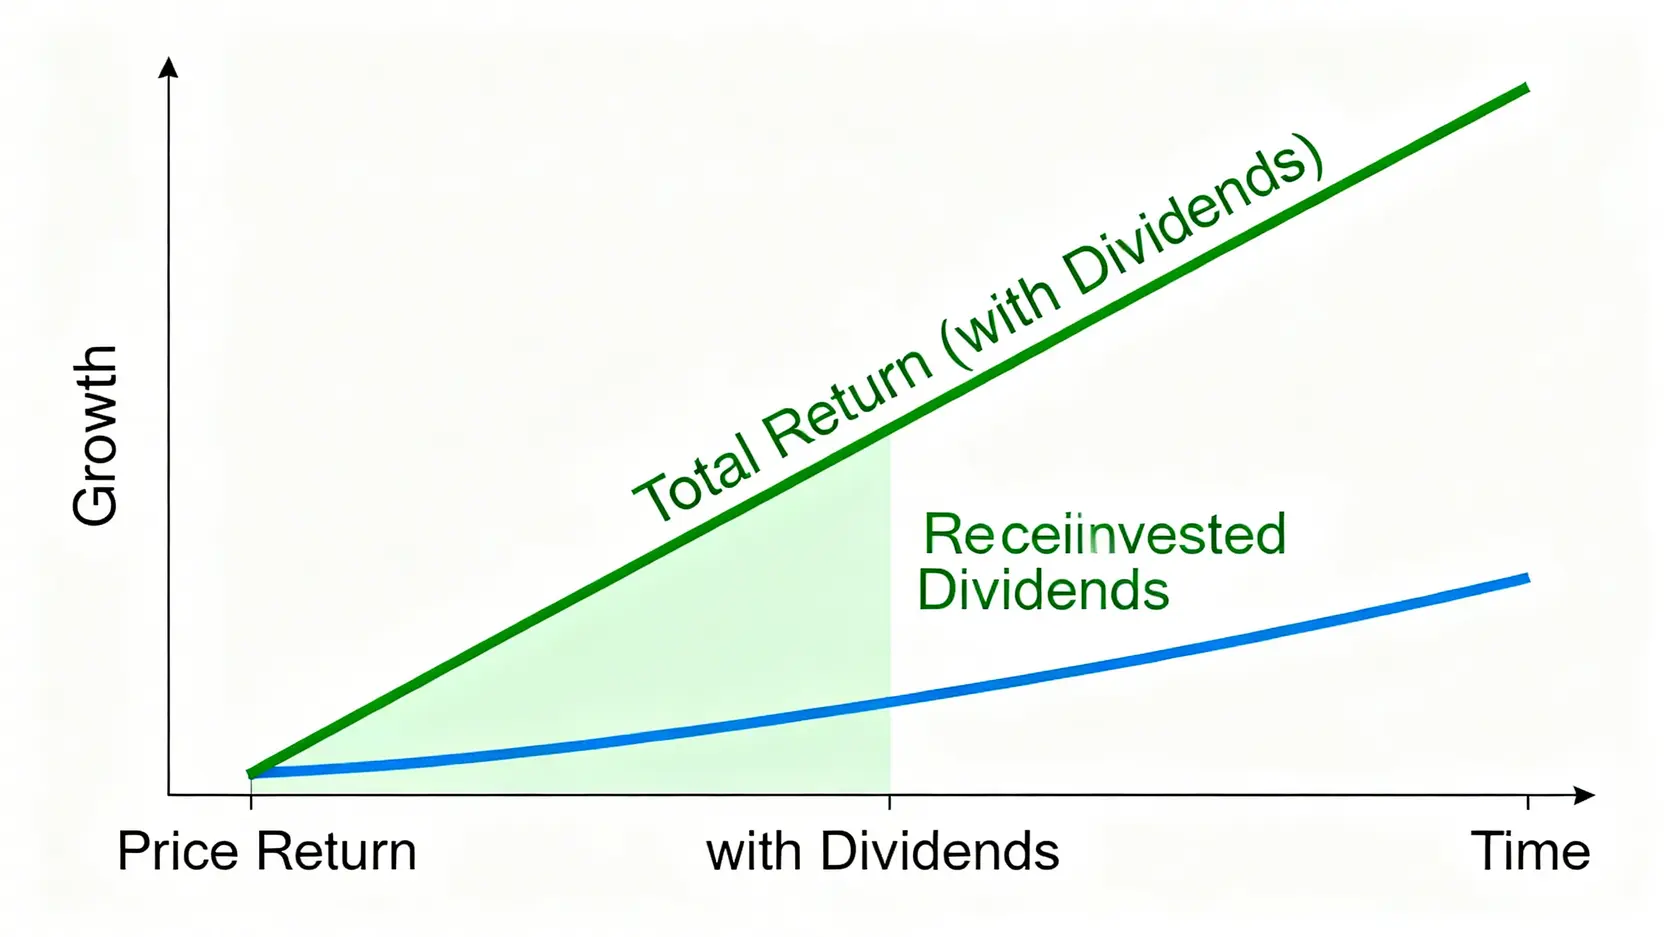
Dividend Returns: Distribution Policies of S&P 500 ETFs and the Impact of the 30% Withholding Tax

For investors who are not US tax residents (such as those from mainland China, Taiwan, and Malaysia), dividends received from US companies are subject to a 30% withholding tax. This tax cost directly affects your total return.

Example:
Assume the dividend yield of the S&P 500 in a given year is 1.5%.

  • The nominal dividend you receive is 1.5%.
  • The US government withholds 1.5% * 30% = 0.45% in taxes.
  • Your actual after-tax dividend yield is approximately 1.5% – 0.45% = 1.05%.

Although this may seem like a significant deduction, even after taking it into account, the long-term total return of S&P 500 ETFs remains highly attractive. The key is to include this factor when calculating expected returns to avoid overly optimistic expectations.


Three Key Risks You Must Know: Market Volatility, Exchange Rates, and Inflation

Any investment involves risks, and the S&P 500 is no exception. Fully understanding these risks allows you to remain calm during market turbulence.

  1. Market Volatility Risk (Systematic Risk)
    This is the primary risk. Even though the S&P 500 is highly diversified, it cannot avoid system-wide market declines, such as economic recessions, geopolitical crises, or global black swan events. As mentioned earlier, the S&P 500 has historically experienced multiple drawdowns of more than 30% or even 50%. Investors must be mentally prepared to withstand significant short-term fluctuations in portfolio value.
  2. Currency Risk
    Since S&P 500 ETFs are denominated and traded in US dollars, investors whose local currency is not USD are exposed to exchange rate risk. If you buy when the US dollar is strong and sell when it is weak, converting back to your local currency will erode your returns. The opposite is also true. Over the long term, exchange rate fluctuations may be offset by market growth, but this remains a short-term variable to monitor.
  3. Inflation Risk
    Your investment returns must outpace inflation for your wealth to achieve real growth. If the annual return of the S&P 500 is 8% while inflation is 3%, then your “real return” is 5%. Although the long-term return of the S&P 500 has historically exceeded average inflation levels, periods of high inflation may challenge the growth of your purchasing power.


Frequently Asked Questions About S&P 500 Annual Returns (FAQ)

Q: Does investing in the S&P 500 mean investing in the US economy?

A: To a large extent, yes. The S&P 500 index is composed of 500 of the largest and most representative listed companies in the US, and their total market value accounts for approximately 80% of the US stock market. Their business performance is highly correlated with overall economic conditions, consumer confidence, and corporate profitability in the US. Therefore, the S&P 500 is widely regarded as one of the most important and reliable barometers of the US economy. Investing in it is essentially a vote of confidence in the long-term growth potential of the US economy.

Q: Is it better to invest in the S&P 500 ETF with a lump sum or through DCA?

A: This is a classic question, and the answer depends on your financial situation and risk tolerance. Based purely on historical backtesting data, since the market has a long-term upward trend, in more than two-thirds of the time, the total return of “lump sum” investing is higher than that of “dollar-cost averaging (DCA)”. However, for beginners and ordinary investors who cannot predict market timing, DCA is a more stable and easier strategy to execute. It helps average out the purchase cost, automatically buys more shares during market declines, and effectively reduces timing risk while managing investment psychology.

Q: Besides the S&P 500, what other US equity index ETFs are worth considering?

A: Of course. While the S&P 500 serves as a core holding, depending on different investment goals, you can also consider other index ETFs:

  1. ETFs tracking the Nasdaq 100 index (such as QQQ): Mainly concentrated in technology and innovative growth stocks, with higher volatility but potentially greater long-term growth.
  2. ETFs tracking the Dow Jones Industrial Average (such as DIA): Include 30 US blue-chip companies and focus more on mature value giants.
  3. ETFs tracking the entire US stock market (such as VTI): Cover more than 3000 companies, including large-cap, mid-cap, and small-cap stocks, offering the broadest diversification.

Q: Do I need a lot of money to start investing in S&P 500 ETFs?

A: Not at all. This is one of the best aspects of modern investing. Many international brokers offer “odd‑lot trading” or “fractional shares” trading. This means you do not need to buy a full share at once (for example, VOO is currently priced above 400 USD) but you can invest any amount according to your budget, such as 50 USD or 100 USD, and the broker will automatically purchase the corresponding proportion of shares for you. This significantly lowers the investment threshold, allowing anyone to start easily.


Conclusion

In summary, the historical data of S&P 500 annual returns strongly demonstrates that it is a powerful tool suitable for inclusion in the core asset allocation of almost all investors. Through low-cost and efficient US equity ETFs such as VOO, SPY, and IVV, anyone can easily participate in the long-term growth of leading companies in the US and globally. To maximize your US equity ETF returns, the key is not to predict short-term market movements, but to establish and adhere to a simple and effective discipline: choose low-cost ETFs, hold for the long term, and use DCA to smooth market fluctuations. Start planning your S&P 500 investment strategy now and begin your journey toward steady wealth growth.

If you liked this article, please share it!

Related Articles

  • Volatility Surface Guide: Skew Trading Strategies
    Practical Applications of Volatility Surfaces: From Options Modeling to Advanced Skew Trading Strategies In options markets, implied volatility is never a flat line. Instead, it forms complex "smile" or "skew" surfaces. For advanced traders, mastering the practical applications of volatility surfaces is equivalent to possessing a lens that reveals market...
    2026 年 6 月 3 日
  • Foreign Capital Flow Model: Track Institutional Money
    Building a Foreign Capital Flow Copy Trading Model: A Stock Market Indicator for Accurately Tracking Institutional Positioning In Asia-Pacific stock markets, foreign capital inflows and outflows often determine the direction of the index. However, simply looking at daily net buy and sell data is no longer enough. Only by building...
    2026 年 6 月 3 日
  • Options Buying Strategies for Extreme Market Risks
    Options Buyer Strategies During Extreme Market Conditions: Black Swan Hedging and Cross-Market Arbitrage During Volatility Surges The most terrifying aspect of financial markets is not a gradual decline, but overnight flash crashes and cross-market capital withdrawals accompanied by volatility surges. In the highly unpredictable global macroeconomic environment of 2026, geopolitical...
    2026 年 6 月 3 日
返回顶部