Dow vs Nasdaq vs S&P 500: 2026 Index Comparison

Comprehensive Comparison of the Three Major US Stock Indices: A Complete Analysis of Dow Jones, Nasdaq, and S&P 500 Trends
Want to invest in US stocks but often hear that the “three major US stock indices” have hit new highs, yet still do not understand the differences among the Dow Jones, Nasdaq, and S&P 500? What does their rise or fall actually represent? Many new investors feel confused about Dow Jones Index trends and are unclear about the relationship between the Nasdaq Composite Index and technology stocks. This article will take you from the basics, providing a clear and in-depth explanation of the definitions, constituent characteristics, and historical trends of the three major US stock indices, along with practical investment strategies to help you quickly grasp the core pulse of the US stock market.
What Are the Three Major US Stock Indices? Why Are They the Global Market Barometer?
The three major US stock indices: The Dow Jones Industrial Average (DJIA), The Nasdaq Composite Index (NASDAQ), and The Standard & Poor’s 500 Index (S&P 500) are the most important benchmarks used by global investors to measure the overall performance of the US stock market. They not only reflect the health of the US economy, but their daily fluctuations also influence sentiment across global financial markets. The trends of these three indices serve as key references for identifying market direction and formulating investment strategies.
The Three Major Indices: A Thermometer for the US Economy
If you want to know whether a country’s economy is heating up or cooling down, what should you look at? A stock market index is an excellent “thermometer”.
- The Dow Jones Index: It is like an experienced traditional physician, focusing on the pulse of 30 of the strongest and largest “blue-chip” companies, reflecting the condition of major traditional industries in the US.
- The Nasdaq Index: It is like a technology pioneer focused on innovation and the future, with its movements reflecting the vitality and growth potential of the technology sector.
- The S&P 500 Index: It represents the most comprehensive health check, covering 500 leading companies across various industries and is widely regarded as the index that best represents the overall strength of the US economy.

When these indices continue to rise, it usually indicates strong corporate earnings, solid investor confidence, and an optimistic economic outlook. Conversely, when the indices decline, it may signal potential risks of economic recession.
Why Must Global Investors Monitor Their Daily Movements?
As the world’s largest economy, developments in the US have a decisive impact globally. The US dollar is the world’s primary reserve currency, and the US stock market is the core destination of global capital flows. Therefore, the daily movements of the three major US stock indices carry strong ripple effects:
- An indicator of global capital flows: When the three indices rise, global funds tend to flow into the US market, while declines may trigger capital outflows into safe-haven assets.
- A barometer of corporate confidence: Index performance directly affects global companies’ investment and expansion decisions.
- An amplifier of market sentiment: In today’s information-driven environment, movements in the three indices quickly transmit to Asian and European markets, influencing local investor sentiment and trading behavior.
Regardless of which regional market you invest in, monitoring the direction of the three major US stock indices is an indispensable part of making informed investment decisions.
In-Depth Analysis I: Dow Jones Industrial Average (DJIA)
The Dow Jones Industrial Average (DJIA), commonly referred to as the “Dow”, is the oldest and most renowned US stock index. It was created in 1896 by Charles Dow, the founder of “The Wall Street Journal”, originally to reflect developments in the US industrial sector. Today, it has become synonymous with measuring the performance of large, high-quality US stocks.
Constituent Characteristics: A Selection of 30 US Blue-Chip Companies
The Dow consists of only 30 constituent companies, but each is a leader in its respective industry and a well-established “blue-chip” company. These companies generally share the following characteristics:
- Massive scale: Large market capitalization and global operations, such as Apple and Microsoft.
- Long history: Many have operated for decades or even more than a century, such as Coca-Cola and Procter & Gamble.
- Stable profitability: Strong cash flow and consistent dividend payment records, making them favored by value investors.
- Industry representation: Although named the “Industrial Average”, its constituents now span finance, technology, consumer goods, healthcare, and other sectors, reflecting changes in the structure of the US economy.
The Dow’s constituents are selected and adjusted by a committee to ensure it continues to represent the most influential companies in the US economy.
Historical Trends and Market Significance of the Dow Jones Index
Observing the Dow Jones Index trend chart is like reading a history of the US economy. It has witnessed the Great Depression of 1929, the dot-com bubble in 2000, the financial crisis in 2008, and the long bull market that followed. Each historical high and low reflects the economic environment and market sentiment of its time.
As it uses a “price-weighted” calculation method, stocks with higher share prices have a greater impact on the index. This has drawn criticism, as some argue it does not fully reflect companies’ true market capitalization. Nevertheless, due to its long history and high visibility, the Dow’s daily movements remain the focus of global media coverage, and its symbolic significance outweighs its technical indicator value. For ordinary investors, the Dow serves as the most direct window into market sentiment. For more detailed information, refer to the official S&P Dow Jones Indices website.
In-Depth Analysis II: Nasdaq Composite Index (NASDAQ)
The Nasdaq Composite Index, commonly referred to as the “Nasdaq”, is the core benchmark representing US technology and emerging industries. It includes all companies listed on the Nasdaq exchange, totaling more than 3,000, making it the most diversified and broadest among the three major indices.
Further Reading (Highly Recommended)
Constituent Characteristics: A Hub for Technology and Growth Companies
The Nasdaq Composite Index is renowned for its strong “technology” and “growth” orientation. It gathers the world’s leading technology giants as well as many innovative small- and mid-sized companies with high potential. Its main characteristics include:
- Concentration of technology giants: Apple, Microsoft, Amazon, NVIDIA, Alphabet (Google), and Meta hold significant weight in the index.
- High growth potential: Many constituents are in rapid expansion phases, with revenue and profit growth rates far exceeding traditional industries, such as electric vehicle manufacturer Tesla.
- Innovation-driven: Covers cutting-edge fields including semiconductors, software, biotechnology, internet, and artificial intelligence, making it an ideal barometer for future industry trends.
- High degree of internationalization: Nasdaq attracts companies from around the world to list, giving it a global perspective.
Why Is the Nasdaq Often Seen as a Technology Stock Indicator?
The Nasdaq is regarded as a “barometer of technology stocks” for two main reasons. First, in terms of weighting, technology stocks account for more than 50 percent of the index, meaning their performance directly drives the overall direction of the index. Second, Nasdaq uses a “market capitalization-weighted” methodology, so companies with larger market capitalizations (typically technology giants) have greater influence. Therefore, when investors discuss bull or bear markets in technology stocks, they almost always refer to the Nasdaq’s performance as the primary benchmark. For investors focused on growth strategies and aiming to capture the next wave of technological innovation, closely monitoring the Nasdaq Composite Index is essential.
In-Depth Analysis III: S&P 500 Index
The Standard & Poor’s 500 Index, commonly known as the S&P 500, is widely regarded as the best single indicator of the performance of the US large-cap market. Compiled by Standard & Poor’s, it tracks 500 leading companies listed on major US exchanges, covering approximately 80 percent of total US market capitalization.
Constituent Characteristics: 500 Leading Companies Across 11 Major Sectors
Unlike the Dow’s 30 companies and Nasdaq’s technology bias, the S&P 500 is known for its “breadth” and “balance”. Its constituents must meet strict criteria, including market capitalization, liquidity, and profitability. Its core characteristics include:
- Industry diversification: Constituents span 11 major sectors, including information technology, healthcare, financials, consumer discretionary, communication services, and industrials, effectively reducing single-sector risk.
- Collection of industry leaders: These 500 companies are leaders in their respective fields and represent the backbone of the US economy.
- Market capitalization weighting: Like Nasdaq, it uses market capitalization weighting, more accurately reflecting changes in market structure, with larger companies exerting greater influence on the index.
- Dynamic adjustments: The index committee regularly reviews and updates the constituent list, removing companies that no longer meet criteria and adding emerging high-quality firms to maintain representativeness and vitality.
Why Does Buffett Recommend the S&P 500 to Ordinary Investors?
Warren Buffett has repeatedly stated in public that for the vast majority of ordinary investors who lack the time and expertise to analyze individual stocks, long-term investment in an S&P 500 index fund is the best choice. His recommendation is based on three main reasons:
- Participate in long-term US economic growth: Investing in the S&P 500 is equivalent to buying 500 of the best US companies at once, allowing your wealth to grow alongside the overall US economy.
- Maximum diversification: A single index provides cross-industry and cross-company diversification, reducing the risk of significant losses caused by individual company failures.
- Low cost and high efficiency: Compared to actively managed funds, index funds tracking the S&P 500 (such as ETFs) have extremely low management fees, significantly enhancing long-term returns.
Buffett’s endorsement has established the S&P 500 as the gold standard for global passive investing and long-term value investing.
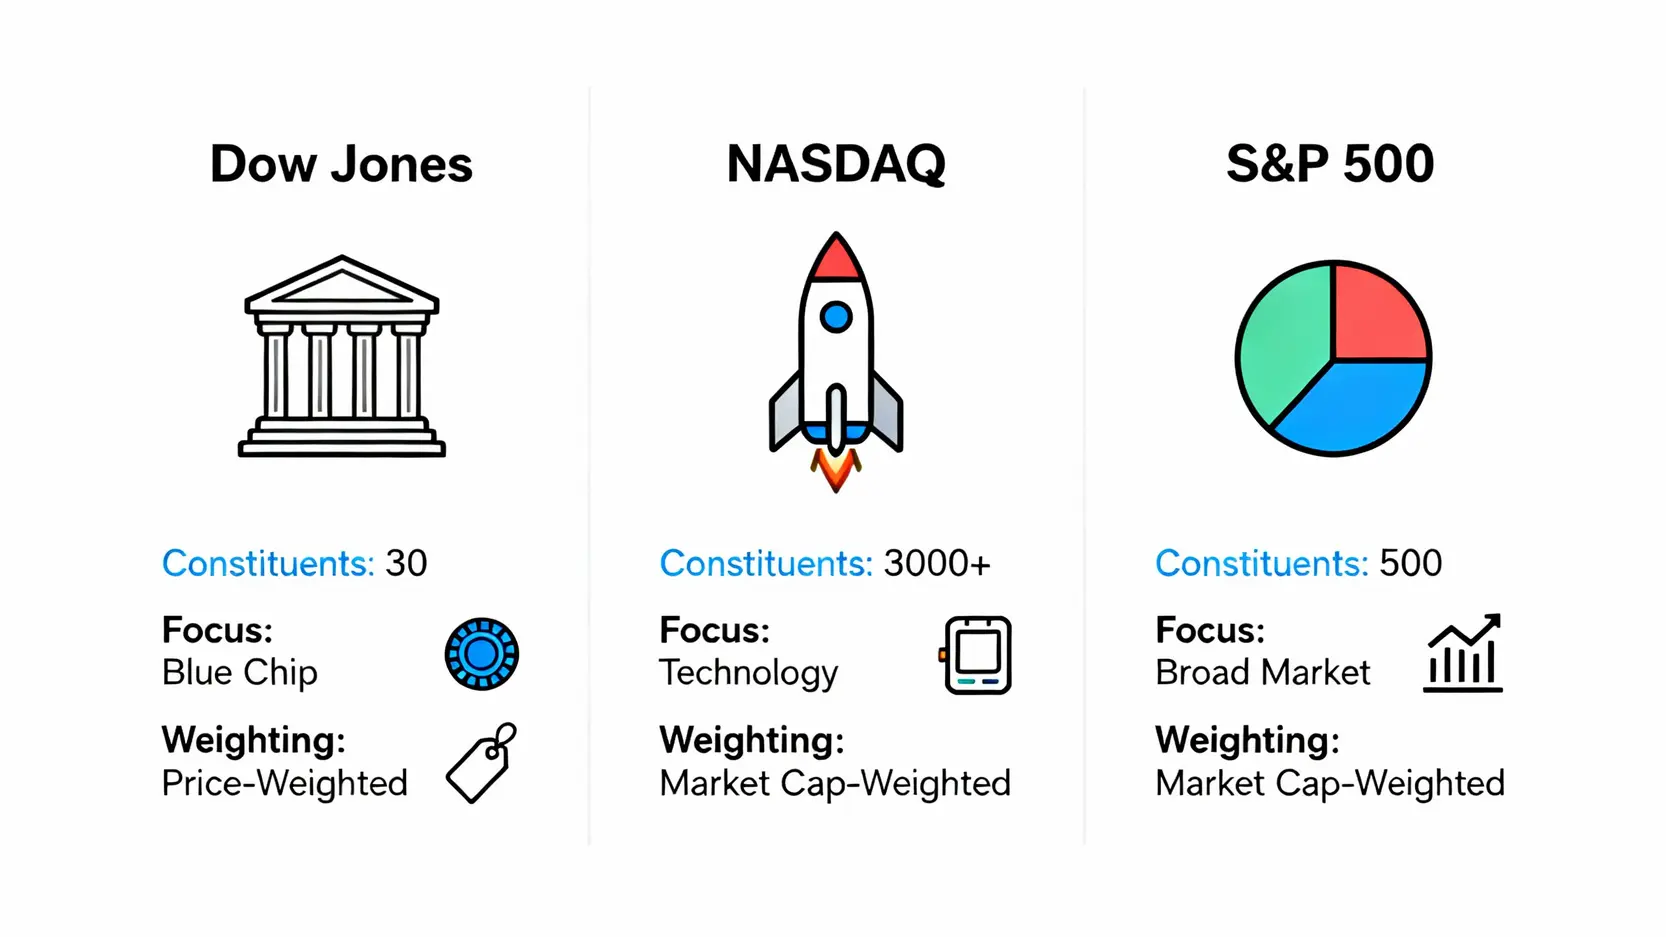
Comparison of the Three Major US Stock Indices: Understanding the Core Differences at a Glance
After understanding the characteristics of each of the three major indices, let us use a clear table to conduct a side-by-side comparison to help you more intuitively grasp their core differences and determine which index better aligns with your investment style.

Comparison Table: Number of Constituents, Calculation Method, Representative Industries, Risk Characteristics
| Comparison Item | Dow Jones Industrial Average (DJIA) | Nasdaq Composite Index (NASDAQ) | S&P 500 Index (S&P 500) |
| Number of Constituents | 30 Companies | Approximately 3,000+ Companies | Approximately 500 Companies |
| Calculation Method | Price-Weighted | Market Capitalization-Weighted | Market Capitalization-Weighted |
| Representative Industries | Large Blue-Chip Stocks, Traditional Industries | Technology, Biotechnology, Growth Companies | Spans 11 Major Sectors, Most Representative of the Overall US Market |
| Risk Characteristics | Relatively Stable, Lower Volatility | Higher Volatility, Larger Gains in Bull Markets and Deeper Declines in Bear Markets | Balanced Risk and Return, Broad Market Representation |
Which Index Should Beginner Investors Focus On?
For new investors, there is no absolute answer. The choice depends on your investment objectives and risk tolerance:
- If you are a conservative investor: If you seek stability and prefer to avoid large fluctuations in your assets, you may start by focusing on the Dow Jones Index, as its constituents are mostly mature and stable companies.
- If you are a growth-oriented investor: If you are optimistic about the future of technology and are willing to accept higher risk in exchange for higher returns, then the Nasdaq Index is undoubtedly your top choice.
- If you are a balanced or passive investor: If you want the simplest way to participate in the growth of the entire US market, then following Buffett’s advice and focusing on investing in the S&P 500 Index is an excellent strategy.
For most beginners, starting with the S&P 500 Index, which best represents the overall market, is the most prudent first step in building a core asset allocation.
How to Invest in the Three Major US Stock Indices? Three Popular Approaches
It is not possible to purchase an index directly, but investors can track index performance through various financial instruments. Below are three of the most mainstream and popular investment channels, each with its own advantages and disadvantages, suitable for different types of investors.
The Most Stable Choice: Index ETFs (VOO, QQQ, DIA)
Index exchange-traded funds (ETFs) are the simplest and lowest-cost way for ordinary investors to participate in index investing. These ETFs trade on exchanges like stocks, allowing you to buy and sell them at any time. Their objective is to fully replicate the performance of their corresponding indices.
- ETFs tracking the S&P 500 Index: The most well-known include VOO (Vanguard S&P 500 ETF), IVV (iShares CORE S&P 500 ETF), and SPY (SPDR S&P 500 ETF Trust). They are core choices for building long-term investment portfolios.
- ETFs tracking the Nasdaq 100 Index: QQQ (Invesco QQQ Trust) tracks the 100 most representative non-financial companies listed on Nasdaq and is a preferred choice for investing in US technology stocks.
- ETFs tracking the Dow Jones Index: DIA (SPDR Dow Jones Industrial Average ETF) allows investors to gain exposure to 30 US blue-chip stocks in one transaction.
For beginners and long-term investors, regular fixed-amount investment in these ETFs is one of the most effective strategies to share in the dividends of US economic growth. To learn more about ETFs, you may refer to a beginner’s guide to gold investing, which also covers ETF concepts.
A Professional Investor Tool: Index Futures
Index futures are more complex financial derivatives that allow investors to buy or sell an index at a predetermined price on a specific future date. Futures trading involves high leverage, meaning that both potential profits and losses are magnified.
- Advantages: Provides very high capital efficiency, relatively low trading costs, and allows for both long and short positions, enabling profit opportunities in both rising and falling markets.
- Disadvantages: Leverage is a double-edged sword and carries very high risk, making it unsuitable for inexperienced beginners. In addition, futures contracts have expiration dates and require rollover operations.
Index futures are tools commonly used by professional traders and institutional investors for hedging or short-term speculation. Ordinary investors should participate only after fully understanding the associated risks.
Frequently Asked Questions About the Three Major US Stock Indices (FAQ)
Q: What is the difference between the three major US stock indices and the four major indices?
A: The commonly referred to “four major indices” are based on the three major indices (the Dow Jones, Nasdaq, and S&P 500) with the addition of the “Philadelphia Semiconductor Index (SOX)”. The Philadelphia Semiconductor Index specifically tracks the performance of major global semiconductor design, manufacturing, and sales companies. As semiconductors are the foundation of the entire technology industry, this index is regarded as a leading indicator of the technology sector’s outlook and therefore receives significant market attention.
Q: What ETFs are recommended for investing in the three major US stock indices?
A: There are many high-quality ETFs available in the market. Below are several representative ETFs with the largest scale and best liquidity:
- S&P 500 ETFs: VOO (Vanguard), IVV (iShares), SPY (State Street SPDR). Their tracking performance is similar, with VOO and IVV having slightly lower expense ratios.
- Nasdaq 100 ETF: QQQ (Invesco), the most direct tool for investing in large-cap technology stocks.
- Dow Jones Index ETF: DIA (State Street SPDR), suitable for investors who prefer large blue-chip stocks.
When selecting, you may compare their expense ratios, assets under management (AUM), and average daily trading volume.
Q: What are the opening trading hours of the three major US stock indices?
A: The regular trading hours of the US stock market correspond to the following times in Asia (subject to changes due to daylight saving time):
- During daylight saving time (approximately March to November): Hong Kong/ Taiwan/Malaysia time from 9:30 PM to 4:00 AM the next day.
- During standard time (approximately November to March of the following year): Hong Kong/Taiwan/Malaysia time from 10:30 PM to 5:00 AM the next day.
In addition, there are pre-market and after-hours trading sessions, but liquidity is relatively lower.
Conclusion
In summary, the three major US stock indices are essential tools for investors to understand the US stock market and even the global economy. The Dow Jones Index represents the steady strength of large blue-chip companies, the Nasdaq Composite Index reflects the pulse of innovation and growth in technology stocks, and the S&P 500 Index most comprehensively represents the overall performance of the US market. Gaining a thorough understanding of their characteristics, constituent differences, and calculation methods is the first step for every investor in formulating a successful investment strategy. For ordinary investors, allocating capital over the long term through low-cost index ETFs is the most stable and effective way to share in the achievements of the US economy.
Related Articles
-
Practical Applications of Volatility Surfaces: From Options Modeling to Advanced Skew Trading Strategies In options markets, implied volatility is never a flat line. Instead, it forms complex "smile" or "skew" surfaces. For advanced traders, mastering the practical applications of volatility surfaces is equivalent to possessing a lens that reveals market...2026 年 6 月 3 日
-
Building a Foreign Capital Flow Copy Trading Model: A Stock Market Indicator for Accurately Tracking Institutional Positioning In Asia-Pacific stock markets, foreign capital inflows and outflows often determine the direction of the index. However, simply looking at daily net buy and sell data is no longer enough. Only by building...2026 年 6 月 3 日
-
Options Buyer Strategies During Extreme Market Conditions: Black Swan Hedging and Cross-Market Arbitrage During Volatility Surges The most terrifying aspect of financial markets is not a gradual decline, but overnight flash crashes and cross-market capital withdrawals accompanied by volatility surges. In the highly unpredictable global macroeconomic environment of 2026, geopolitical...2026 年 6 月 3 日


