KD Indicator Guide: Formula, K & D Values, Golden Cross

Updated: 2026/03/24  |  CashbackIsland

kd-indicator-formula-guide 

A Complete Guide to the KD Indicator Formula: Calculation of K and D Values, Golden Cross, and the Principles of the Stochastic Oscillator

What Is the KD Indicator (Stochastic Oscillator)? Starting From the Core Principles

In financial markets such as stocks and forex, do you want to accurately grasp buy and sell timing but always feel confused by complex technical indicators? In fact, many tools relied upon by professionals are simpler than you think. The KD indicator (Stochastic Oscillator) is one of the most widely used key tools. Through the calculation of K and D values over a specific period, it helps investors determine overbought and oversold conditions and identify potential trend turning points. This article will provide a complete analysis of the KD indicator formula, starting from the underlying principles of the stochastic oscillator, and teach you how to use key signals such as the golden cross to make more informed investment decisions. 


The Origin and Basic Concepts of the KD Indicator: Why Can It Measure Price Momentum?

The KD indicator was developed in the 1950s by US analyst George C. Lane and belongs to the category of momentum indicators. Its core idea is very intuitive: when the market is in an uptrend, the closing price tends to be close to the highest price within the period, while in a downtrend, the closing price tends to be close to the lowest price within the period.

Imagine throwing a ball upward with force. Before reaching the highest point, its upward speed gradually slows down, and this “slowing speed” represents weakening momentum. The KD indicator uses mathematical formulas to quantify this change in price momentum. When the indicator falls from a high level or rebounds from a low level, it often signals that a trend may be ending or reversing. For more academic definitions of the stochastic oscillator, you may refer to Wikipedia


Breakdown of the Stochastic Oscillator Principles: The Relationship Between the Closing Price and Recent Highs and Lows

The fundamental principle of the stochastic oscillator is to measure the relative position of the “current closing price” within the “high-low range over a recent period (usually 9 days)”. This relative position forms the basis for calculating the K and D values, that is, RSV (Raw Stochastic Value).

  • If the closing price is close to recent highs, it indicates strong bullish momentum and upward market momentum.
  • If the closing price is close to recent lows, it indicates bearish dominance and downward market momentum.

By observing changes in this relative position, we can identify subtle shifts in market sentiment and discover trading opportunities earlier than others.


A Complete Breakdown of the KD Indicator Formula: How Are K and D Values Calculated?

After understanding the core principles, the next step is to break down the calculation process of the KD indicator formula. Although charting software can automatically generate KD lines, calculating it manually once allows you to better understand the interaction between the K line (fast line) and the D line (slow line), and why they generate effective trading signals. The entire K and D value calculation process is divided into three steps:

KD 指標計算流程圖,從價格高低點計算 RSV,再依序生成 K 值與 D 值。

Illustration of the Three Steps in KD Indicator Calculation: From RSV to K and D Values.


Step One: The Formula and Meaning of RSV (Raw Stochastic Value)

RSV (Raw Stochastic Value) is the starting point for calculating KD values. It reflects the percentage position of the current closing price within the price range over the past n days. The commonly used default value for n is 9 days.

RSV calculation formula:

RSV = (Today’s Closing Price – Lowest Price Over the Past n Days) / (Highest Price Over the Past n Days – Lowest Price Over the Past n Days) × 100

For example, if the highest price of a stock over the past 9 days is 110, the lowest price is 100, and today’s closing price is 108, then today’s RSV is:

(108 – 100) / (110 – 100) × 100 = 80

An RSV value of 80 indicates that today’s closing price is at the 80% level within the past 9-day price range, showing relatively strong bullish momentum.


Step Two: Detailed Explanation of the Calculation of K Value (Fast Line)

The K value is a smoothed version of the RSV value, based on the concept of an exponential moving average (EMA). It reacts quickly, which is why it is called the “fast line”.

K value calculation formula:

Today’s K Value = (Yesterday’s K Value × 2/3) + (Today’s RSV × 1/3)

The meaning of this formula is that 2/3 of today’s K value comes from yesterday’s K value, while only 1/3 comes from today’s RSV. This weighted averaging method makes the K line smoother than the RSV line and filters out some market noise. (Note: if there is no previous K value, it is usually initialized at 50.)


Step Three: Detailed Explanation of the Calculation of D Value (Slow Line)

The D value is a further smoothing of the K value and can be regarded as a moving average of the K value. It reacts more slowly than the K value and is therefore called the “slow line”.

D value calculation formula:

Today’s D Value = (Yesterday’s D Value × 2/3) + (Today’s K Value × 1/3)

Since the D value is smoothed twice, its movement is the most stable and represents the medium-term momentum direction of the market. The crossover of the K line and the D line reflects the interaction between short-term and medium-term momentum, thereby generating highly valuable trading signals.


Further Reading (Highly Recommended)

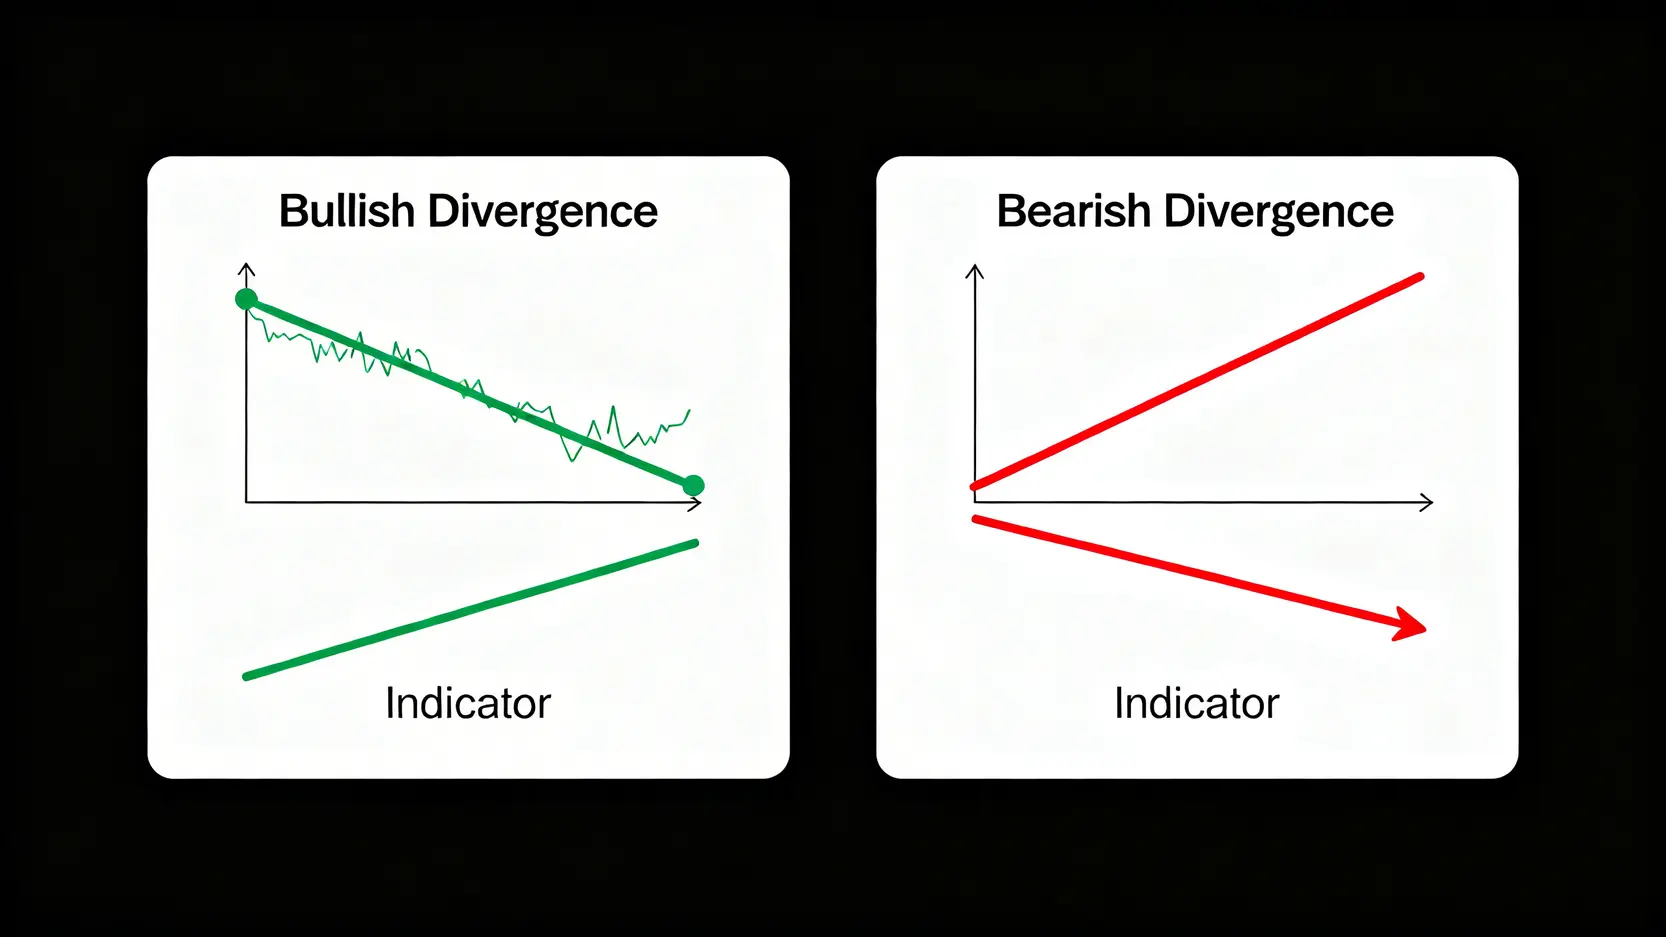
RSI Indicator Guide: Understand the Relative Strength Index, From Overbought and Oversold to Divergence in One Article …


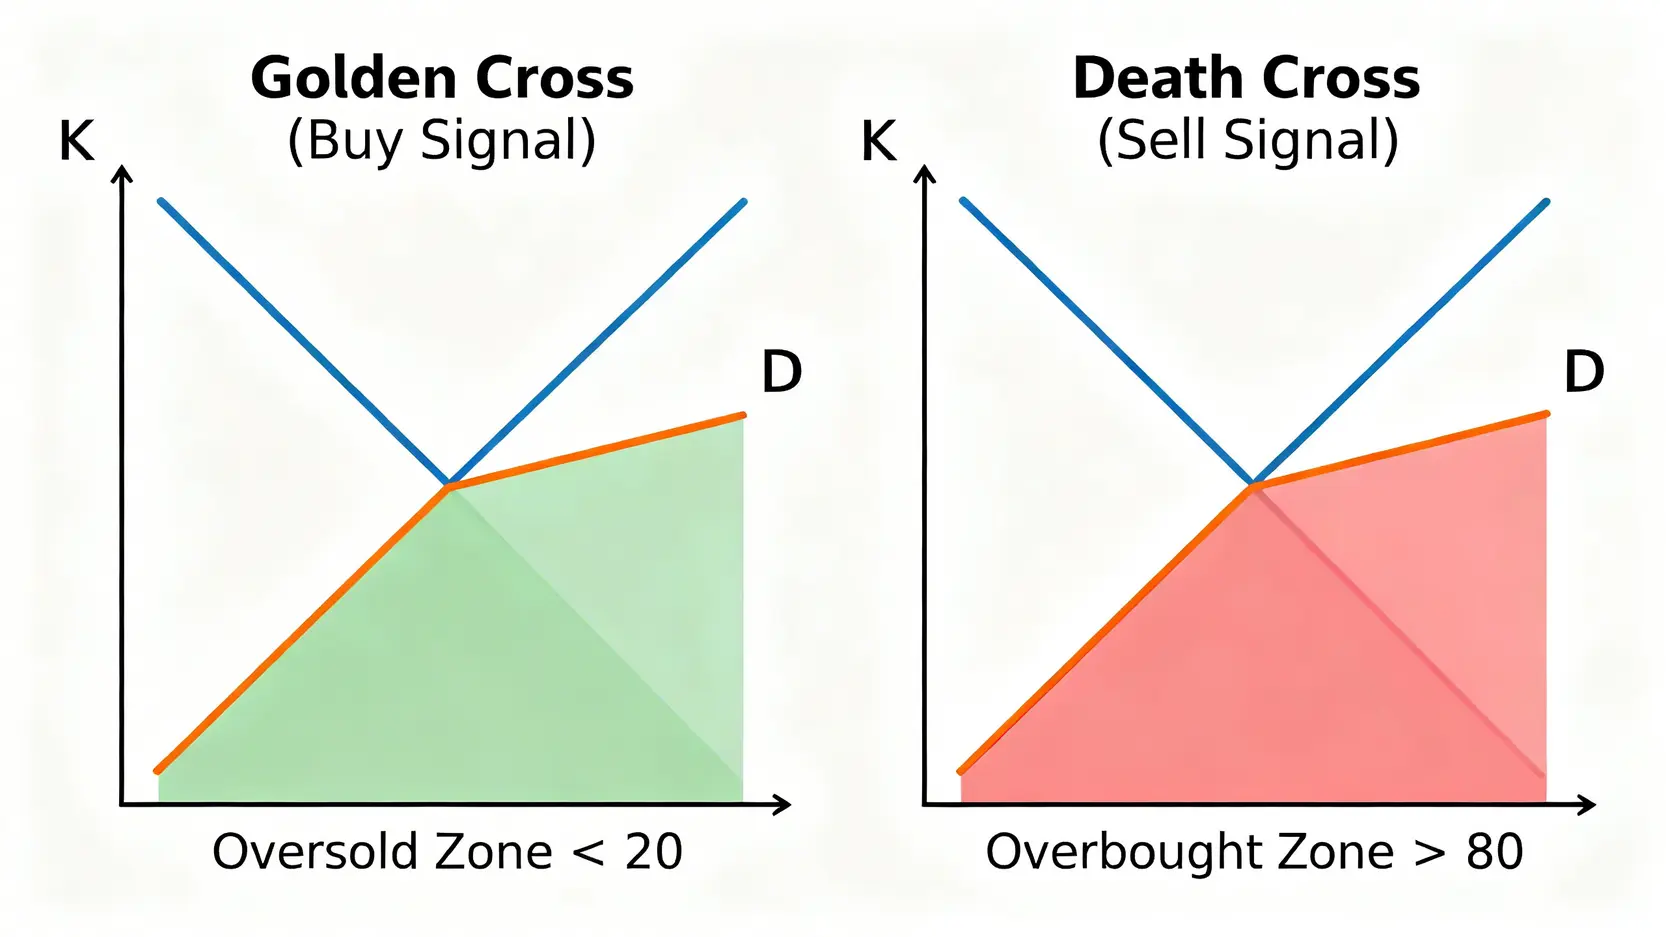
How to Use KD Value Calculations to Identify Three Key Buy and Sell Signals?

After learning how KD values are calculated, the key focus is how to apply them to interpret market signals. The practical application of the KD indicator revolves around three core concepts: golden cross, death cross, and the identification of overbought and oversold zones.

KD 指標的黃金交叉與死亡交叉對比圖,展示買入與賣出訊號的形態。

Golden Cross vs. Death Cross: Understand the Key Buy and Sell Signals of the KD Indicator at a Glance.


Buy Signal: What Is a “Golden Cross”?

A “golden cross” is the most classic buy signal in the KD indicator, usually appearing after a period of decline or consolidation. Its conditions are:

  • Position: Both K and D values are below 20, in the oversold zone.
  • Pattern: The K line (fast line) crosses above the D line (slow line) from below.

This signal indicates that short-term market momentum has shifted from weak to strong and is strong enough to reverse the medium-term momentum, often marking the beginning of a trend reversal or an upward movement.


Sell Signal: What Is a “Death Cross”?

In contrast to the golden cross, a “death cross” is a strong sell or warning signal, usually occurring after a sustained price increase.

  • Position: Both K and D values are above 80, in the overbought zone.
  • Pattern: The K line (fast line) crosses below the D line (slow line) from above.

A death cross indicates that short-term upward momentum is weakening and has begun to affect the medium-term trend, serving as a potential top reversal signal, where investors should consider reducing positions or taking profits.


Market Sentiment Indicator: Using the 80/20 Rule to Identify “Overbought” and “Oversold” Zones

In addition to crossover signals, the absolute level of KD values is itself an important indicator of market sentiment:

  • Overbought Zone: When the D value rises above 80, it indicates overheated market sentiment and that prices have risen too quickly in the short term, making a pullback likely. It is not advisable to chase prices higher, and caution is needed.
  • Oversold Zone: When the D value falls below 20, it indicates overly pessimistic market sentiment and that prices have declined too much in the short term, making a technical rebound likely. It is not advisable to sell at the bottom, and opportunities for buying may begin to emerge.

Important reminder: entering the overbought zone does not mean you should sell immediately, and entering the oversold zone does not mean you should buy immediately. In strong bullish or bearish markets, the indicator may remain in these zones for an extended period. This leads to the “stagnation” phenomenon discussed next.


Advanced Application of the KD Indicator: Avoiding Stagnation and Divergence Traps

As you begin to use the KD indicator more frequently, you will soon encounter two of the most common “traps”, stagnation and divergence. Understanding these phenomena is a key step in progressing from a beginner to an advanced trader and allows for more precise application of stochastic oscillator principles

High-Level and Low-Level Stagnation: Is the Indicator Failing or Is There More to It?

“Stagnation” refers to situations where, during extremely strong trends, the KD indicator remains in the overbought zone above 80 (high-level stagnation) or in the oversold zone below 20 (low-level stagnation) for an extended period, seemingly losing its predictive ability.

  • High-level stagnation: The D value remains above 80, commonly seen in strong trending stocks during their main upward phase. This is not an indicator of failure, but rather a sign that “the strong remain strong”. Selling simply because the indicator appears overbought may cause you to miss the largest portion of the upward move. The strategy is to wait until the K line clearly falls below 80 or a death cross appears before considering an exit.
  • Low-level stagnation: The D value remains below 20, commonly seen in weak stocks during their main downward phase. This indicates very strong bearish momentum and difficulty in reversing the trend. Buying simply because the indicator appears oversold may result in catching a falling knife. The strategy is to wait until the K line clearly rises above 20 or a golden cross appears before considering entry.


Conflict Between Price and Indicator: How to Identify “KD Divergence” and Capture Turning Points

“Divergence” is a highly effective reversal signal in technical analysis. It refers to a situation where price movement and indicator movement are inconsistent. When divergence occurs, it often signals that the current trend is weakening and may soon reverse.

KD 指標的牛市背離與熊市背離圖解,顯示價格與指標走勢的矛盾。

KD Divergence Illustration: When price and indicator trends diverge, it signals a potential turning point.

  • Bullish Divergence: The price forms a new low, but the KD indicator does not form a “new low” and instead forms higher lows. This indicates that although prices are still falling, the downward momentum is weakening, signaling a potential bottom reversal and buying opportunity.
  • Bearish Divergence: The price forms a “new high”, but the KD indicator “does not form a new high” and instead forms lower highs. This indicates that although prices are still rising, upward momentum is weakening, signaling a potential top reversal and selling opportunity.

Identifying divergence requires sharper observation, but once successfully recognized, it can help you buy at relatively low levels and sell at relatively high levels.

Frequently Asked Questions About the KD Indicator (FAQ)

Q: What does the KD indicator parameter (9,3,3) mean? Can it be adjusted?

A: The parameter (9,3,3) is the default setting in most charting software and represents:

  • 9: The highest and lowest prices over the past 9 trading days used when calculating RSV.
  • 3: The smoothing factor used when calculating the K value (corresponding to 1/3 in the formula).
  • 3: The smoothing factor used when calculating the D value (corresponding to 1/3 in the formula).

Investors can adjust these parameters according to their trading cycle. For example, short-term day traders may shorten the parameters (such as 5,3,3) to make the indicator more sensitive, while long-term swing traders may lengthen the parameters (such as 20,5,5) to pursue smoother and more stable signals and reduce unnecessary frequent trading.

Q: Is the KD indicator suitable for all types of stocks? What is the difference between short-term and long-term trading?

A: The KD indicator is most effective when stock prices are in a range-bound consolidation, as it can sensitively capture turning points at highs and lows. However, in stocks with very strong trends (such as those breaking new highs or continuously making new lows), stagnation may occur. For short-term trading, traders can strictly follow golden cross buy signals and death cross sell signals. For long-term trading, more emphasis should be placed on divergence signals, and the KD indicator should be used as a supplementary tool within a broader trend rather than the sole basis for decision-making.

Q: What is the biggest drawback of the KD indicator? Which indicators should be used together with it?

A: The biggest drawback of the KD indicator is the “stagnation” problem in strong one-sided trending markets, which may lead to selling strong stocks too early or buying weak stocks too early. Therefore, it is not recommended to use the KD indicator alone. In practice, it can be combined with trend indicators (such as moving averages (MA) and MACD) to determine the overall direction, and then use the KD indicator to identify precise entry and exit points. For example, in an uptrend (when prices are above the monthly moving average) only refer to KD golden cross buy signals and ignore death cross signals to improve the win rate. Similarly, combining it with the RSI indicator to observe divergence can provide mutual confirmation. 

Conclusion

In summary, fully understanding the KD indicator formula and the calculation of K and D values is a fundamental skill in technical analysis. This article covered the principles of the stochastic oscillator, formula breakdown, practical applications of golden cross and death cross, as well as advanced interpretations of stagnation and divergence, aiming to help you build a solid analytical foundation. Remember, no indicator is perfect. Combining the KD indicator with other analytical tools (such as trendlines and trading volume) and establishing your own trading discipline, is the key to improving your investment success rate. Open your charting software now and start practicing observing changes in the KD lines!

If you liked this article, please share it!

Related Articles

  • Volatility Surface Guide: Skew Trading Strategies
    Practical Applications of Volatility Surfaces: From Options Modeling to Advanced Skew Trading Strategies In options markets, implied volatility is never a flat line. Instead, it forms complex "smile" or "skew" surfaces. For advanced traders, mastering the practical applications of volatility surfaces is equivalent to possessing a lens that reveals market...
    2026 年 6 月 3 日
  • Foreign Capital Flow Model: Track Institutional Money
    Building a Foreign Capital Flow Copy Trading Model: A Stock Market Indicator for Accurately Tracking Institutional Positioning In Asia-Pacific stock markets, foreign capital inflows and outflows often determine the direction of the index. However, simply looking at daily net buy and sell data is no longer enough. Only by building...
    2026 年 6 月 3 日
  • Options Buying Strategies for Extreme Market Risks
    Options Buyer Strategies During Extreme Market Conditions: Black Swan Hedging and Cross-Market Arbitrage During Volatility Surges The most terrifying aspect of financial markets is not a gradual decline, but overnight flash crashes and cross-market capital withdrawals accompanied by volatility surges. In the highly unpredictable global macroeconomic environment of 2026, geopolitical...
    2026 年 6 月 3 日
返回顶部