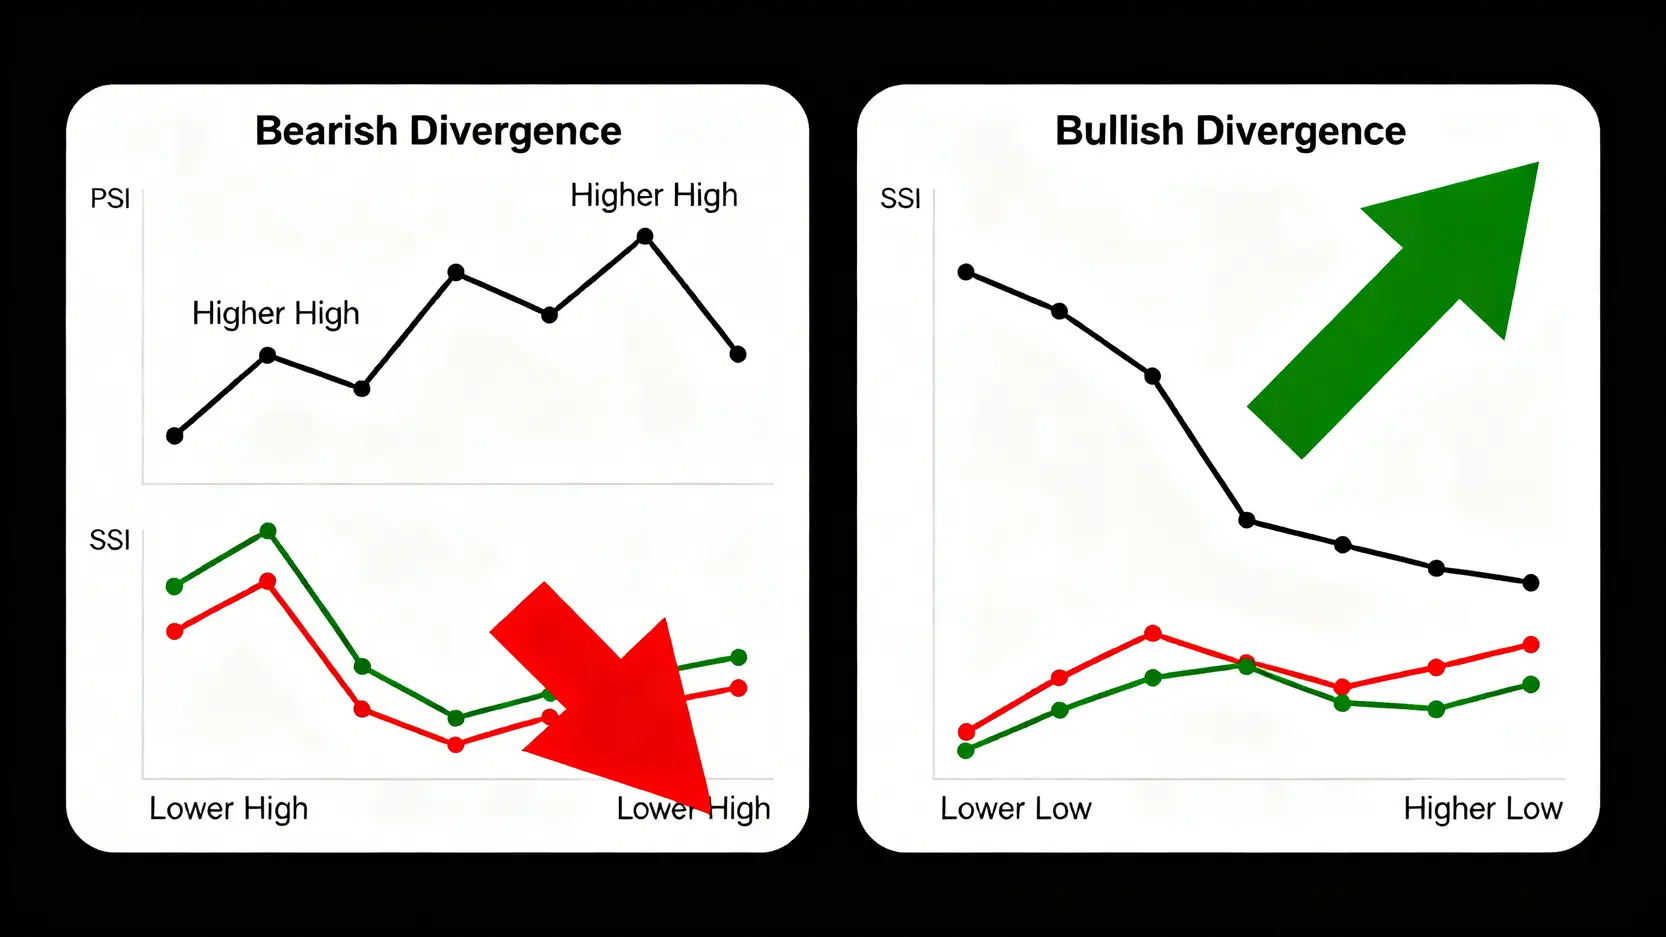
RSI Divergence Guide: Bullish & Bearish Signals

RSI Divergence Tutorial: Illustrated Guide to Bearish and Bullish Divergence Applications, Easily Capture Market Reversal Signals
In the ever-changing and unpredictable investment market, have you often struggled with missing the optimal buying and selling opportunities? When prices continue to set new highs or lows, do you find yourself unsure when the trend might reverse? If you have encountered these challenges, then “RSI divergence” is a technical indicator you must master. Like a market detection radar, it helps you anticipate potential trend changes ahead of time. Through a comprehensive RSI bearish divergence tutorial and a breakdown of RSI bullish divergence applications, this article will guide you step by step to fully master this powerful tool for forecasting market reversals, enabling you to make more precise and decisive decisions in both bull and bear markets.
What Is RSI Divergence? Why Is It a Leading Indicator for Predicting Market Reversals?
To understand RSI divergence, we must first begin with the RSI indicator itself. RSI, short for “Relative Strength Index”, is a momentum oscillator that measures the speed and magnitude of price movements to determine whether the market is in an “overbought” or “oversold” condition. “Divergence” represents a more advanced and predictive application pattern of the RSI indicator.
Basic Definition of RSI Divergence: When Price Trend and RSI Trend Become Inconsistent
Simply put, RSI divergence refers to a phenomenon where the direction of an asset’s price trend and the direction of the RSI indicator trend become “disconnected” or “out of sync”. Under normal circumstances, when prices continue to rise and set new highs, the RSI indicator should move higher in tandem. Conversely, when prices decline and set new lows, the RSI should also move lower. Once this synchronized relationship breaks, a so-called “divergence” is formed. It is like a sports car accelerating uphill. Although the speedometer (price) shows increasing speed, the engine RPM (RSI) begins to decline, often signaling that upward momentum is weakening and that a stall and slide may occur at any time.
Why Does Divergence Occur? A Deeper Understanding of Weakening Price Momentum
The core reason behind divergence lies in the exhaustion of “momentum”. Price movements are driven by the balance of power between buyers and sellers in the market.
- In an uptrend: although prices may continue to set new highs due to inertia, the underlying buying force of each advance may be weaker than before. The RSI indicator is highly sensitive to such changes in momentum and will often show signs of fatigue ahead of price, forming a “bearish divergence”.
- In a downtrend: similarly, even when prices set new lows due to market panic, the selling force may already be weakening, and buyers may quietly begin to step in. The RSI indicator will reflect this easing of selling pressure earlier, refusing to follow price to new lows, thereby forming a “bullish divergence”.
Because the RSI indicator can detect changes in momentum behind price movements, RSI divergence is considered a highly valuable “leading indicator”, providing traders with early warnings before trend reversals. To gain a deeper understanding of the RSI calculation methodology, you may refer to the authoritative explanation on TradingView.
The Two Core Forms of RSI Divergence: Bearish Divergence vs Bullish Divergence

RSI divergence is mainly divided into two basic forms: “bearish divergence”, which signals potential declines, and “bullish divergence”, which signals potential rises. Mastering the applications and identification techniques of these two forms is key to effectively using this indicator.
RSI Bearish Divergence Tutorial: A Warning Signal of a Potential Peak
RSI bearish divergence, also known as “bear divergence”, is a strong warning that the market may reverse from an uptrend to a downtrend. When it appears, it indicates that although prices are still climbing, upward momentum has already begun to weaken, and the trend may soon reverse downward.
How to Identify Bearish Divergence: Price Makes a New High, RSI Fails to Follow
The key to identifying RSI bearish divergence is clear. Focus on two consecutive highs on the chart:
- Price trend: a “Higher High” is formed, meaning the second price peak is clearly higher than the previous peak.
- RSI trend: in contrast to price, a “Lower High” is formed, meaning the RSI value corresponding to the second price peak is lower than the RSI value at the previous peak.
When both conditions are met, an upward price trendline and a downward RSI trendline create a clear contrast, forming a typical RSI bearish divergence pattern.
Practical Strategy for Bearish Divergence: When Should You Consider Reducing Positions or Selling?
When observing an RSI bearish divergence signal, you should not sell blindly. Instead, treat it as an important warning and consider the following strategies:
- Wait for confirmation signals: after bearish divergence appears, wait for the price to break below a short-term upward trendline, key support level, or for a bearish candlestick pattern (such as a dark cloud cover or bearish engulfing pattern) as confirmation.
- Reduce positions in batches: if you are holding long positions, consider partially taking profits after bearish divergence forms to lock in gains.
- Adjust take-profit levels: move take-profit levels closer so that you can exit promptly if price action does not develop as expected.
- Establish a Short Position: More aggressive traders may attempt to establish a small short position (short order) after the signal is confirmed and place the stop loss above the previous price high.
Key point: bearish divergence is a “warning”, not an “absolute command”. It signals that market risk is increasing, and you should heighten vigilance and strengthen risk management.
RSI Bullish Divergence Applications: An Opportunity for a Potential Bottom Reversal
In contrast to bearish divergence, RSI bullish divergence, also known as “bull divergence”, signals a potential reversal from a downtrend to an uptrend. It suggests that although prices continue to fall, downward momentum is nearing exhaustion, and bullish forces may be preparing to counterattack.
How to Identify Bullish Divergence: Price Makes a New Low, RSI Refuses to Follow
To identify RSI bullish divergence, observe two consecutive lows on the chart:
- Price trend: a “Lower Low” is formed, meaning the second price low is clearly lower than the previous low.
- RSI trend: moving opposite to price, a “Higher Low” is formed, meaning the RSI value corresponding to the second price low is higher than the RSI value at the previous low.
When price continues to probe lower while the RSI indicator has already stopped declining and begun to rebound, this underlying logic of “weakening selling pressure” forms the typical RSI bullish divergence pattern.
Practical Strategy for Bullish Divergence: How to Capture Potential Entry Points?
When capturing buying opportunities brought by RSI bullish divergence, patience and strategy are equally essential:
- Look for confirmation signals: wait for the price to break above a long-term downward trendline, a key resistance level, or form a bullish candlestick reversal pattern (such as a morning star or hammer).
- Build positions in batches: after confirmation appears, consider entering positions in stages rather than committing all capital at once. For example, buy the first tranche upon breaking the trendline, and add to the position if the trendline is successfully retested without breaking.
- Set stop-loss orders: place the stop-loss below the previous price low to guard against divergence failure and continued price decline.
- Combine with RSI levels: if bullish divergence occurs in the RSI oversold zone (for example below 30), its reliability is generally higher.
Further Reading (Highly Recommended)
[Special Attention] RSI Divergence Traps in Bull Markets and Counterstrategies
Although RSI divergence is a powerful tool, under certain market conditions, especially in strong bull market environments, it may generate misleading signals and lead traders to serious mistakes. Understanding its limitations and counterstrategies is crucial.
Why Does the RSI Indicator Become “Overextended” in a Bull Market?
In a sustained and strong one-sided bull market, prices rise steadily and buying pressure remains continuous. In such cases, the RSI indicator may stay in the “overbought zone”, (usually above 70) for an extended period, even reaching levels of 80 or 90. This phenomenon is known as “indicator overextension”.
Because RSI calculations incorporate price changes over a given period, when the market continues to rise, the indicator naturally remains at elevated levels and loses its normal oscillation range. In such circumstances, even if short-term bearish divergence appears, it may simply reflect a temporary pullback or consolidation within an ongoing uptrend rather than the end of the trend.
Potential Risks of RSI Divergence in a Bull Market: The Lesson of Selling Too Early
One of the biggest lessons in a bull market is “selling too early”. If traders exit their positions immediately upon seeing an RSI bearish divergence signal, they may miss out on a larger subsequent rally. After a brief pullback and short pause, price may resume a strong upward surge and continue to set new highs, leaving those who exited prematurely behind. This is the most common “false signal” or trap of RSI divergence in a bull market.

Bull Market Strategy: How to Improve Accuracy by Combining Trendlines or Other Indicators
To avoid being misled by RSI divergence in a bull market, it is necessary to combine other analytical tools for comprehensive judgment to enhance decision accuracy:
- Combine with trendline analysis: In a bull market, a solid upward technical analysis trendline is your best ally. As long as price continues to trade above the trendline, even if RSI bearish divergence appears, it should be regarded as a deceleration signal rather than a reversal signal. Only when price clearly breaks below the upward trendline should selling be considered.
- Refer to other indicators: For example, combine with a Moving Average system. Before price breaks below the 20-day or 50-day moving average, a bullish bias should generally be maintained.
- Observe higher timeframes: If bearish divergence appears on the daily chart, switch to the weekly or monthly chart for confirmation. If the broader trend on higher timeframes remains strong, the daily divergence may merely represent minor fluctuations.
- Adjust RSI parameters: In a one-sided market, consider extending the RSI period parameter (such as adjusting it from 14 to 21 or 25) to filter out short-term noise, smooth the indicator, and reduce overextension effects.
Three Practical Techniques to Improve RSI Divergence Win Rate
To master RSI divergence, beyond understanding its basic definitions and patterns, practical techniques are required to filter signals, improve win rate, and control risk. The following three techniques are indispensable in real trading.
Technique One: Observe Multiple Divergences to Strengthen Signal Reliability
A single divergence signal may only reflect temporary hesitation in the market. However, if divergence appears twice or even three times consecutively, known as “double divergence” or “triple divergence”, the reliability of the signal increases significantly.
- Double bearish divergence: price sets three consecutive new highs (labeled A, B, and C), each higher than the previous one, while the corresponding RSI indicator forms three consecutive lower highs. This indicates that upward momentum has repeatedly weakened, greatly increasing the probability of a subsequent decline.
- Double bullish divergence: conversely, price sets three consecutive new lows, while the RSI indicator forms three progressively higher lows. This is a strong signal that the market has completed its bottom formation and may soon experience a strong rebound.
When multiple divergence patterns appear, they deserve serious attention, as they often precede major market turning points.
Technique Two: Combine Volume Analysis to Confirm Momentum Shifts
Trading volume directly reflects market momentum. Combining RSI divergence with volume analysis allows mutual confirmation and helps filter out false signals.
- Bearish divergence plus price-volume divergence: when price sets a new high but trading volume fails to expand and instead contracts, this “price-volume divergence” confirms the momentum exhaustion revealed by RSI bearish divergence. A price rise without volume support signals potential downside risk.
- Bullish divergence plus declining volume on new lows: when price sets a new low and volume contracts to extremely low levels, known as “extreme low volume”, it suggests that selling pressure has largely been exhausted. If RSI bullish divergence appears at this time, it indicates that downward momentum is depleted and that even modest buying pressure may trigger a rebound.
Technique Three: Set Reasonable Stop-Loss Levels to Control Potential Risk
“The only certainty in the market is uncertainty.” No technical indicator, including RSI divergence, is a 100 percent accurate holy grail. Therefore, strict risk management is the foundation of trading success.
- After executing a buy operation: when entering based on an RSI bullish divergence signal, immediately place a stop-loss below the most recent price low. If price fails to rebound and instead breaks below this key low, the divergence signal has failed and you should decisively exit.
- After executing a sell operation: when selling or establishing a short position based on an RSI bearish divergence signal, place a stop-loss above the most recent price high. If price rises instead of falls and breaks above the previous high, it confirms continued market strength and stop-loss should be executed promptly.
Setting stop-loss orders not only protects your capital but also enables you to remain calm when your judgment is wrong, preventing a single mistake from causing substantial losses.
Frequently Asked Questions About RSI Divergence (FAQ)
Q: What RSI parameter setting should be used for divergence analysis, (for example 9, 14, or 25)?
A: The most common default parameter for the RSI indicator is 14, which was originally recommended by its creator J. Welles Wilder Jr., and is suitable for most markets and timeframes. However, the parameter can be adjusted according to individual trading styles:
- Short period (such as 9): the indicator responds more sensitively and can capture more short-term fluctuations and divergence signals, but it will also generate more false signals or noise. Suitable for short-term traders.
- Long period (such as 25): the indicator becomes smoother, filters out more short-term market noise, and produces fewer divergence signals, but when signals do appear, they are usually more reliable. Suitable for long-term trend traders.
In general, beginners are advised to start with the standard 14 period, become familiar with its characteristics, and then fine-tune it according to their own strategy.
Q: After an RSI divergence signal appears, will the price definitely reverse immediately?
A: Not necessarily. RSI divergence is a “leading indicator”, meaning it signals that a trend “may” be about to reverse, but it does not guarantee that the reversal will occur “immediately”, nor that it will “definitely” occur. After a divergence signal appears, price may continue moving along the original trend for some time, and may even form multiple divergences before a true reversal takes place. Therefore, it is more prudent to treat divergence as a strong “warning” or “opportunity” signal and patiently wait for price action confirmation (such as a trendline breakout).
Q: Besides RSI, which other technical indicators can be used together with divergence?
A: Yes, combining multiple indicators can improve the accuracy of analysis. In addition to RSI, other oscillators that exhibit divergence characteristics are also worth monitoring, such as:
- MACD (Moving Average Convergence Divergence): divergence in the MACD (histogram) is another highly popular and reliable divergence signal.
- Stochastic Oscillator, KDJ: the KDJ indicator can also display divergence patterns and is particularly sensitive in identifying short-term overbought and oversold conditions.
- Momentum indicator: directly reflects changes in price momentum, and its divergence signals are also valuable for reference.
When multiple indicators of different types simultaneously display divergence signals, the probability of a market reversal increases significantly.
Conclusion
In summary, RSI divergence is an indispensable tool in every technical trader’s arsenal. By skillfully applying the RSI bearish divergence tutorial and RSI bullish divergence techniques detailed in this article, you will be able to detect subtle shifts in market sentiment more keenly and capture potential trend turning points. Always remember that no single indicator is infallible. Especially in strong bull market conditions, the risk of indicator overextension objectively exists. Only by flexibly combining RSI divergence with trendlines, trading volume, and other analytical tools, while consistently prioritizing risk management, can its full potential be realized and elevate the quality of your trading decisions to a new level.
Related Articles
-
Practical Applications of Volatility Surfaces: From Options Modeling to Advanced Skew Trading Strategies In options markets, implied volatility is never a flat line. Instead, it forms complex "smile" or "skew" surfaces. For advanced traders, mastering the practical applications of volatility surfaces is equivalent to possessing a lens that reveals market...2026 年 6 月 3 日
-
Building a Foreign Capital Flow Copy Trading Model: A Stock Market Indicator for Accurately Tracking Institutional Positioning In Asia-Pacific stock markets, foreign capital inflows and outflows often determine the direction of the index. However, simply looking at daily net buy and sell data is no longer enough. Only by building...2026 年 6 月 3 日
-
Options Buyer Strategies During Extreme Market Conditions: Black Swan Hedging and Cross-Market Arbitrage During Volatility Surges The most terrifying aspect of financial markets is not a gradual decline, but overnight flash crashes and cross-market capital withdrawals accompanied by volatility surges. In the highly unpredictable global macroeconomic environment of 2026, geopolitical...2026 年 6 月 3 日


