How to Draw Trendlines 2026: 4 Steps for Beginners

Updated: 2026/02/27  |  CashbackIsland

趨勢線怎麼畫?從零學會判斷上升與下降趨勢的4大步驟

How to Draw Trendlines? Four Key Steps to Learn How to Identify Uptrends and Downtrends From Scratch

Do you often feel confused when investing, unsure whether the market is currently bullish or bearish? Many people trade based on gut feeling and end up with losses. In fact, simply learning “how to draw trendlines” can lay a solid foundation for your technical analysis. Correct trend identification is the cornerstone of trend-following trading and helps you clearly distinguish between uptrends and downtrends. This article starts from zero and guides you through the core techniques of drawing trendlines, while also explaining how to respond to different trend cycles, so your investment decisions are more grounded and no longer driven by blind following. 


What Is a Trendline? A Fundamental Lesson in Technical Analysis

In the broad world of technical analysis, the trendline is one of the most basic yet most essential tools. It is a straight line drawn on a chart to connect a series of highs or lows in price movement, with the purpose of clearly indicating the direction in which the market is moving. Simply put, a trendline visualizes the market’s “trend”, allowing traders to instantly see whether prices are rising, falling, or moving sideways.


Why Is Trend Identification So Important for Investing?

As the saying goes, “The trend is your friend”. This phrase perfectly captures the importance of trend identification in investing. If you can accurately determine that the market is in an uptrend, then trading in the direction of the trend by going long (buying) naturally has a higher probability of success. Conversely, going long against a downtrend is like stopping a chariot with a mantis. Trend identification helps you to:

  • Filter out market noise: Ignore short-term price fluctuations and focus on the primary direction.
  • Find appropriate entry and exit points: Buy on pullbacks in an uptrend, or sell on rebounds in a downtrend.
  • Set stop-loss levels: When price breaks below an ascending trendline, it may signal a trend reversal and provide a clear exit signal.


The Two Core Functions of Trendlines: Support and Resistance

The reason trendlines are so practical lies in the two key roles they play:

  • Support: In an uptrend, the line drawn by connecting successive swing lows is called an “ascending trendline”. This line represents an area where buying pressure is concentrated. When price pulls back toward this line, it often finds support and rises again. It acts like the “floor” when prices fall.
  • Resistance: In a downtrend, the line drawn by connecting successive swing highs is called a “descending trendline”. This line represents an area where selling pressure is strong. When price rebounds toward this line, it often encounters resistance and falls again. It acts like the “ceiling” when prices rise.

一張對比圖,左側為上升趨勢線作為支撐,右側為下降趨勢線作為壓力。

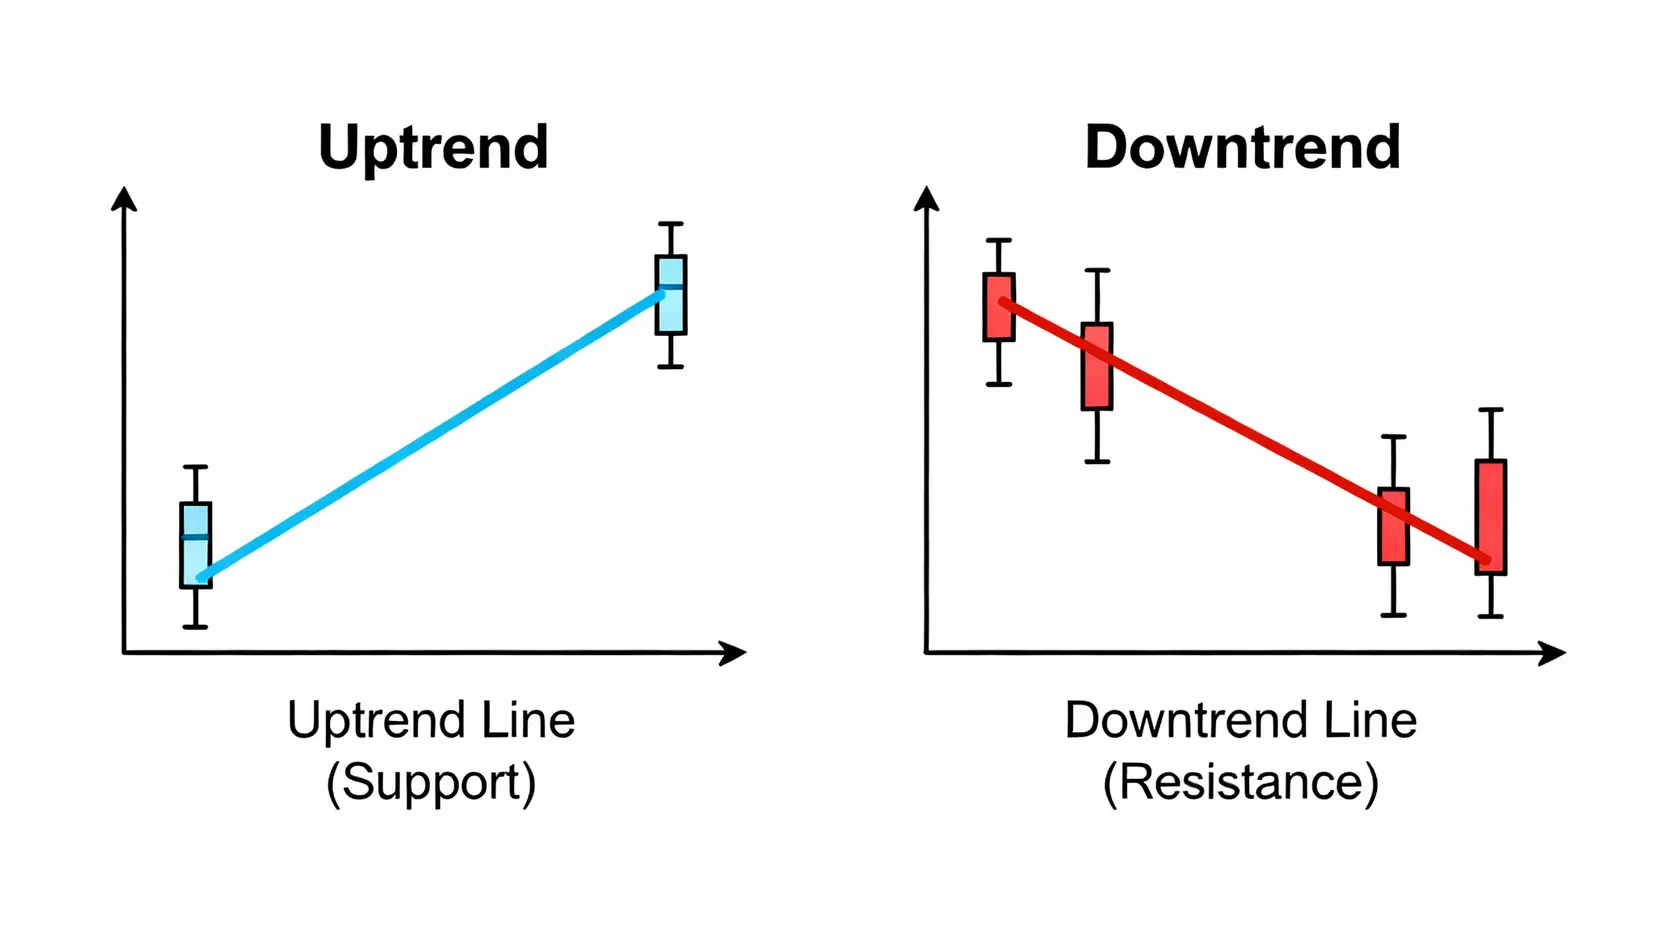
Illustration: Ascending trendlines provide support (like a floor), while descending trendlines form resistance (like a ceiling).

Understanding the concepts of support and resistance is the first step in learning how to use trendlines for trading decisions. According to technical analysis articles from the authoritative Investopedia financial website, trendlines are among the most intuitive tools for identifying these key price levels. 

How to Draw Trendlines? A Three-Step Tutorial Beginners Can Master

After understanding the importance of trendlines, the next step is hands-on practice. Many people feel that drawing trendlines is subjective, but in fact, by following a few basic steps, you can draw effective and objective trendlines. We will teach the most common method, allowing you to easily grasp the essence of how to draw trendlines.


Step 1: Identify at Least Two Key Highs or Lows

The first step in drawing a trendline is to identify clear turning points on the price chart. These points are called “pivot points” or key highs/lows.

  • To draw an ascending trendline, you need to find at least two “consecutive and increasingly higher” lows (higher lows).
  • To draw a descending trendline, you need to find at least two “consecutive and increasingly lower” highs (lower highs).

Key Tip: The more widely recognized the selected points are as turning points (such as the starting point of a major rally or sell-off), the more effective the resulting trendline will be.


Step 2: Draw an Ascending Trendline (Connect the Lows)

Once you have identified two or more key lows on the chart, use a drawing tool to connect the two points with a straight line and extend it upward to the right. This forms an initial ascending trendline.

For a valid ascending trendline, price should remain above the line most of the time. Each time price pulls back and touches the line, it represents a potential buying opportunity, because the line acts as “dynamic support”.


Step 3: Draw a Descending Trendline (Connect the Highs)

Similarly, if you have identified two or more key highs, connect them with a straight line and extend it downward to the right. This forms a descending trendline.

In a downtrend, price stays below this line. Each time price rebounds and touches the trendline, it may be capped and fall back. This is a potential sell or short opportunity, as the line acts as “dynamic resistance”.


Practical Tip: How to Adjust and Validate the Effectiveness of a Trendline?

Drawing a trendline is only the first step. More importantly, you need to validate its effectiveness. The more times a trendline is touched, and the more consistently price rebounds or pulls back as expected after each touch, the higher the reliability of the trendline.

  • Third-Point Confirmation: A line drawn with two points is usually provisional. When price returns to the line for a third time and reacts as expected, the trendline’s validity is initially confirmed.
  • Adjust When Needed: Markets are not always perfect. Sometimes price may briefly “pierce” the trendline and then quickly move back. In such cases, you may need to slightly adjust the trendline’s angle to include more price action, making it more representative.
  • Avoid Overly Steep Angles: Trendlines with slopes that are too steep (such as greater than 45 degrees), are usually difficult to sustain and are easily broken. Their reference value is relatively low.

一張教學圖,展示如何畫上升趨勢線(連接兩個遞增的低點)與下降趨勢線(連接兩個遞減的高點)。

The Core Steps of Drawing Trendlines: Identify key turning points and connect them.


How to Use Trendlines to Determine Bullish and Bearish Market Direction?

After learning how to draw trendlines, the next focus is how to interpret and apply them. The most fundamental purpose of a trendline is to help traders make clear trend judgments and develop corresponding strategies, determining whether the market is bullish (upward) or bearish (downward). 

Characteristics and Trading Strategies of an Uptrend

When an asset’s price moves above a valid ascending trendline, it is referred to as a “bull market” or an uptrend. Its main characteristics are “higher highs” and “higher lows”.

  • Characteristics: Price moves upward like climbing stairs, step by step. Each pullback low does not fall below the previous low.
  • Trading Strategy: The primary strategy is “buy on dips”. When price pulls back from a high and approaches or touches the ascending trendline, it represents a potential long entry opportunity. Short selling against the trend should be avoided in this type of market.
  • Stop-Loss Setting: A stop-loss can be placed a certain distance below the ascending trendline. If price clearly breaks below the trendline, it indicates that the trend may be reversing and an exit should be considered.


Characteristics and Trading Strategies of a Downtrend

Conversely, when price moves below a descending trendline, it is considered a “bear market” or a downtrend. Its characteristics are “lower lows” and “lower highs”.

  • Characteristics: Price movement resembles sliding down a slide, with each move lower than the last. Every rebound high fails to break above the previous high.
  • Trading Strategy: The primary strategy is “sell on rallies” or “short selling”. When price rebounds from a low and approaches or touches the descending trendline, it is a potential opportunity to exit or establish a short position.
  • Stop-Loss Setting: For short positions, the stop-loss can be placed above the descending trendline. If price decisively breaks above the trendline, it indicates that the bearish trend may be ending.


What Does a Trendline Break (Breakdown or Breakout) Represent?

A trendline cannot last forever. When price eventually crosses a trendline, it is a very important market signal known as a “trendline break”.

  • Breakdown of an Ascending Trendline: This is a potential trend reversal signal, suggesting that the uptrend may be pausing or ending, and the market may shift into consolidation or decline. Trading volume often expands at this point to confirm the validity of the break.
  • Breakout of a Descending Trendline: This is also a potential trend reversal signal, indicating that selling pressure is weakening and buyers are beginning to take control, which may lead to an upward move.

Note: Not all breaks are valid. “False breakouts” occur frequently, where price briefly crosses the trendline and then returns to the original trend. Therefore, many traders use the “closing price” as a confirmation standard. For example, only when a daily candlestick closes outside the trendline is it considered a valid break.


Advanced Application: Understanding Different Trend Cycles

When performing trend cycle analysis, you will find that trends are nested within trends. This is similar to Russian nesting dolls, where a major trend contains medium-term trends, and medium-term trends contain smaller trends. Understanding trends across different timeframes allows for a more comprehensive analysis and helps avoid missing the forest for the trees.


Differences Between Short-Term, Medium-Term, and Long-Term Trend Cycles

According to Dow Theory, trends can be divided into three main types, which differ in their time duration and impact on the market:

Trend Cycle Time Duration Description Chart Example
Long-Term Trend (Primary Trend) More Than 1 Year

Represents the most fundamental long-term direction of the market, such as a bull or bear market lasting several years.

Monthly Charts, Weekly Charts
Medium-Term Trend (Secondary Trend)

3 Weeks to Several Months

Represents a correction or pullback within the long-term trend, for example, a multi-month corrective phase during a long-term bull market. Daily Charts
Short-Term Trend (Minor Trend) Several Days to 3 Weeks Represents small fluctuations within a medium-term trend and is easily influenced by market news and sentiment changes. 4-Hour Charts, 1-Hour Charts

一張概念圖,展示長期趨勢中嵌套著中期趨勢,中期趨勢中又包含短期趨勢的層級關係。

Trend Cycle Illustration: A long-term trend (primary direction) is composed of several medium-term trends (corrective waves), and medium-term trends are in turn composed of short-term fluctuations.


How to Apply Trendlines Across Different Timeframes?

Smart traders observe trendlines across multiple timeframes at the same time to gain a more three-dimensional view of the market.

  • Strategy: Trade in the direction of the long-term trend, look for pullbacks in the medium-term trend, and use turning points in the short-term trend as entry signals.
  • Example: Assume the weekly chart (long term) shows a clear ascending trendline. When the price on the daily chart (medium term) pulls back to its medium-term ascending trendline, you can switch to the hourly chart (short term) and wait for the short-term descending trendline to be broken before entering a long position. This “long-term trend guiding short-term entries” strategy can significantly improve the trading win rate and the risk-reward ratio.


Frequently Asked Questions About Trendlines (FAQ)

Q: How Many Points Are Needed to Draw a Trendline?

A: In theory, two points are enough to form a line. Therefore, drawing a trendline requires at least two key highs (for a descending trendline) or two key lows (for an ascending trendline). However, the validity of a trendline requires confirmation by a third point. The more times a trendline is touched, the stronger its representativeness.

Q: Does the Angle (Slope) of a Trendline Have Special Significance?

A: Yes. The slope of a trendline reflects the strength of the trend. A steeper slope indicates a faster and more aggressive trend, but it is usually less stable and harder to sustain. In contrast, a more moderate slope (such as around 30 to 45 degrees), typically represents a healthier and more sustainable trend.

Q: If Price Briefly Breaks Below an Ascending Trendline, Does the Trend End?

A: Not necessarily. This may be a so-called “false breakdown” or “noise”. Determining whether a trend has truly ended requires confirmation from other signals. For example, observe whether the closing price actually settles below the trendline, whether the break is accompanied by increased trading volume, and whether subsequent prices fail to make new highs. In some cases, price may break the line and then form a new, more gradual trendline.

Q: What Is the Difference Between Trendlines and Moving Averages (Moving Average)?

A: Both are tools used to identify trends, but their principles differ. Trendlines are drawn manually by connecting key price highs and lows. They are more subjective but provide more direct feedback. Moving averages are calculated automatically based on average closing prices over a past period. They are more objective but respond more slowly. Many traders use both together to cross-validate trend signals.


Conclusion

In summary, learning how to draw trendlines is a fundamental skill every investor should possess. It not only helps you clearly identify trends, but also enables you to effectively distinguish between uptrends and downtrends. Through the step-by-step instruction and practical techniques in this article, you should now have a solid grasp of how to draw and apply trendlines. Remember, a trendline is a powerful supporting tool, but it is not all-powerful. Incorporate it into your analytical framework, observe it across different trend cycles, and combine it with other indicators such as trading volume for a comprehensive assessment. Only then can you make more informed decisions in complex financial markets. Open your charting software now and start practicing drawing your first trendline!

If you liked this article, please share it!

Related Articles

  • Volatility Surface Guide: Skew Trading Strategies
    Practical Applications of Volatility Surfaces: From Options Modeling to Advanced Skew Trading Strategies In options markets, implied volatility is never a flat line. Instead, it forms complex "smile" or "skew" surfaces. For advanced traders, mastering the practical applications of volatility surfaces is equivalent to possessing a lens that reveals market...
    2026 年 6 月 3 日
  • Foreign Capital Flow Model: Track Institutional Money
    Building a Foreign Capital Flow Copy Trading Model: A Stock Market Indicator for Accurately Tracking Institutional Positioning In Asia-Pacific stock markets, foreign capital inflows and outflows often determine the direction of the index. However, simply looking at daily net buy and sell data is no longer enough. Only by building...
    2026 年 6 月 3 日
  • Options Buying Strategies for Extreme Market Risks
    Options Buyer Strategies During Extreme Market Conditions: Black Swan Hedging and Cross-Market Arbitrage During Volatility Surges The most terrifying aspect of financial markets is not a gradual decline, but overnight flash crashes and cross-market capital withdrawals accompanied by volatility surges. In the highly unpredictable global macroeconomic environment of 2026, geopolitical...
    2026 年 6 月 3 日
返回顶部