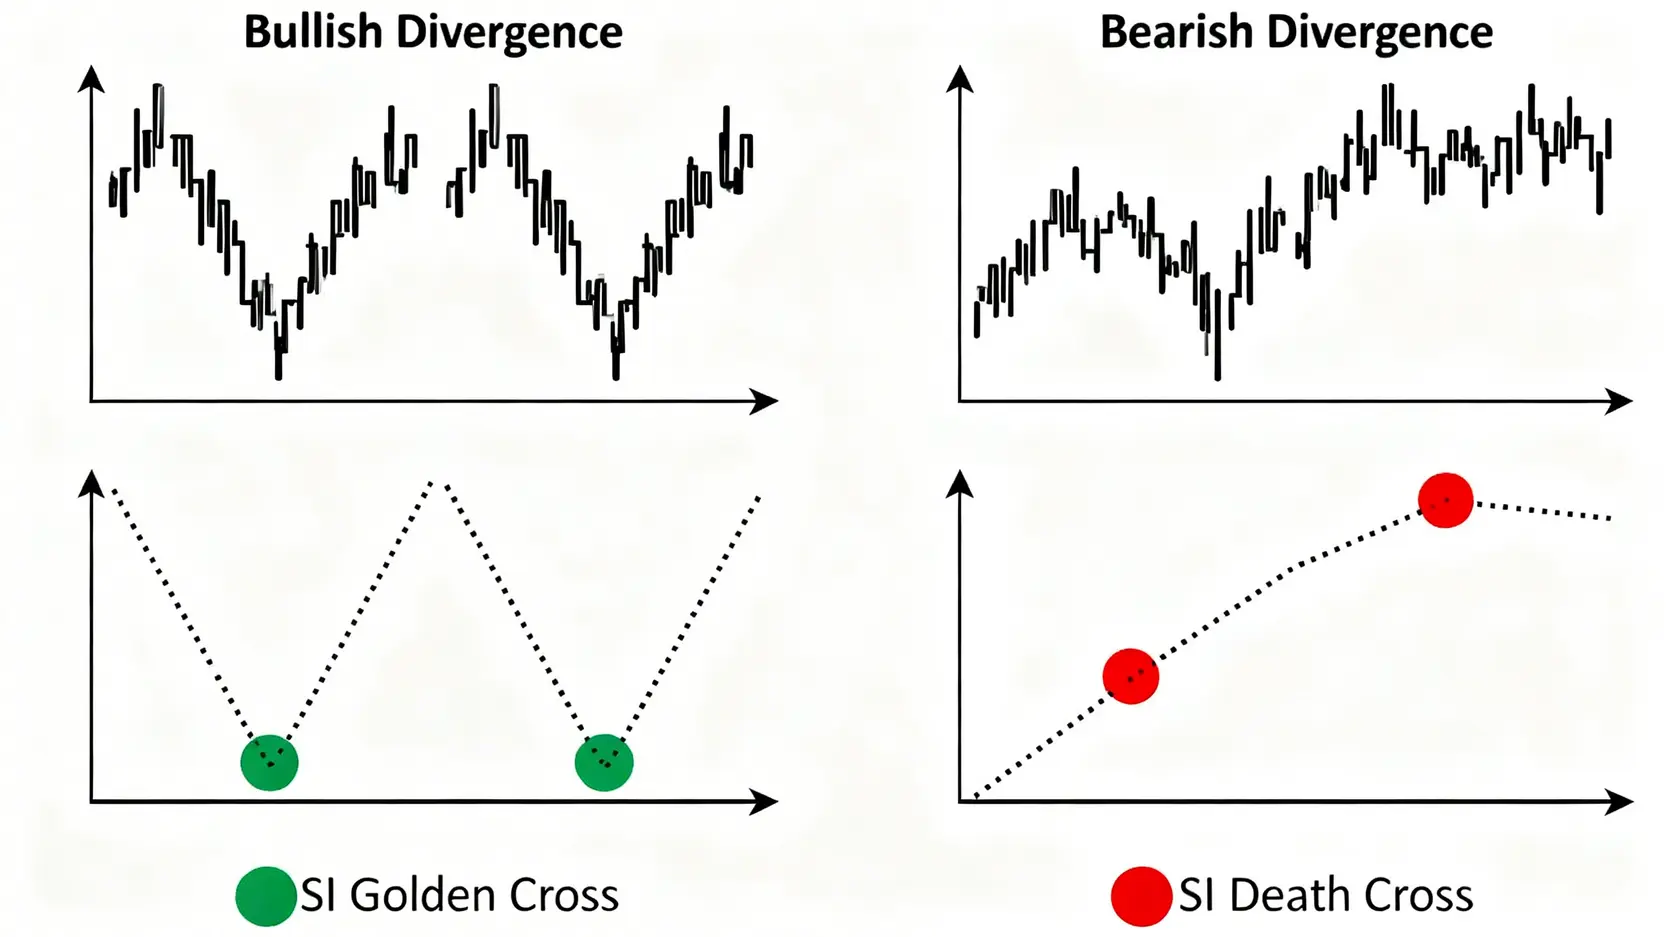
RSI Golden Cross & Death Cross Trading Guide

How to Interpret RSI Golden Cross and Death Cross? A Complete Guide to RSI Usage, Parameter Settings, and Practical Trading Strategies
In the vast ocean of technical analysis, the RSI indicator is undoubtedly an important beacon for identifying market overbought and oversold conditions. But do you truly understand the powerful signals known as the “RSI Golden Cross” and the “RSI Death Cross”? Many investors miss out on substantial profits because they overlook or misjudge these critical crossover points. To master precise entry and exit timing, understanding how to use the RSI Golden Cross is essential. This article will start from the basics and, through detailed illustrations and practical examples, guide you deep into the mechanics of RSI crossovers. It will show you how to set key parameters, identify genuine and false signals, and ensure that you no longer miss the clear signals the market provides.
RSI Indicator Basics: The Foundation of Golden Cross and Death Cross
Before exploring RSI Golden Cross and Death Cross in depth, it is necessary to establish a solid foundation. Understanding the nature of the RSI indicator and the logic behind its parameter settings is the cornerstone of successfully applying crossover strategies.
What Is RSI (Relative Strength Index)?
RSI, short for “Relative Strength Index”, is a momentum oscillator created by the technical analysis pioneer J. Welles Wilder Jr. Its core function is to measure the relative strength of upward price momentum versus downward price momentum within a specific time period. The RSI value is constrained between 0 and 100, allowing traders to quickly assess market sentiment and potential turning points.
- Overbought Zone: Generally, when the RSI value exceeds 70, the market may be considered overbought. This indicates that upward momentum may be slowing and the risk of a pullback or consolidation is increasing.
- Oversold Zone: When the RSI value falls below 30, the market may be considered oversold. This suggests that downward momentum is weakening and a rebound or trend reversal may occur.
In simple terms, RSI functions like a thermometer of market sentiment, helping us quantify current buying and selling pressure. However, relying solely on overbought and oversold zones for trading carries higher risk, which is why learning more advanced crossover strategies is necessary.
Key Parameter Settings: How to Choose Short and Long Period RSI?
The core of the RSI Golden Cross and Death Cross strategy lies in using two RSI lines with different periods simultaneously: a short period line and a long period line. By observing their crossover behavior, trading signals can be generated.
- Short Period RSI: This reacts more sensitively and can quickly capture recent price changes. Common parameter settings include 5-day, 6-day, or 9-day. Its advantage is earlier signals, but the drawback is that it may produce more noise or false signals.
- Long Period RSI: This reacts more smoothly and reflects medium to long-term trend strength. Common parameters include 12-day, 14-day, or 21-day. Its advantage is greater signal stability and the ability to filter out some short-term fluctuations, but signals tend to appear later.
How should you choose? There is no absolute standard answer. It depends entirely on your trading style and the characteristics of the instrument you trade:
- Short-term or intraday traders: May prefer shorter period combinations such as (5, 10) or (6, 12) in order to capture entry opportunities earlier.
- Swing or long-term traders: May choose longer combinations such as (10, 20) or (14, 28) to focus on more significant trend movements.
Beginners are advised to start with classic combinations such as (6, 12) or (7, 14) for testing, then fine-tune them based on backtesting results and personal trading habits to find the “golden pair” that suits them best.
RSI Golden Cross Usage: Capturing Clear Buy Signals
Once you have set up the two RSI lines, you can begin looking for the most anticipated buy signal: the RSI Golden Cross. The appearance of this signal often indicates that bullish market momentum is gathering and a potential upward move may be approaching.
Definition and Illustration: When Short-Term RSI Breaks Above Long-Term RSI
The definition of an “RSI Golden Cross” is very clear: when the short period RSI line rises from below and strongly crosses above the long period RSI line, a golden crossover is formed.
The meaning behind this crossover is that recent upward momentum (represented by the short-term RSI) has exceeded the average upward momentum of the past period, (represented by the long-term RSI). This is a positive signal that market sentiment is shifting from weak to strong and that buying pressure is beginning to dominate.

Practical Strategy: How to Use RSI Golden Cross to Formulate an Entry Plan
Should you immediately enter the market as soon as you see a golden cross? Not so fast. A mature trader will create a more comprehensive entry plan:
- Signal Confirmation: Wait for the candlestick where the golden cross occurs to close for confirmation. Do not act hastily when the signal first appears during the trading session, because it may disappear before the close.
- Location Filtering: Observe where the crossover occurs. If the golden cross appears near the RSI 30 oversold zone, its reliability increases significantly. This suggests the market has experienced an oversold phase and strong buying interest is entering, potentially indicating a bottom reversal signal. Conversely, if the crossover occurs above the 70 overbought zone, caution is required. It may simply represent a temporary acceleration within an uptrend, and chasing the price carries higher risk.
- Trend Alignment: Trading with the trend is key to improving success rates. In a clear uptrend (for example when the price is above major moving averages), an RSI Golden Cross can be an excellent opportunity to add positions or buy on a pullback. A golden cross appearing during a downtrend may only represent a temporary rebound, and trading should therefore be more conservative.
Important Considerations: How to Filter False RSI Golden Cross Signals?
No indicator is 100 percent accurate. Especially in ranging markets, short and long RSI lines may frequently intertwine and generate numerous ineffective crossover signals, a phenomenon known as “indicator whipsaw”. To filter out these false signals, consider the following techniques:
- Angle Observation: In a strong and effective golden cross, the short-term RSI typically breaks above the long-term RSI at a relatively steep angle. If the two lines cross almost horizontally and closely together, the signal strength is relatively weak.
- Combine With Trading Volume: If the golden cross occurs alongside a significant increase in trading volume, it indicates that substantial capital is entering the market to support the upward movement, greatly increasing the reliability of the signal.
- Reference Other Indicators: Cross-verifying RSI Golden Cross signals with buy signals from other indicators (such as MACD or KD), is a common method used by professional traders. This will be discussed in greater detail in later sections.
RSI Death Cross Usage: Identifying Potential Sell Warnings
After learning how to capture buying opportunities, it is equally important to understand how to avoid risk. The RSI Death Cross is an important warning signal issued by the market, indicating that bullish momentum may be weakening and that it may be time to consider taking profits or setting defensive exit levels.
Definition and Illustration: When the Short-Term RSI Breaks Below the Long-Term RSI
Opposite to the golden cross, the definition of an “RSI Death Cross” is: when the short period RSI line moves from above to below and breaks beneath the long period RSI line, a death cross is formed.
The market implication of this signal is that recent downward momentum has begun to overpower upward momentum. Market sentiment shifts from strong to weak, and selling pressure gradually takes control. This is a warning signal of a potential trend reversal or a deeper pullback.

Risk Management: Using RSI Death Cross to Set Take Profit or Stop Loss Levels
The RSI Death Cross plays a crucial role in risk management. When you hold long positions and observe a death cross, you should immediately become more cautious:
- Take Profit: If your position already has considerable profit, the appearance of a death cross is a clear stage-based sell signal. You may consider closing part of the position in batches to lock in some profits.
- Set a Trailing Stop: If you believe the trend has not fully ended, you can move your stop loss upward to near the low of the candlestick where the death cross occurred. If the price continues to decline and triggers the stop loss, you can still preserve most of your profits.
- Reference for Short Entry: For traders with short selling experience, a death cross that appears within a downtrend, especially when the crossover occurs near the RSI 70 overbought zone, can be regarded as a potential short entry opportunity.
Remember that a death cross is a “warning”, not a “final declaration”. It reminds us that risk is increasing and defensive measures should be taken, rather than triggering blind panic selling.
Advanced RSI Techniques: Combining Other Signals to Improve Accuracy
Using the RSI crossover strategy alone can be effective, but combining it with other technical analysis tools can build a stronger and more stable trading system. This is similar to a detective solving a case. A single clue may lead in the wrong direction, but multiple pieces of evidence cross-checked together can bring you closer to the truth.
How to Combine RSI Divergence Signals to Confirm Trend Reversal?
RSI divergence is one of the most powerful signals within the RSI indicator. It can signal that a trend is about to weaken earlier than price itself. When divergence signals appear together with crossover signals, the probability of a trend reversal becomes very high.
- Bullish Divergence + Golden Cross: When price continues to create new lows, but the RSI indicator forms higher lows, this is known as “bullish divergence”. If an RSI Golden Cross appears at the same time, it serves as double confirmation that downward momentum has exhausted itself and bullish forces are preparing to counterattack. This forms a very high-quality bottom buying signal.
- Bearish Divergence + Death Cross: When price continues to create new highs, but the RSI indicator forms lower highs, this is known as “bearish divergence”. If this is accompanied by an RSI Death Cross, it indicates that upward momentum is losing strength and the risk of a top reversal increases significantly. This becomes an excellent opportunity to sell or open short positions.

Learning advanced RSI techniques, especially the interpretation of divergence, allows you to stay one step ahead of the market and capture important turning points.
Comprehensive Application of Golden Cross With MACD and KD Indicators
Within the large family of technical indicators, MACD and KD are also widely used momentum indicators. Combining them with the RSI Golden Cross can achieve a mutually balancing and confirming effect similar to a “separation of powers”.
An ideal strong buy signal combination may include:
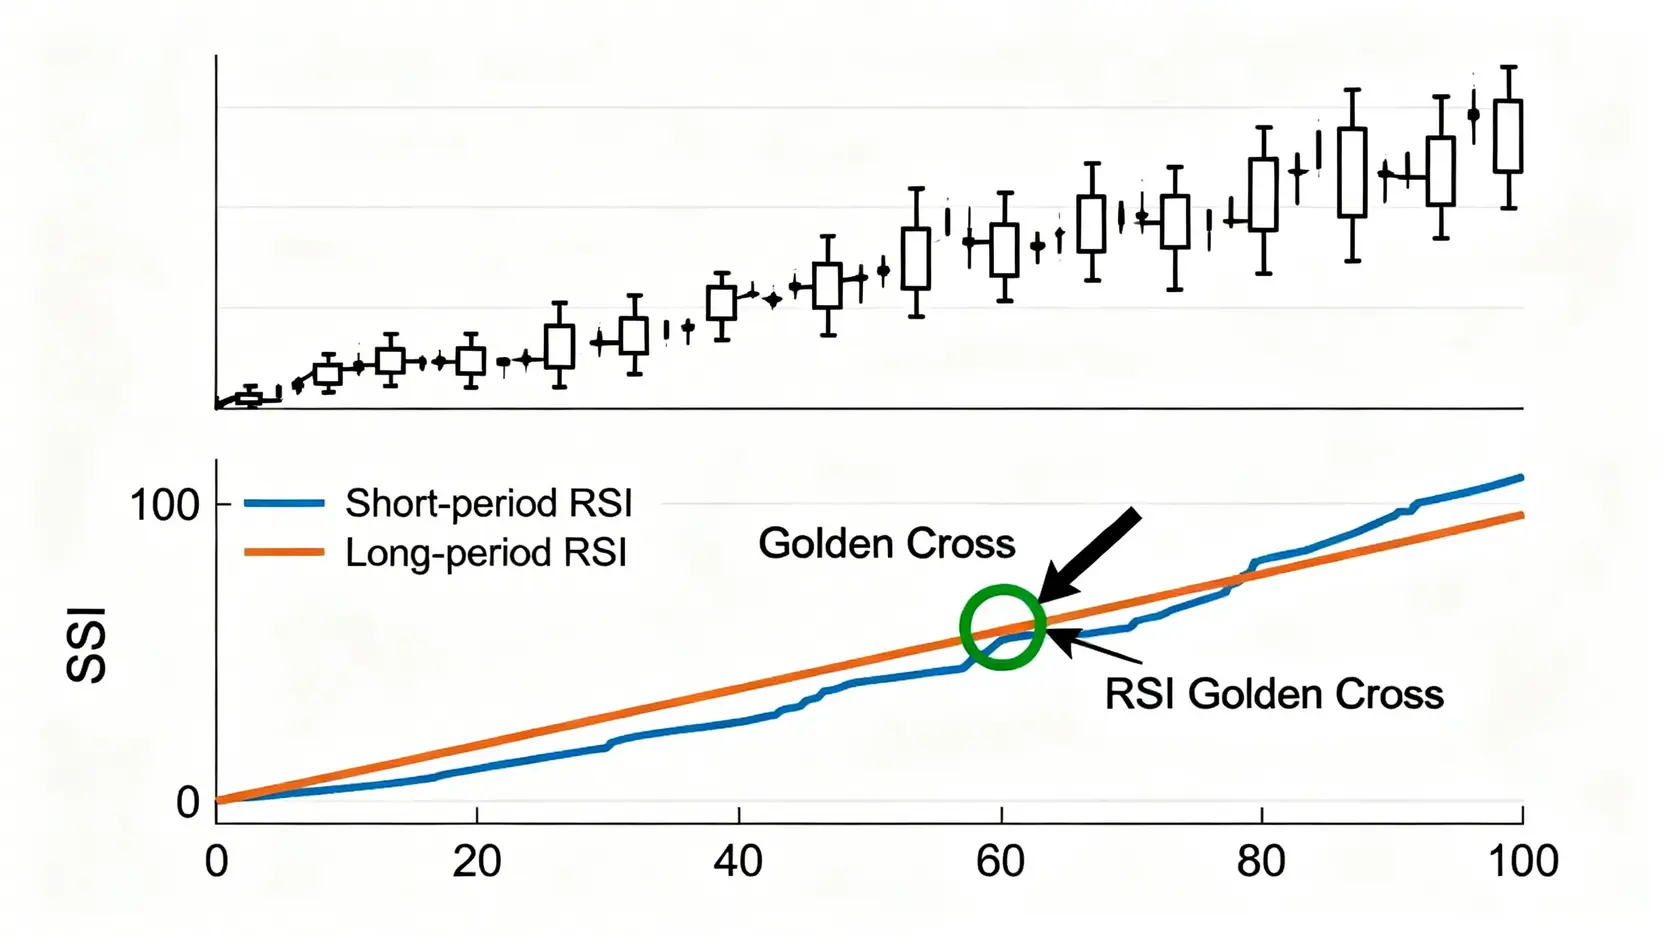
- RSI Golden Cross: Short-term momentum turns stronger.
- MACD Golden Cross: The fast line (DIF) crosses upward through the slow line (DEA), indicating that the medium-term trend is turning bullish.
- KD Indicator Golden Cross: The K value breaks above the D value from a low region, (for example below 20), showing strong short-term rebound momentum.
When these three indicators generate golden cross buy signals almost simultaneously, it means that short, medium, and long-term momentum have reached a unified bullish consensus. Such trading opportunities naturally have a much higher success rate compared with signals from a single indicator.
Further Reading (Highly Recommended)
Frequently Asked Questions About RSI Golden Cross (FAQ)
Q: After an RSI Golden Cross appears, will the price definitely rise?
A: Not necessarily. The RSI Golden Cross is a probability signal calculated based on historical data. It indicates that “the likelihood of an upward move is high”, but it is not a 100 percent guarantee. False signals may occur, especially during ranging markets without a clear trend. Therefore, it must never be used as the sole trading basis. Stop loss settings, capital management, and other analysis tools must be combined for comprehensive evaluation.
Q: How should RSI parameters (such as 6-day and 12-day) be set to best suit oneself?
A: There is no standard answer for the optimal parameters. It depends on your trading timeframe, the volatility of the instrument, and your personal risk preference. A recommended approach is: 1. Start with commonly used parameter combinations in the market (such as 6/12 or 7/14). 2. Conduct backtesting using historical charts to observe under which parameter settings the signal accuracy best matches your trading rhythm. 3. Test in a demo account to become familiar with the indicator’s response under those parameters. Avoid changing parameters frequently, as this will cause your trading system to lose consistency.
Q: In ranging markets, are RSI Golden Cross and Death Cross still effective?
A: In ranging markets, the effectiveness of the RSI crossover strategy is significantly reduced. Because prices fluctuate repeatedly within a narrow range, the RSI lines will cross frequently and meaninglessly, producing large amounts of “noise”. Under such market conditions, traders should consider pausing the use of crossover strategies or switching to indicators more suitable for range trading, such as Bollinger Bands, to buy near the lower band and sell near the upper band.
Q: Is the RSI Golden Cross applicable to all financial instruments?
A: Yes. As a technical indicator that measures momentum changes, the principle of the RSI Golden Cross is applicable to almost all financial instruments with publicly traded prices, including stocks, foreign exchange, futures, and cryptocurrencies. However, different instruments have different volatility levels, so the RSI parameters may require slight adjustments to match their unique price behavior patterns. For example, highly volatile cryptocurrencies may require slightly longer period parameters to filter out some noise.
Conclusion
In summary, mastering the use of RSI Golden Cross and RSI Death Cross is a fundamental skill for every technical analysis trader. The golden cross provides clear and potential buying opportunities, while the death cross serves as an important risk warning signal. However, it must be clearly understood that no indicator is a magical crystal ball capable of predicting the future. The best way to use the RSI Golden Cross is to treat it as a powerful component within a decision-making system, combined with overall market trends, price action, trading volume, and other confirming indicators. Only then can traders move forward steadily in the complex and ever-changing financial markets.
Related Articles
-
Practical Applications of Volatility Surfaces: From Options Modeling to Advanced Skew Trading Strategies In options markets, implied volatility is never a flat line. Instead, it forms complex "smile" or "skew" surfaces. For advanced traders, mastering the practical applications of volatility surfaces is equivalent to possessing a lens that reveals market...2026 年 6 月 3 日
-
Building a Foreign Capital Flow Copy Trading Model: A Stock Market Indicator for Accurately Tracking Institutional Positioning In Asia-Pacific stock markets, foreign capital inflows and outflows often determine the direction of the index. However, simply looking at daily net buy and sell data is no longer enough. Only by building...2026 年 6 月 3 日
-
Options Buyer Strategies During Extreme Market Conditions: Black Swan Hedging and Cross-Market Arbitrage During Volatility Surges The most terrifying aspect of financial markets is not a gradual decline, but overnight flash crashes and cross-market capital withdrawals accompanied by volatility surges. In the highly unpredictable global macroeconomic environment of 2026, geopolitical...2026 年 6 月 3 日


