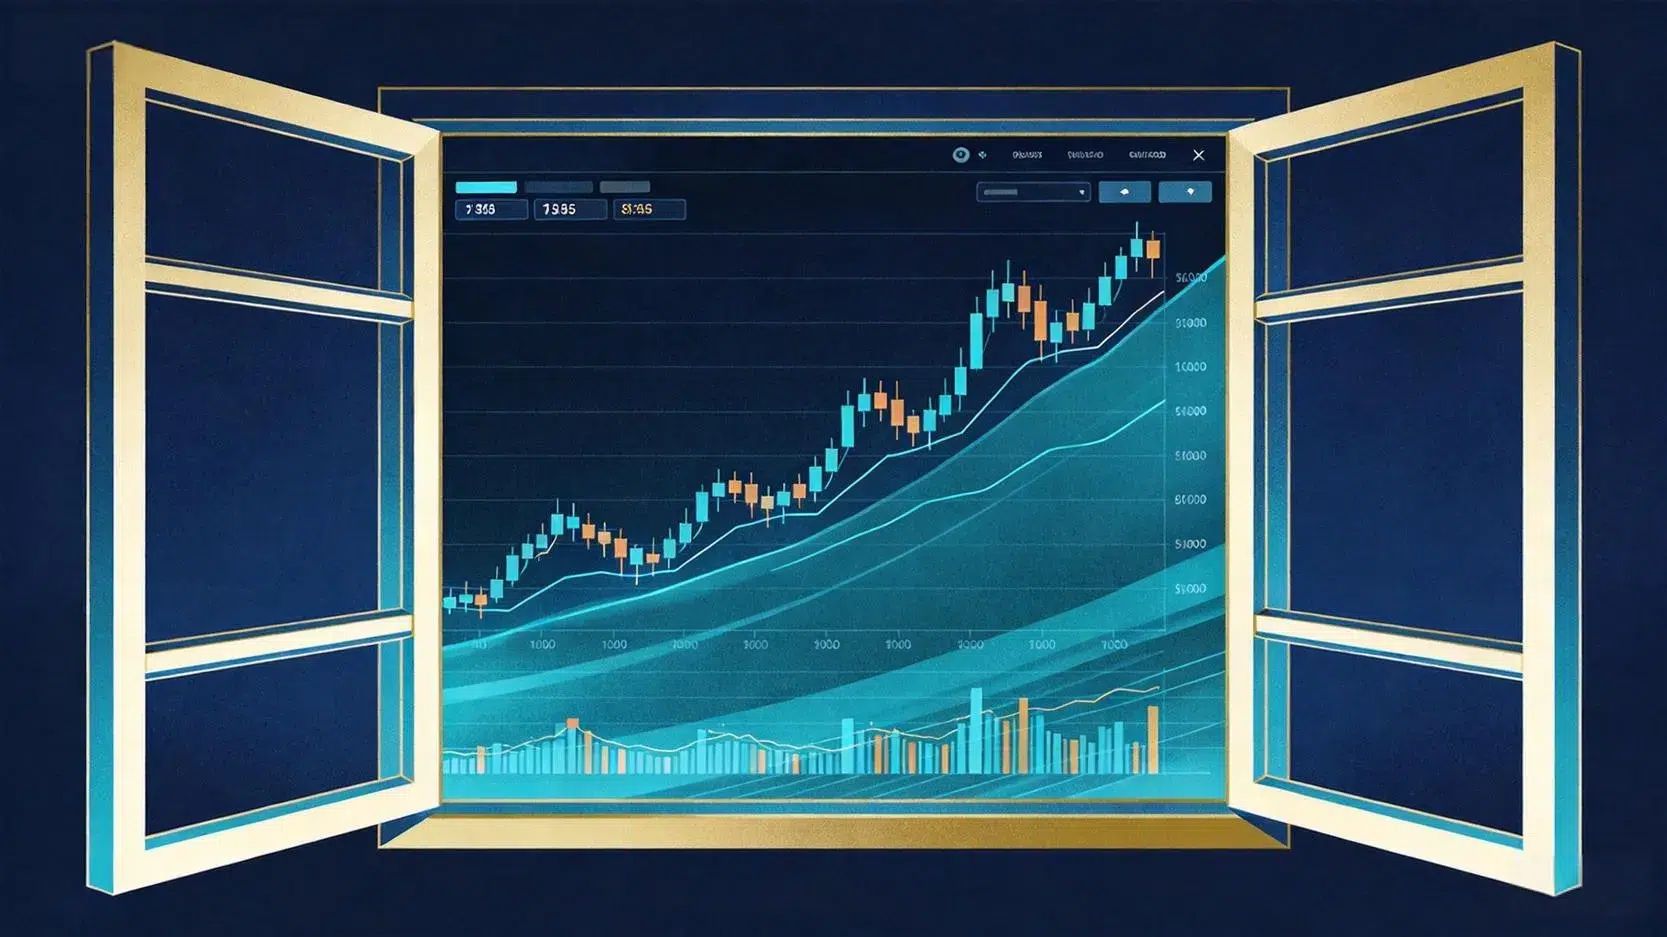
What Is a “Market Window”? Understanding “Market Timing” and “Trading Platform Windows”
Do you often come across the term “market window” in financial news, analyst reports, or trading software, yet feel confused about its exact meaning? Sometimes, it appears to refer to a specific user interface, while at other times, it seems to describe an abstract market opportunity. If you have the same question, this article is for you. In fact, both interpretations are correct. In the investment field, the term “market window” carries the dual meanings of a software function and a market opportunity. Understanding its meaning in different contexts is a crucial step in progressing from a beginner to an experienced investor. This article will thoroughly explain the two core meanings of “market window” and use practical examples to show you how to apply them to actual investment planning, allowing you to operate trading software and capture market movements with greater ease.
Clarifying the Concept: Two Core Definitions of a “Market Window”
To understand the term “market window” accurately, you must first recognize its two main meanings in different conversational contexts. Although these two definitions may appear unrelated, together they form the core of investment decision-making: receiving information and assessing timing.
Definition One: The “Quotation Window” in Trading Software
This is the most direct and fundamental definition of a “market window”. In any market monitoring software or trading app provided by a brokerage, the interface displaying dense, continuously updating data such as product prices, percentage changes, and trading volume is known as the “market window” or “quotation window”.
- Core Function: It provides a real-time, detailed stream of market data and serves as the information hub where investors monitor market movements, conduct technical analysis, and place trades.
- Common Content: This includes the current prices of individual stocks, futures, and forex, the five best bid and ask prices, percentage changes, trading volume, total volume, current volume, opening price, closing price, highest price, lowest price, and other data.
- Application Scenario: When someone says, “The data in my market window is delayed”, or “Add XX stock to the market window”, they are referring to this specific software function.
Definition Two: The “Market Opportunity Window”
This is the deeper and more strategic meaning of a “market window”. Among experienced investors and market analysts, a “market window” typically refers to a specific period that is favorable for entering the market and offers the potential to generate excess returns. The opening of this “window” is often triggered by key events or conditions.
- Core Function: It refers to a brief trading opportunity created by a specific catalyst that offers a higher probability of success or stronger return potential.
- What Creates It: It may be driven by policy announcements, earnings season, the release of major economic data, technical breakouts, or other market catalysts.
- Application Scenario: When analysts say, “The market window for a particular industry has opened”, or “The market is waiting for the next market window”, they are referring to this abstract yet highly important “period of strategic opportunity”.
Simply put, the first definition refers to the “tool” we use to monitor the market, while the second refers to the “opportunity” we wait to capture. A successful investor must not only know how to use the tools efficiently but also have the insight to recognize and seize market opportunities.
Further Reading (Highly Recommended)
How Should Beginners Start Investing in 2026? What Is Passive Investing? 5 Key Steps for Long-Term Investing
The “Market Window” in Trading Software: An Essential Tool for Market Monitoring and Order Execution
For most investors, the “market window” in trading software is the feature they interact with most frequently each day. Although it appears to be a simple interface, it contains many practical functions that can improve market monitoring efficiency and order execution speed. Becoming familiar with these features and making the most of them is the first step toward enhancing your trading performance.
Introduction to Market Window Features in Mainstream Market Monitoring Software
Today’s mainstream brokerage platforms, including brokerage apps commonly used by Taiwanese investors, as well as Futu NiuNiu and Tongda Xin, which are widely popular among users across the Asia-Pacific region, have developed highly sophisticated market window features. In addition to basic quotation information, they generally offer the following powerful functions:
- Diverse Quotation Modes: List, block, matrix, and other layout modes allow you to monitor dozens or even hundreds of instruments simultaneously.
- Customizable Data Fields: In addition to default fields such as price and percentage change, you can freely add dozens of data fields, including price-to-earnings ratio, dividend yield, free-float market capitalization, and turnover rate, to create a monitoring list that meets your analytical needs.
- In-Depth Data Integration: Advanced market windows provide Level 2 (LV2) market depth data, displaying the order volume and prices of the ten best bid and ask levels, and even tick-by-tick transaction details, helping you assess actual market supply and demand more accurately.
- Smart Alert Features: You can set price alerts and percentage change alerts for specific instruments directly within the market window. Once the specified conditions are triggered, the system will immediately send a notification, helping you avoid missing any trading opportunities.
How to Customize Your Market Window Layout and Build a Personalized Watchlist?
A cluttered market window only creates noise and makes decision-making more difficult. Building a clear and efficient personalized watchlist is essential. Here are a few practical setup tips:
- Organize by Groups: Avoid placing all your stocks in a single list. Create separate groups, such as “Core Holdings”, “Watchlist”, “Swing Trades”, and “Industry Sectors”. This allows you to quickly switch your focus based on current market conditions.
- Select the Most Important Data Fields: Consider which data points are most important to your trading strategy. If you are a value investor, metrics such as the “price-to-earnings ratio”, “price-to-book ratio”, and “dividend yield” may be essential. If you are a short-term trader, “turnover rate”, “price range”, and “real-time volume ratio” are likely to be more important. Remove unnecessary columns to keep your layout clean and easy to read.
- Make Good Use of Color Coding: Most trading platforms allow you to apply color rules to specific data fields. For example, you can highlight the “turnover rate” in a prominent color whenever it exceeds 5%, helping you quickly identify stocks with unusual trading activity.
Practical Tips: Using the Market Window for Quick Quotes and Lightning-Fast Order Placement
In a rapidly changing market, a difference of just a fraction of a second can affect the execution price. Many professional trading platforms integrate quick trading functions into the market window:
- Right-Click/Long-Press Menu: Right-click a specific instrument in the market window on a PC, or press and hold it in the app. A shortcut menu containing options such as “Place Order”, “Add to Watchlist”, and “View Details” will usually appear.
- Double-Click Linking: Link the market window to the order entry window. When you double-click any stock in the market window, the adjacent order entry window will automatically populate the stock code. You only need to enter the price and quantity, significantly shortening the order placement process.
- Lightning Order Placement: This is a more advanced feature. By clicking directly on the best bid or best ask price in the market window, you can submit an order using a preset quantity. For day traders and traders executing breakout strategies, where every second counts, this is an essential tool.
Spend some time exploring the market window settings in your trading software and turn it into your own “trading command center”. Your trading efficiency will improve significantly.
How to Identify and Capture a Strategic “Market Window”?
After mastering market monitoring tools, we can move on to the more essential topic: how to identify and capture a strategic “market window” that can generate substantial returns. These windows of opportunity are not always open. Their emergence is often accompanied by specific market catalysts. Learning to recognize these signals is the key to creating a performance gap between investors.
The “Earnings-Driven Market Window” Created by Earnings Season
Quarterly financial reports released by listed companies are among the most consistent and predictable events that create market windows. An “earnings-driven rally” refers to a wave of price increases triggered by financial results that exceed expectations.
- Window-Opening Signal: Key figures released by the company, such as revenue, profit, and gross margin, significantly exceed the general expectations of market analysts.
- Key Assessment Points:
– Degree of Outperformance: Merely “meeting expectations” is often not enough to trigger a rally. What is needed is a “significant beat”.
– Forward Guidance: Whether the company’s management provides an optimistic outlook for the next quarter or the full year. This is often more important than past performance.
– Peer Comparison: If several leading companies across the same industry all report strong results, this may indicate a sector-wide market window rather than an opportunity limited to a single stock.
- Strategic Positioning: Investors may establish positions before the earnings release based on research and analysis, or enter after the results are announced once strong performance is confirmed and the share price reacts positively (such as through a gap-up).
The “Data-Driven Market Window” Triggered by Macroeconomic Releases
As the global economy is closely interconnected, the release of major macroeconomic data often triggers significant market volatility (particularly in the forex and index futures markets), creating short-term trading opportunities.
- Key Economic Data:
– Consumer Price Index (CPI): A key measure of inflation that directly influences central banks’ decisions on interest rate hikes or cuts.
– Nonfarm Payrolls (NFP): Released monthly in the US, this report reflects the health of the labor market and serves as an important indicator of economic conditions.
– Purchasing Managers’ Index (PMI): Measures the performance of the manufacturing or services sector and is considered a leading economic indicator.
- Window-Opening Signal: A significant deviation between the published data and market expectations. For example, if CPI comes in well below expectations, it may fuel expectations of monetary easing and support equities. Conversely, a stronger-than-expected reading may raise concerns about tighter monetary policy and weigh on the stock market.
- Trading Characteristics: Data-driven market windows are typically very brief and highly volatile, often lasting only from a few minutes to several hours after the data release. These market conditions are better suited to experienced, disciplined short-term traders who maintain strict stop-loss rules.
The “Policy-Driven Market Window” Created by Major Meetings or Favorable Policies
“Policy is the most important fundamental factor”. This statement applies to many markets. Government policies supporting specific industries and central bank monetary policy meetings can both become the starting point of a major market trend.
- Window-Opening Signals:
– Industrial Policy: The government announces large-scale subsidies or policy support for specific industries (such as semiconductors, green energy, or electric vehicles).
– Monetary Policy: A central bank’s interest rate decision meeting (such as that of the US Federal Reserve), followed by a shift in the post-meeting statement toward a dovish stance (favoring easing) or a hawkish stance (favoring tightening).
– Fiscal Policy: The government introduces a large-scale infrastructure program or tax reduction plan.
- Key Assessment Points: Focus on the strength, sustainability, and scope of the policy’s benefits. A long-term national strategy involving substantial investment can create a market window with a duration and depth far greater than those generated by short-term stimulus policies.
- Strategic Positioning: Once the policy direction becomes clear, investors should focus on the companies within the industry chain that benefit most directly and significantly. These market windows tend to last longer, making them suitable for swing trading or medium- to long-term holding strategies.
How Can Technical Analysis Help You Identify a Market Window?
In addition to fundamental and news-driven catalysts, price movements themselves, (through technical analysis) can also provide signals that a market window is about to open. For investors who do not want to study complex financial reports or macroeconomic data in depth, this offers a relatively pure decision-making framework. Learning the basics of technical analysis is an essential step for many successful traders.
- Breakout After a Prolonged Consolidation: A stock trades sideways within a narrow price range for several months or even longer, while trading volume gradually contracts. If it eventually breaks above the upper boundary of this consolidation range with a long bullish candlestick and strong volume, this usually signals the beginning of a new trend and the opening of an important market window.
- Support and Crossovers at Key Moving Averages: For example, a stock may pull back from a high but find strong support near the annual moving average (250-day moving average), which represents the long-term trend, before rebounding. This may indicate a potential buying window. Alternatively, when the monthly moving average (20-day moving average), which represents the short-term trend, crosses above the quarterly moving average (60-day moving average), which represents the medium-term trend, it forms a “golden cross”, a classic bullish signal.
- Confirmation of a Bottoming Pattern: After a prolonged decline, the stock price stops making new lows and gradually forms a classic bottom reversal pattern, such as a “W-shaped bottom (double bottom)” or an “inverse head and shoulders”. When the price successfully breaks above the neckline of the pattern, it confirms the end of the downtrend and the beginning of an uptrend, officially opening the market window.
Further Reading (Highly Recommended)
Futures Trend Analysis: Learn How to Assess Futures Trends in 5 Steps, from Candlesticks to Chart Patterns
The Secret to Improving Your Trading Win Rate: A Guide to Multi-Timeframe Analysis and Multi-Period Confluence
Case Studies: Reviewing Several Typical Market Windows in History
Combining theory with real-world examples can deepen your understanding. Let us review several typical market windows from the past that were driven by different factors and examine the market conditions and characteristics at the time.
Case One: The Global Monetary Easing Rally After the 2020 Pandemic
- Background: In early 2020, the COVID-19 pandemic swept across the world, bringing economic activity in many countries to a standstill and triggering a panic-driven collapse in financial markets.
- Catalyst: Major global central banks, led by the US Federal Reserve, urgently adopted the unprecedented policy of “unlimited quantitative easing (QE)”, sharply cutting interest rates and injecting massive liquidity into the market.
- Market Window Type: A typical “policy-driven market window”.
- Market Performance: After the policies were implemented in late March 2020, global stock markets (particularly the technology-heavy Nasdaq Index), rebounded from their lows and entered a super bull market that lasted for a year and a half. Stocks associated with remote working, online entertainment, biotechnology, and vaccines recorded remarkable gains. This market window generated substantial returns for investors who dared to position themselves against the trend during the crisis.
Case Two: A Thematic Market Rally Supported by Policies for Specific Industries
- Background: In recent years, addressing climate change and energy security has become a global consensus. Governments around the world have elevated the development of green energy (such as solar and wind power) and the electric vehicle industry chain to the level of national strategy.
- Catalyst: Countries have successively introduced specific subsidy policies, carbon emissions targets, and timetables for banning the sale of fuel-powered vehicles. One example is the substantial subsidies for electric vehicles and green energy under the US “Inflation Reduction Act”.
- Market Window Type: A market window created by the convergence of a “policy-driven market” and an “industry trend”.
- Market Performance: Companies across the relevant industry chains, from upstream lithium mining and silicon materials to midstream battery and module manufacturers, and downstream electric vehicle brands and charging station operators, experienced several years of explosive earnings growth and rising share prices. This market window was characterized by its long duration and the continuous emergence of rotational opportunities within the industry.
Frequently Asked Questions About Market Windows (FAQ)
Q: How Long Does a Market Window Usually Last?
A: The duration of a market window depends on the nature of its driving factors. A “data-driven market” triggered by “macroeconomic data” (such as CPI or nonfarm payrolls) may last only a few minutes to several hours, making the window extremely brief. An “earnings-driven rally” caused by better-than-expected financial results may last from several weeks to one or two months. A “trend-driven market” supported by major industrial policies or a prolonged monetary easing cycle may last for several quarters or even years. The key is determining whether the catalyst creates a short-term sentiment shock or a long-term change in fundamentals.
Q: What Should I Do If I Miss a Market Window?
A: Missing a market window is a normal part of investing, so there is no need to dwell on it or rush into buying at higher prices. First, calmly assess whether the market window has just begun or is already nearing its end. If it is still in the early stage, you can wait for a short-term pullback before looking for an entry point. If the trend has already progressed significantly, chasing prices carries greater risk. It is often better to focus on identifying the next potential market window. The market never runs out of opportunities. Maintaining patience and discipline is more important than capturing every price move. Remember, it is better to miss an opportunity than to make the wrong trade.
Q: How Should Beginner Investors Participate in a Market Window?
A: For investment beginners, it is advisable to start with market windows that last longer and have a clearer investment thesis. For example, industry trends supported by long-term government policies tend to offer greater certainty while giving you more time to conduct research and respond. You can begin by investing in exchange-traded funds (ETFs) focused on the relevant themes. This allows you to participate in the opportunity while diversifying individual stock risk. It is best to avoid highly volatile data-driven market windows, which demand rapid execution and strict trading discipline, as they may lead to unnecessary losses.
Q: How Can I Tell the Difference Between a Genuine Market Window and a “False Breakout”?
A: This is a classic challenge in technical analysis. One of the most important indicators is “trading volume”. A genuine upward breakout is usually accompanied by a significant increase in trading volume, indicating strong buying interest and broad market acceptance of the new price direction. If the price breaks above a resistance level but trading volume fails to increase or even declines, this is known as a “price-volume divergence”, which is a common sign of a false breakout and should be treated with caution. In addition, whether the price can remain above the breakout level for several consecutive trading days is another important confirmation signal.
Conclusion
In summary, a “market window” is a core investment concept that encompasses both a “tool” and an “opportunity”. From an operational perspective, it serves as the information hub within trading software for monitoring the market and placing orders. Mastering its features can significantly improve trading efficiency. From a strategic perspective, it represents a temporary investment opportunity with strong potential, driven by earnings reports, economic data, policy developments, or technical signals. The ability to identify and seize these market windows is essential for building long-term wealth. Understanding the precise meaning of a “market window” in different contexts will not only help you use trading tools more effectively but also sharpen your ability to recognize critical market opportunities. We hope this in-depth guide has given you a fresh understanding of the concept, enabling you to be fully prepared and confidently positioned when the next market window arrives.