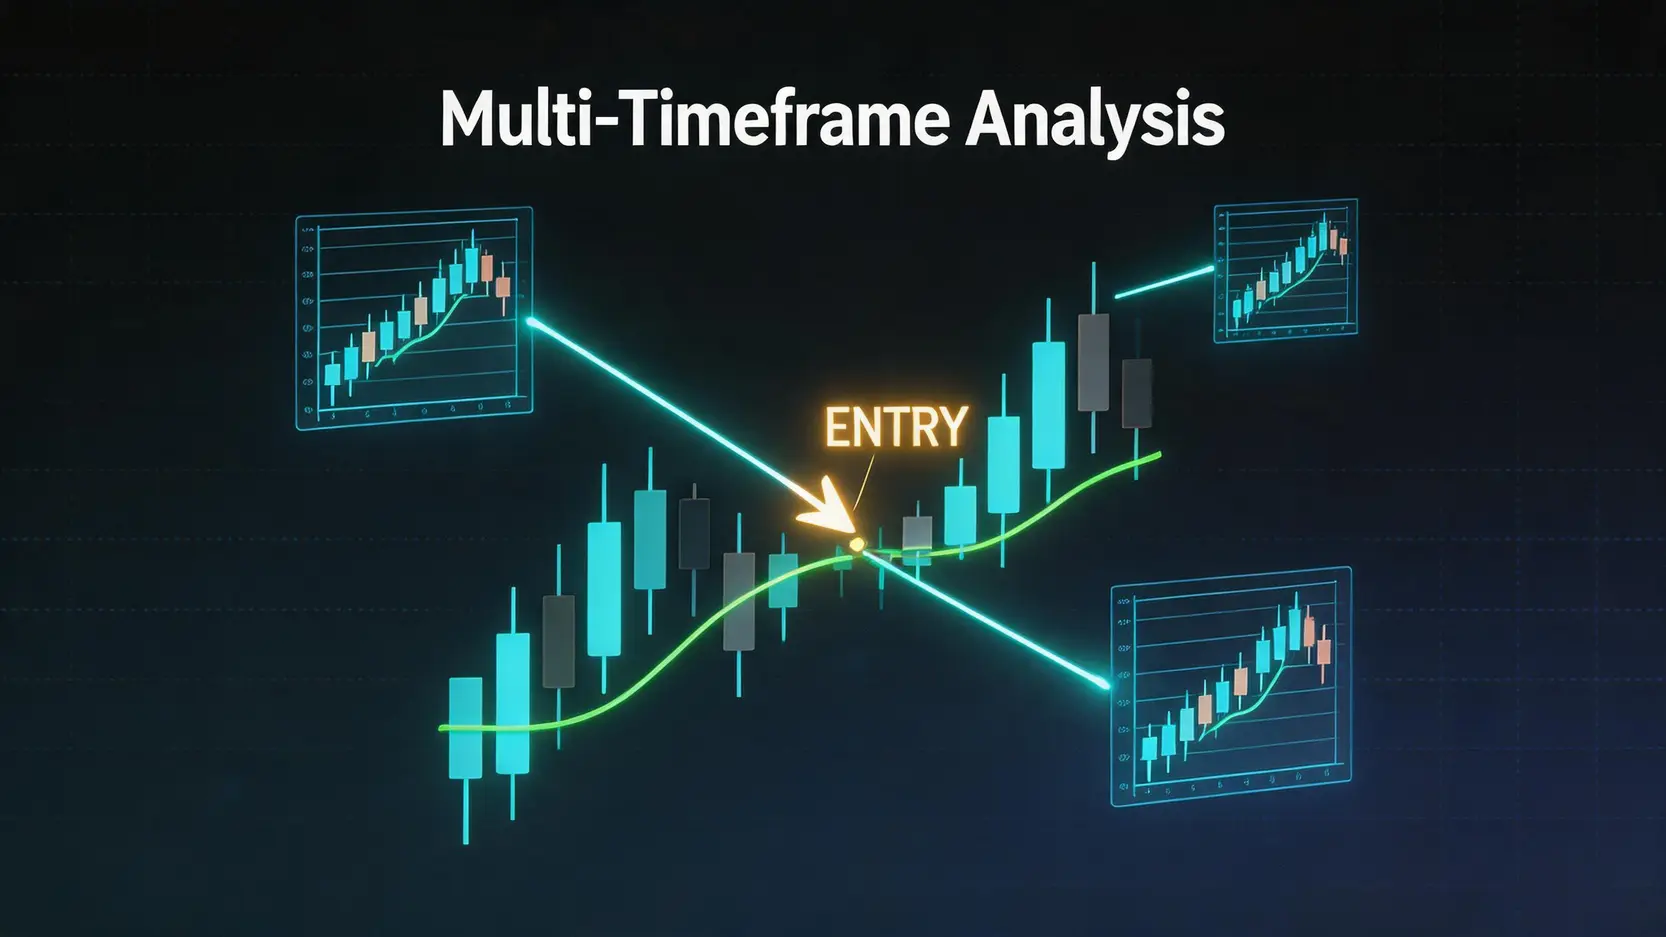
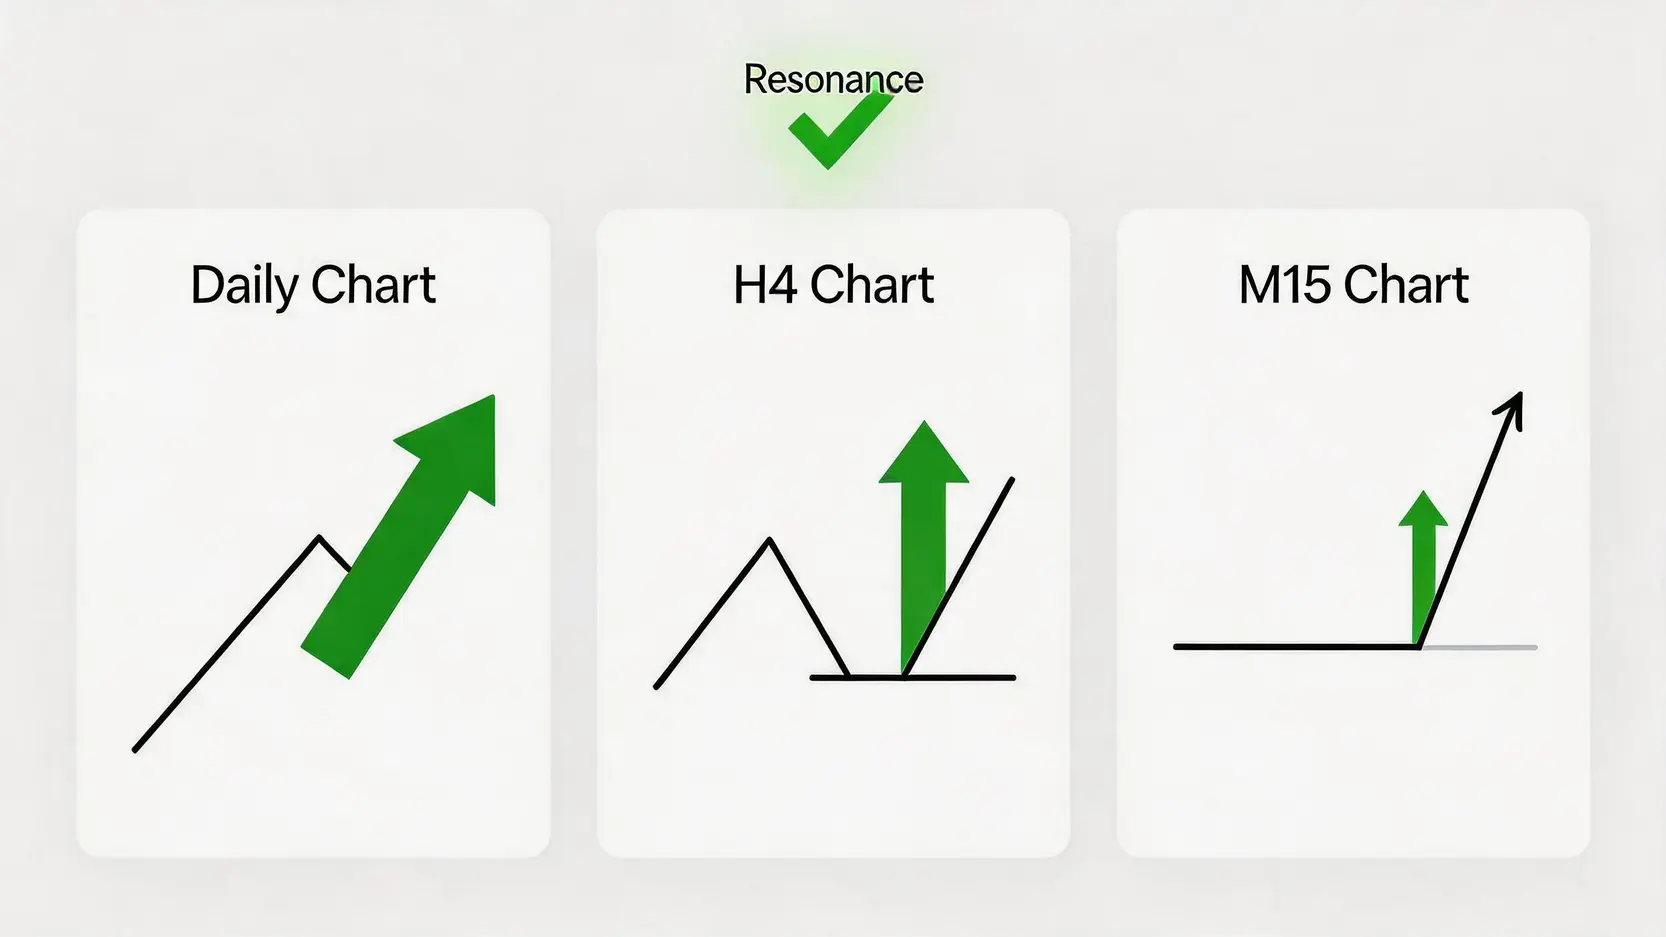
When All Signals Align, “Confluence” Creates High-Probability Opportunities
Such confluence signals have a much higher win rate than single-timeframe signals because they simultaneously satisfy:
- With the trend: The trade direction aligns with the main trend.
- At support: The entry is located at a key higher-timeframe zone.
- With confirmation: The lower timeframe provides a clear trigger signal.
Learning to wait for and capture these moments of “confluence” is a key dividing line between amateur and professional traders.
Practical Guide: 5 Steps to Build Your Multi-Timeframe Analysis System
Theory is complete, now for the practical part. Follow the five steps below to build your own multi-timeframe analysis system from scratch. This is a truly actionable method for improving trading win rate.
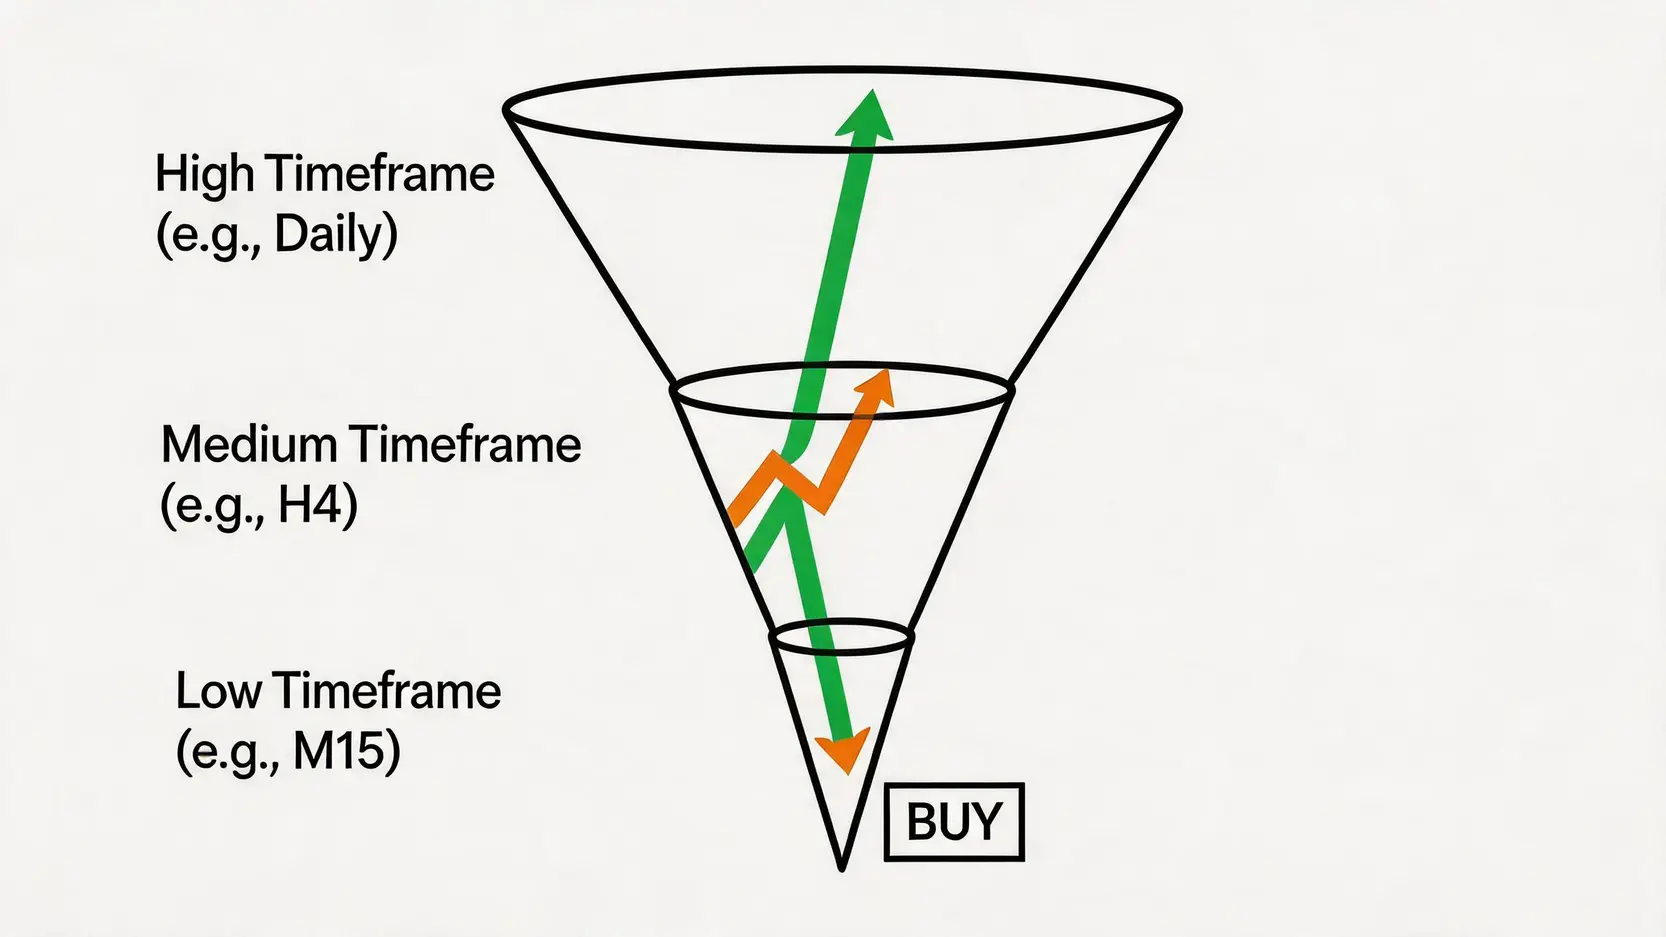
Step 1: Choose Your “Structure, Trend, Entry” Timeframe Combination
Different trading styles require different timeframe combinations. You need to select based on your holding period and trading frequency. Below are some common setups that you can use as a foundation for adjustment:
|
Trading Style
|
Structural Timeframe (Higher) |
Trend Timeframe (Middle) |
Entry Timeframe (Lower) |
|
Swing Trader
|
Weekly
|
Daily |
4-Hour (H4) |
|
Day Trader
|
Daily |
1-Hour (H1) |
5-Minute (M5) |
| Scalper |
4-Hour (H4) |
15-Minute (M15) |
1-Minute (M1) |
Reminder: When you first start practicing, it is recommended to begin with “Daily + 4-Hour + 15-Minute” or “Daily + 1-Hour + 5-Minute” combinations. These setups have a moderate rhythm and are suitable for most beginners to build trading rhythm awareness.
Step 2: Identify the Main Trend and Key Support and Resistance Zones in the “Structural Timeframe”
Open your structural timeframe chart (for example, the daily chart). At this stage, your task is only two things:
- Identify the trend: Is the market in an uptrend, downtrend, or consolidation? You can use the simplest method, such as observing the structure of highs and lows (uptrend = higher highs and higher lows), or use moving averages (for example, 50 EMA and 200 EMA) for confirmation.
- Mark key zones: Identify the “obvious” horizontal support and resistance zones on the chart. These are areas where price has previously reversed or consolidated multiple times. Mark these zones with boxes as your future “hunting grounds”. Authoritative sources such as Investopedia also provide detailed explanations of this concept.
After completing this step, you have established the market bias: if the daily chart is in an uptrend, you will only look for long opportunities in the next stages.
Step 3: Wait for Price to Pull Back to Key Zones and Show Reversal Structure in the “Trend Timeframe”
Switch to your trend timeframe chart (for example, the 4-hour chart). Now your task is patience. What are you waiting for? You are waiting for price to “pull back” into the key support zone identified in Step 2 (for long setups).
When the price reaches this zone, do not act immediately! You need to observe whether the market shows signs of a “potential reversal”, such as:
- Slowing downside momentum: Candlestick bodies become smaller and more lower wicks appear.
- Formation of consolidation structure: Price stops making new lows and starts moving sideways.
- Emergence of secondary reversal patterns: Such as double bottom or inverse head and shoulders.
This step filters out those “overly fast” and ineffective pullbacks, ensuring there are clear signs of buying interest entering the market at higher-timeframe support zones.
Step 4: Identify a Decisive Entry Signal in the “Entry Timeframe”
Once the trend timeframe shows signs of stabilization, your “sniper scope” entry timeframe (for example, the 15-minute chart) comes into play. Here, we look for precise, clear, and low-risk entry signals. Common signals include:
- Trendline breakout: Draw a descending trendline during the pullback on the 15-minute chart and wait for a volume-backed breakout to the upside.
- Key Candlestick Patterns: At support zones, clear reversal candlestick patterns appear such as bullish engulfing and hammer (Pin Bar) patterns, which are part of candlestick chart analysis.
- Market Structure Shift: Price breaks the previous minor high on the lower timeframe (Break of Structure), forming a new “higher high”.
Once these signals appear, it is the best time to execute a “multi-timeframe confluence entry”!
Further Reading (Highly Recommended)
【CFD Tutorial】Ultimate Beginner’s Guide to CFD Trading: From Account Opening to 5 Practical Investment Strategies
Golden Cross and Death Cross Full Guide: Essential Technical Analysis for Gold Price Candlestick Charts Beginners Must Learn
Step 5: Set Proper Stop Loss and Take Profit to Complete a High-Probability Trading Plan
Finding the entry point only completes half of the trade. A trading plan without risk management is destined to fail. Therefore, before execution, you must define your exit points:
- Set Stop Loss: This is your “lifeline”. The stop loss should be placed at a level where your entry reason becomes “invalid”. For example, if you enter based on a 15-minute bullish engulfing candle, the stop loss should be placed slightly below the low of that candle.
- Set Take Profit: The profit target can be set at the next key resistance zone on the structural timeframe (daily). Alternatively, you can use a fixed risk-reward ratio, such as at least 1:2 or 1:3, meaning your potential profit is at least 2 to 3 times your potential loss.
After completing these five steps, you will have a complete high-probability trading plan based on Top-down analysis.
FAQ: Common Questions About Multi-Timeframe Analysis
Q: Which timeframe combinations should I choose?
A: This depends entirely on your trading style and objectives. The key principle is that there should be an approximate 4 to 6 times gap between adjacent timeframes so that “structure” and “detail” can be effectively distinguished. For example, the daily chart (24 hours) and the 4-hour chart (24/4=6) form a good pairing. You can refer to the table in Part 2 of this article and experience different combinations in a demo account to find the rhythm that best suits you.
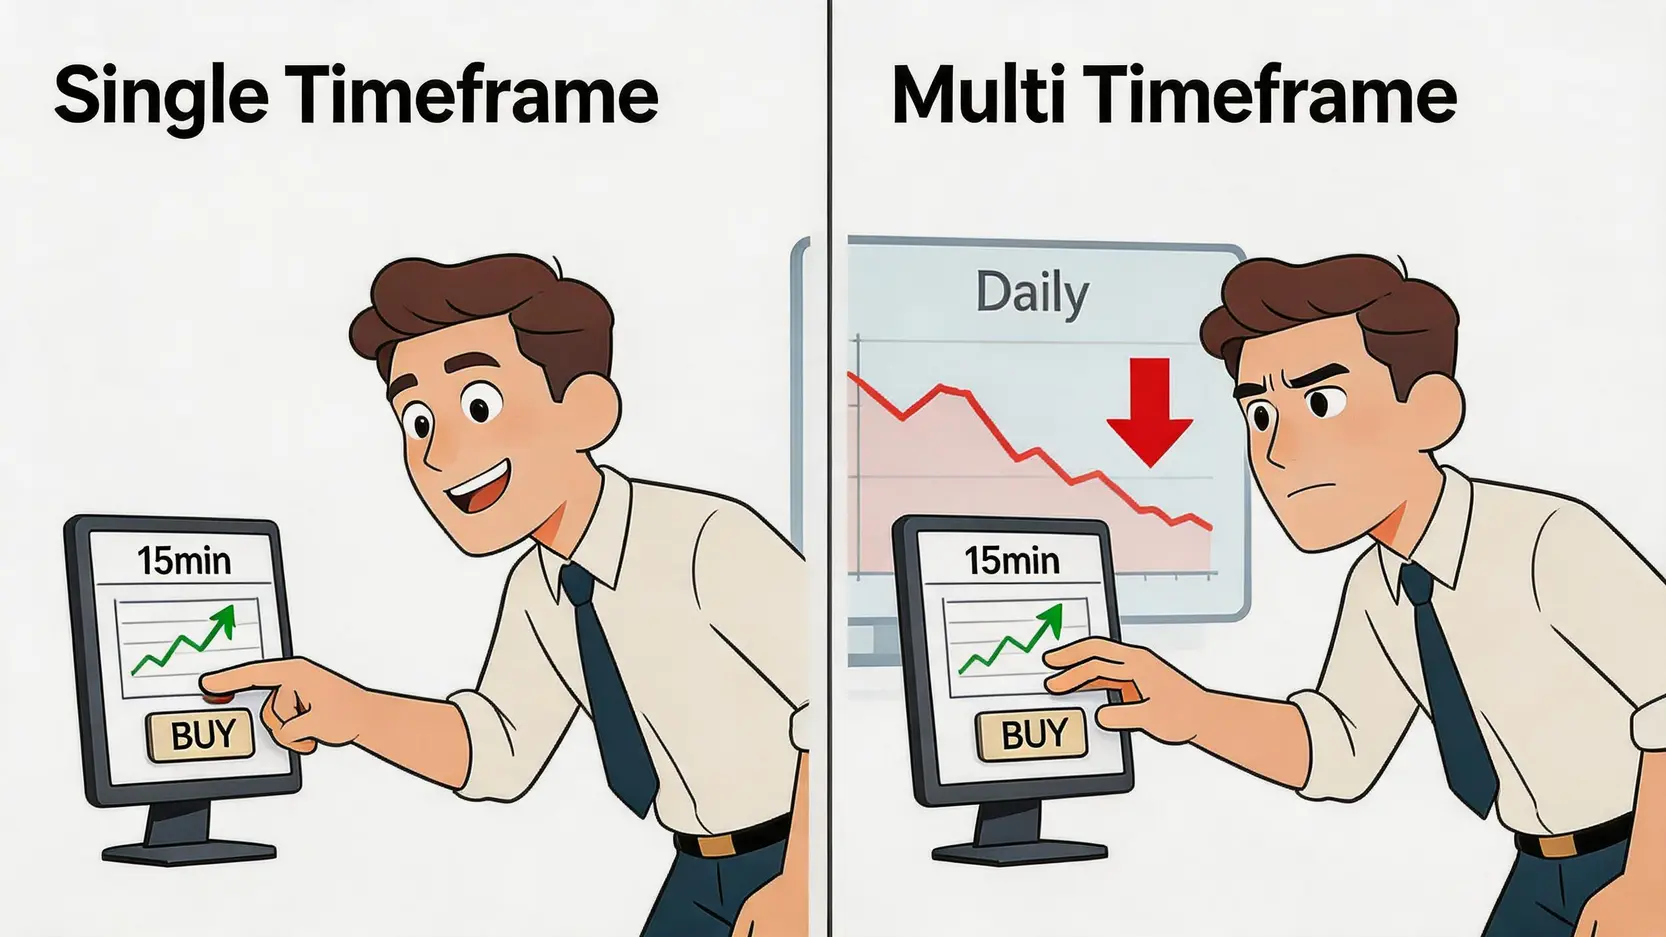
Q: What should I do if signals from different timeframes conflict?
A: This is a very good question and also the essence of this strategy. The answer is: always prioritize the signal from the higher timeframe. If the daily chart is in a clear downtrend, but the 15-minute chart shows a golden cross or bullish signal, professional traders will either ignore the 15-minute signal or treat it only as a short-term rebound selling opportunity, not a reversal buy signal. When signals conflict, the best strategy is to “not trade” and wait patiently for all timeframes to return to “confluence”.
Q: Can multi-timeframe analysis be applied to all markets (such as forex, stocks, and cryptocurrencies)?
A: Yes, it is fully applicable. Top-Down analysis is based on market structure and price action, which are universal languages across all freely traded markets. Whether it is forex, indices, stocks, commodities, or cryptocurrencies, as long as there is a candlestick chart, you can use this method to analyze the market and identify trading opportunities. Its universality is exactly what makes it so powerful.
Q: What indicators should be used with multi-timeframe analysis?
A: It is recommended to keep your chart clean. In the early stage of practice, you can use one or two simple indicators to assist your analysis. For example, moving averages (such as 20, 50, and 200 EMA) can help identify trend direction across different timeframes. In the trend timeframe, when price pulls back to key zones, RSI or Stochastics can be used to check whether the market is in oversold or overbought conditions as an additional confirmation signal, but they should never be used as standalone entry signals.
Conclusion
In summary, multi-timeframe analysis is a key method for fundamentally improving trading win rate. It forces traders to move away from a single perspective and interpret the market in a more macro and systematic way. By strictly following the five steps of Top-down analysis, you can more confidently plan and execute multi-timeframe confluence entries, effectively filter out market noise, and avoid many unnecessary losses. Remember, successful trading begins with clear market structure interpretation. Start practicing this powerful analysis technique on your charts today and take your trading performance to the next level.