[2026 Latest] What Is US CPI? A Complete Guide to Release Times, How to Check the Data, and Market Impact
Everyone in the market is talking about US CPI, but what exactly is this data, and why is it so important? When a news alert says, “US CPI data came in above expectations, sending stocks lower”, do you feel completely confused? In fact, this data is not only a key indicator of inflation, but also a core variable that directly affects the US Federal Reserve’s (Fed) decisions to raise or cut interest rates, with an impact that extends across global stock, foreign exchange, and bond markets. This article will explain the definition of US CPI, CPI data release times, and how to check the data in the simplest possible way, while providing an in-depth analysis of how it affects your investment portfolio. This will help you move beyond passively receiving information when inflation data is released and instead identify opportunities early and make more informed decisions.
What Is US CPI? Understanding the Most Important Inflation Indicator
The US Consumer Price Index (CPI) is a core indicator used to measure changes in the price level of a country or region. It reflects statistical changes in the prices of goods and services related to daily life and is the most direct measure of inflation.
CPI Explained in Simple Terms: A Nationwide “Shopping Bill”
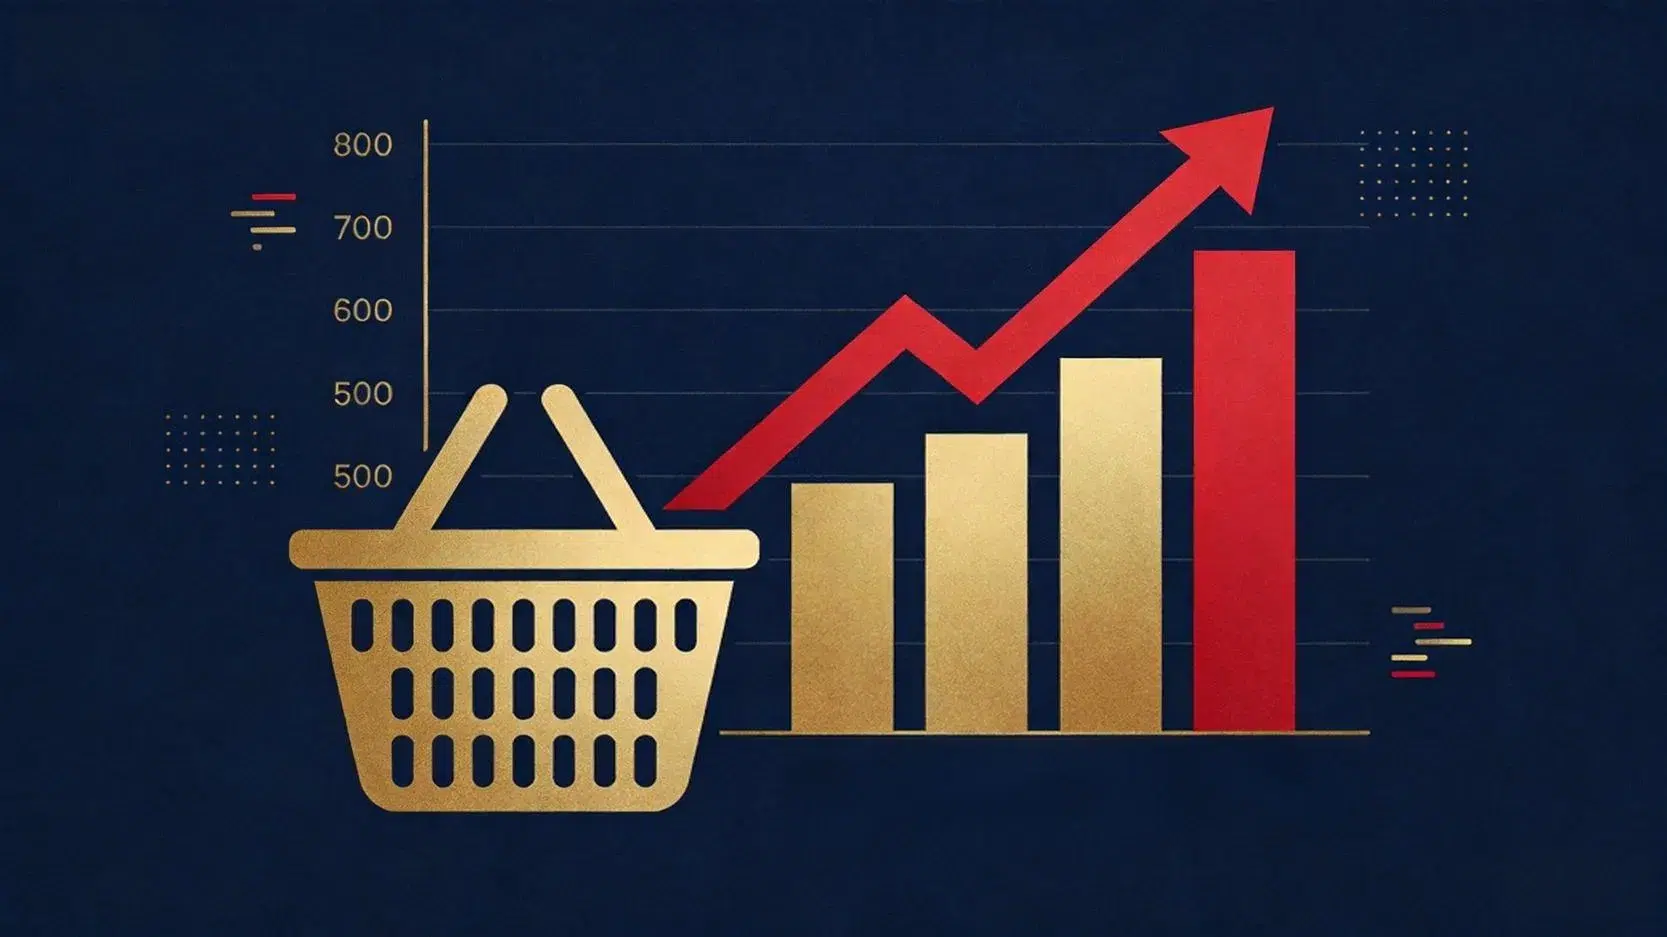
Imagine that every month, the government prepares one enormous “shopping bill” for households across the country. This bill includes daily expenses related to food, clothing, housing, transportation, education, and entertainment, such as:
- Food: Bread, milk, eggs, and dining-out expenses.
- Housing: Rent, utilities, gas, and furniture repairs.
- Transportation: Gasoline, used car prices, airfares, and public transportation costs.
- Medical Care: Medicines and healthcare service costs.
- Entertainment and Education: Movie tickets, books, tuition fees, and more.
Changes in the CPI represent how much the “total amount of this bill” has changed compared with the same period last year. For example, if the year-on-year CPI growth rate in July 2026 is 3.0%, it means that purchasing the same basket of goods and services now costs an average of 3.0% more than it did during the same period last year. This is what people commonly mean when they say that “money has lost purchasing power”.
CPI vs. Core CPI: Why Does the Market Pay More Attention to “Core” Data?
When reading a CPI report, you will always see two figures: “CPI” and “Core CPI”. The difference between them is:
- CPI (Headline CPI): Includes price changes across all categories and has the broadest coverage.
- Core CPI: Excludes the highly volatile “food” and “energy” categories.
Why is Core CPI given special attention? Food prices are easily affected by short-term factors such as seasons and weather, while energy prices (especially international oil prices) often fluctuate sharply due to geopolitical conflicts. These short-term distortions may obscure the overall inflation trend. Therefore, the Federal Reserve and economists tend to place greater emphasis on Core CPI, believing that it more accurately reflects underlying, long-term price pressures within the economy.
CPI vs. PCE: Which Does the Federal Reserve (Fed) Pay More Attention To?
In addition to CPI, another frequently mentioned inflation indicator is the “Personal Consumption Expenditures Price Index” (PCE). Although CPI is better known, the Federal Reserve’s official inflation target is actually based on PCE rather than CPI.
The main differences between the two are as follows:
- Data Sources: CPI mainly surveys spending from the “consumer side”, while PCE is primarily based on sales data from the “business side” and has broader coverage.
- Scope of Calculation: PCE includes certain items that consumers do not pay for directly, such as health insurance expenses paid by companies on behalf of employees, which are not included in CPI.
- Weight Adjustments: PCE weights are adjusted more flexibly according to changes in consumer behavior. For example, when beef prices rise sharply, consumers may switch to cheaper chicken, and PCE can reflect this “substitution effect” more quickly.
In summary, the Federal Reserve believes that PCE provides a more comprehensive reflection of actual consumer spending conditions. However, because CPI data is released earlier, the market still regards it as an “early indicator” of inflation conditions, and its importance should not be underestimated. According to the Federal Reserve’s official explanation, PCE is considered a better measure of inflation because of its broader coverage and dynamic weight adjustments.
Further Reading (Highly Recommended)
How Can Beginners Start Investing in 2026? What Is Passive Investing? 5 Key Steps and Long-Term Strategies
2026 Complete Guide to US Treasury Yields: Trend Analysis, the Impact of Surging Yields, and Asset Allocation Strategies
Where Can You Check the Latest US CPI Data? (Including the 2026 Release Schedule)
Keeping track of first-hand CPI data is a basic skill for every investor. The latest data can mainly be checked through the following channels:
Guide to Checking the US Bureau of Labor Statistics (BLS) Website
The most authoritative and immediate source of data is the issuing agency itself, the US Bureau of Labor Statistics (BLS). Investors can bookmark the official BLS CPI website to view the original report as soon as the data is released.
US CPI data is usually released at 8:30 a.m. Eastern Time (which is approximately 8:30 p.m. or 9:30 p.m. Taiwan/Malaysia time), depending on daylight saving time.
Data Tracking and Analysis on Major Financial Websites
For most investors, reading the original report directly may be somewhat difficult. A more convenient approach is to use major financial media websites or apps, which usually provide comprehensive data summaries, charts, and preliminary market analysis within minutes of the release.
- International Media: Bloomberg, Reuters, and The Wall Street Journal.
- Data Aggregation Platforms: Investing.com, Trading Economics, and MacroMicro.
These platforms not only provide the data, but also include the “market forecast” and “previous reading”, making it easier for investors to quickly compare whether the data is “better than expected” or “worse than expected”.
CPI Release Dates and Key Market Forecasts for the Second Half of 2026
US CPI data is generally released in the middle of the month following the end of the reporting month. Below is the estimated release schedule for the second half of 2026 (actual dates are subject to BLS announcements):
| Data Month |
Estimated Release Date |
Key Market Focus |
| June 2026 |
July 16, 2026 (Thursday) |
Whether core services inflation (especially housing) is cooling. |
| July 2026 |
August 14, 2026 (Friday) |
The impact of the peak summer travel season on transportation and accommodation prices. |
| August 2026 |
September 16, 2026 (Wednesday) |
The decline in energy prices after the summer peak. |
| September 2026 |
October 15, 2026 (Thursday) |
Confirmation of the inflation trend following the Federal Reserve’s September meeting. |
| October 2026 |
November 13, 2026 (Friday) |
Changes in consumer prices ahead of the year-end shopping season. |
| November 2026 |
December 15, 2026 (Tuesday) |
The final impact of holiday spending on inflation. |
How Does CPI Shake Global Markets? An In-Depth Analysis Across Three Key Areas
CPI is known as the “devil data” because it can trigger a chain reaction across financial markets. Its impact is mainly reflected in the following three areas:
Impact on Federal Reserve Interest Rate Decisions: A Bellwether for Rate Hikes or Cuts
The Federal Reserve’s two core mandates are to “maintain price stability” and “promote maximum employment”. CPI data is the most important basis for determining whether prices are stable. Therefore:
- CPI Consistently Above Expectations: This indicates significant inflationary pressure, increasing the likelihood that the Federal Reserve will raise interest rates (increase rates) to curb inflation.
- CPI Consistently Below Expectations: This suggests that the economy may be slowing, with a potential risk of deflation, increasing the likelihood that the Federal Reserve will cut interest rates (lower rates) to stimulate the economy.
The market uses CPI data to predict the Federal Reserve’s next move, which directly affects global capital flows and borrowing costs.
Impact on the Stock Market: The Seesaw Effect Between Technology and Value Stocks
The impact of CPI data on the stock market is not one-directional, but structural:
- When CPI Is Too High (Inflation Worsens):
- Technology/Growth Stocks Are Hit the Hardest: A large portion of these companies’ valuations comes from expectations of future cash flows. When expectations of higher interest rates increase, the discounted value of future cash flows falls sharply, causing stock prices to decline.
- Value/Cyclical Stocks Are Relatively Resilient: Financial stocks (such as banks) may benefit from wider interest rate spreads, while sectors such as energy and raw materials may perform better due to rising commodity prices.
- When CPI Is Moderate or Declining (Inflation Is Under Control):
- Technology/Growth Stocks Rebound: Interest rate pressure eases, market risk appetite improves, and capital returns to high-growth assets.
- Defensive Stocks May Perform Modestly: Utilities, consumer staples, and similar sectors may become less attractive as their safe-haven appeal weakens.
Impact on the Foreign Exchange and Bond Markets: The Relationship Between US Dollar Strength and Yields
The impact of CPI also extends to the foreign exchange and bond markets. Generally:
- Foreign Exchange Market: Strong CPI data raises expectations of interest rate hikes, attracting international capital into the US to earn higher interest returns and driving the US dollar higher. Conversely, weak CPI data may cause the US dollar to weaken.
- Bond Market: Inflation is the enemy of bonds because it erodes the real purchasing power of fixed interest payments. Therefore, high CPI data causes investors to sell bonds, pushing bond prices lower and US Treasury yields higher. Rising yields further increase corporate financing costs and put pressure on the stock market.
Further Reading (Highly Recommended)
How Can Beginners Start Investing in 2026? What Is Passive Investing? 5 Key Steps and Long-Term Strategies
2026 Complete Guide to US Treasury Yields: Trend Analysis, the Impact of Surging Yields, and Asset Allocation Strategies
🆕 How Should Investors Respond on CPI Release Day?
Faced with this highly volatile event, investors with different styles should adopt different strategies. For those who are new to the market, understanding some basic principles of beginner investing is essential.
Strategy One: Mindset and Asset Allocation Recommendations for Long-Term Investors
For investors seeking long-term asset appreciation, the key is to “remain calm amid change” and avoid making impulsive decisions based on a single data release.
- Focus on Asset Allocation: Ensure that your portfolio is sufficiently diversified across different assets, including stocks, bonds, real estate (such as REITs) and commodities, to spread the risk of any single market.
- Invest Regularly and Maintain Discipline: Do not attempt to predict CPI data and time your market entries and exits. Stick to your dollar-cost averaging plan, as market declines allow you to purchase assets at a lower cost.
- Review Inflation-Hedging Assets: In a high-inflation environment, you may moderately increase the proportion of assets that can hedge against inflation, such as Treasury Inflation-Protected Securities (TIPS), energy stocks, consumer staples stocks, or gold.
Strategy Two: How Can Short-Term Traders Use Volatility to Find Trading Opportunities?
For experienced short-term traders with a higher risk tolerance, CPI release day can indeed provide trading opportunities, but it also carries extremely high risks.
- Set a Clear Trading Plan: Before the data is released, prepare strategies for different scenarios. For example: “If CPI is 0.2% above expectations, short Nasdaq index futures and set the stop-loss at…”.
- Strictly Enforce Risk Management: Prices can move extremely quickly when the data is released, so stop-loss orders must be set to prevent major losses.
- Monitor Market Sentiment: More important than the data itself is how the market “interprets” it. Sometimes, even if the data is poor, the market may rebound because “all the bad news has been priced in”, provided the figures match the market’s most pessimistic expectations.
3 Common Investment Traps You Should Avoid Before and After the Release
- Trap One: Looking Only at the Headline Figure and Ignoring the Details: Many investors focus only on the year-on-year CPI rate while overlooking changes in the month-on-month rate, the trend in Core CPI, and specific components (such as housing, medical care, and used cars). The devil is in the details, and component-level data can better reveal structural inflation issues.
- Trap Two: Using Excessive Leverage to Bet on Direction: Attempting to use high leverage to make a one-sided bet before the data is released is no different from gambling. The market’s initial reaction is often chaotic, with sharp moves in both directions, making it easy to be forcibly liquidated during significant price fluctuations.
- Trap Three: Overinterpreting a Single Data Release: Economic data from any single month may contain noise or short-term distortions. It should be assessed together with data from previous months and other indicators, such as the Producer Price Index (PPI) and employment reports, to form a more comprehensive picture of the economy and avoid “missing the forest for the trees”.
Frequently Asked Questions (FAQ)
Q: What Does It Mean When CPI Data Comes in Above Expectations?
A: When CPI data comes in above general market expectations, it is usually interpreted as meaning that “inflationary pressure is more persistent than expected”. This triggers several knock-on effects. First, the market may expect the Federal Reserve to adopt a more hawkish monetary policy, such as accelerating the pace of interest rate hikes or delaying the timing of rate cuts. Second, this may weigh on the bond market and push yields higher. Finally, expectations of higher interest rates and rising yields are unfavorable for the valuations of growth stocks such as technology shares, potentially triggering a stock market sell-off, while the US dollar may strengthen.
Q: Can CPI Be Used to Predict a Recession?
A: CPI itself is not a direct indicator for predicting a recession, but it is one of the key catalysts that can trigger one. Persistently high CPI may force central banks (such as the Federal Reserve) to raise interest rates aggressively to curb inflation. Rapid monetary tightening significantly increases borrowing costs for businesses and consumers, cools economic activity, and may ultimately lead to slower economic growth or even a recession. Therefore, many analysts regard “persistently high inflation” as a leading risk signal of a recession.
Q: Why Should Ordinary People Care About US CPI?
A: As the global economy is closely interconnected, and as the world’s largest economy, the inflation situation and monetary policy of the US generate significant spillover effects. First, they affect global interest rate levels, which in turn influence mortgage and car loan rates in your region. Second, they affect the US dollar exchange rate, which matters if you plan to travel abroad, study overseas, or purchase imported goods. Finally, US CPI directly affects the performance of global stock markets. If you hold any funds or stocks linked to global markets, the value of your assets will fluctuate accordingly.
Q: Is Core CPI Accurate If It Excludes Food and Energy?
A: This is a very good question. Core CPI is designed to filter out short-term and highly volatile factors so that underlying, sticky, long-term inflation trends can be observed more clearly. For central banks that formulate monetary policy, it provides a more stable reference indicator. However, for the general public, food and energy are unavoidable daily expenses, so headline CPI better reflects the actual pressure of living costs. Neither indicator is absolutely more accurate than the other. They simply reflect different perspectives and need to be considered together to provide a complete picture of inflation.
Conclusion
In summary, US CPI is more than just a cold economic figure. It is a thermometer for measuring the health of the US economy and a core variable influencing global financial markets and Federal Reserve monetary policy. From the definition of CPI and its differences from Core CPI to how the data can be checked and its far-reaching impact on markets, learning how to interpret CPI data can help investors assess market direction more accurately and identify risks and opportunities. It is hoped that this comprehensive analysis will ensure that when you encounter this “devil data” in the future, you will no longer feel confused, but will instead be well prepared to make more informed investment decisions.