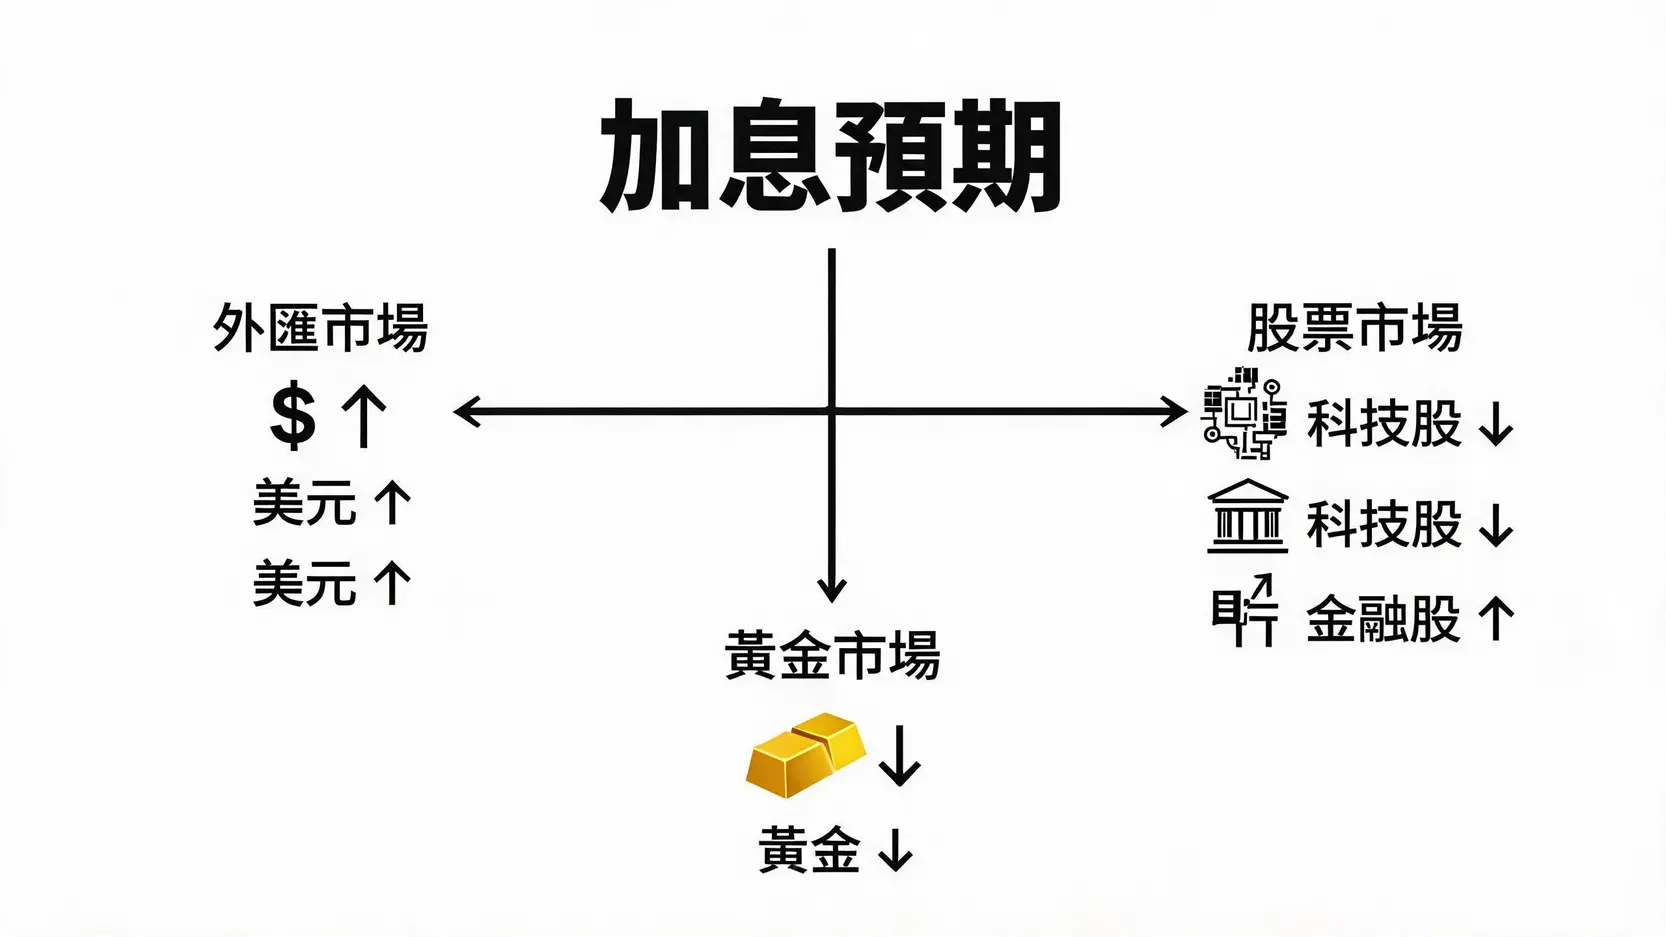
FedWatch Guide: Predict Rate Hikes Before the Market

Rate Hike Expectations Trading Guide: Use FedWatch to Predict Rate Hikes and Position Ahead of the Market
Core Concept: Why Trade “Expectations” Instead of “Facts”?
After spending enough time in the financial markets, you will notice an interesting phenomenon: the market often completes a major move before the Federal Reserve (Fed) or central banks of various countries actually announce a rate hike or rate cut. By the time the news is officially released, the market reaction is often weaker than expected, or may even move in the opposite direction. This is the core difference between professional traders and ordinary investors, they trade “expectations”, not “facts”. The essence of this method is exactly the rate hike expectations trading strategy this article will explore in depth. It teaches you how to interpret market direction and even use data such as the FedWatch tool to secure a favorable position before the news is confirmed.

The Principle of Market Pricing-in
The market is an efficient information processor. It continuously absorbs all available information, from economic data and official remarks to geopolitical risks, and reflects this information in asset prices. This process is called “market pricing” or “price-in”.
When the market expects a possible rate hike in the future, traders position in advance, thereby driving asset price movements:
- Currency: The currency of a country expected to raise interest rates usually strengthens, because higher interest rates can attract international capital seeking higher returns.
- Bonds: Government bond yields rise in advance (prices fall) to reflect the future interest rate level.
- Stocks: Growth stocks and technology stocks that are sensitive to interest rates may come under pressure, while value stocks such as financial stocks may benefit.
By the time the rate hike actually happens, since prices have already “priced in” this expectation, the market impact naturally becomes smaller, and it may even reverse because the “good news is fully priced in”.
Classic Case Analysis of “Buy the Rumor, Sell the Fact”
“Buy the rumor, sell the fact” is an old Wall Street saying that perfectly explains the core of expectations trading. Let us use a typical rate hike cycle as an example:
- Expectation emergence period: Inflation data begins to rise, and several Federal Reserve officials make “hawkish” remarks, hinting that action is needed. At this time, the probability of a rate hike at the next meeting shown by CME FedWatch may slowly rise from 10% to 40%. Smart traders begin buying a small amount of US dollars and positioning in financial stocks.
- Expectation development period: More strong employment reports and higher-than-expected CPI data are released, and the Federal Reserve chair also begins sending tightening signals. Market expectations for rate hikes heat up rapidly, and the rate hike probability on FedWatch surges above 80%. The US Dollar Index (DXY) rises most sharply at this stage, while the stock market may see a correction.
- Fact occurrence period: The Federal Reserve announces a rate hike as expected. However, since the market has fully digested the news, the US dollar may fall instead of rise, as traders choose to take profits. This is “sell the fact”. Market focus shifts to how much the “next” rate hike will be, or when this rate hike cycle will end.
This process clearly shows that the largest profit potential often exists in the stage from “expectation formation to full pricing-in”, rather than after the news is announced.

How to Quantify Rate Hike Expectations: Must-Learn Tools and Data Interpretation
Having only the concept is not enough. Professional traders need objective data to quantify the strength of market expectations. Learning to interpret the following key tools and data is the foundation of executing rate hike expectations trading.
CME FedWatch Tool Practical Guide: How to Interpret Rate Hike Probabilities?
To quantify expectations for Federal Reserve rate hikes, the most authoritative and intuitive tool is none other than the Chicago Mercantile Exchange (CME)’s FedWatch Tool. This tool uses the prices of federal funds rate futures (30-Day Fed Funds Futures) to reverse-calculate the market’s probability estimates for interest rate decisions at future FOMC meetings.
How to interpret:
- Check the target rate range: The tool page lists several of the most likely interest rate ranges for the next FOMC meeting and their corresponding probabilities.
- Observe probability changes: The key is not the probability at a single point in time, but its “dynamic changes”. You can check the probabilities from 1 day, 1 week, and 1 month ago to observe the evolution of market expectations. For example, if the probability of keeping rates unchanged falls from 80% to 50% in just one week, it means market concerns about rate hikes are heating up sharply.
- Compare expectations for different months: You can also check the interest rate expectations for the next several meetings. This helps judge whether the market believes this rate hike (or rate cut) is a one-off move, or the beginning of a complete cycle.
The FedWatch tool is a website that all investors concerned with interest rate trends, from forex to stocks, must bookmark.
Expectations Implied by Changes in the US Treasury Yield Curve
US Treasury yields (especially the 2-year and 10-year yields) are another important window for observing market interest rate expectations.
- 2-Year Treasury yield: It is the most sensitive to the Federal Reserve’s policy rate and is often regarded as the market’s direct forecast of interest rate trends over the next 1-2 years. If the 2-year yield climbs rapidly, it usually means the market expects the Federal Reserve… to take more aggressive rate hike actions.
- 10-Year Treasury yield: Reflects the market’s expectations for long-term economic growth and inflation.
- Yield curve inversion: When the 2-year yield is higher than the 10-year yield, it is called a “yield curve inversion”. This is a strong signal, suggesting that the market expects rates to continue rising in the short term, but that the economy may fall into recession in the long run, forcing the Federal Reserve to shift toward rate cuts in the future.
Pay Attention to Key Officials’ Remarks and Market Sentiment Indicators
Data is rational, but market sentiment often amplifies volatility. Therefore, paying attention to qualitative information that affects sentiment is equally important.
- Federal Reserve officials’ remarks: Especially remarks from the chair, vice chair, and New York Fed president. Traders carefully analyze their wording to judge whether their stance leans toward “hawkish”, meaning supporting rate hikes to suppress inflation, or “dovish”, meaning preferring to maintain low interest rates to stimulate employment.
- Interpreting Federal Reserve meeting minutes: Meeting minutes released three weeks after the interest rate decision provide more detailed internal discussion details, helping investors understand the degree of consensus and disagreement within the committee.
- Market sentiment indicators: For example, CNN’s “Fear & Greed Index”. Although it does not directly predict interest rates, it can reflect market risk appetite and help judge how much selling pressure the market faces under rate hike expectations.
Further Reading (Highly Recommended)
Trading Scripts for Different Rate Hike Expectation Stages
After understanding how to quantify expectations, the next step is to formulate corresponding trading scripts based on the different stages of expectations. This can help you avoid chasing highs and selling lows at the wrong time.
Script One: Expectation Emergence Period (Rate Hike Probability From Low to High) – How Should You Position Long?
The feature of this stage is that the market has just begun to realize the possibility of a rate hike. The rate hike probability on FedWatch may slowly climb from single digits to 30%-50%.
- Asset performance: The country’s currency begins to strengthen initially, while the stock market may not yet feel obvious pressure.
- Trading strategy: This is the best time to position long. You can adopt a “batch position-building” strategy and gradually buy the currency of the country expected to raise rates (such as the US dollar). For stock investors, they can begin shifting capital from interest-rate-sensitive technology stocks to financial stocks or value stocks that may benefit.
- Risk management: Expectations are not yet stable at this stage and can easily fluctuate due to a single data point or official remarks. Stop-loss levels should be set properly to avoid being shaken out by short-term volatility.
Script Two: Expectation Peak Period (Market Fully Priced In) – Potential Reversal Risk
At this stage, the market has a strong consensus on rate hikes. The FedWatch rate hike probability is usually above 80%, or even above 90%.
- Asset performance: The trends of currency appreciation and rising bond yields may already be close to an end. Market volatility may decrease as it waits for the final decision.
- Trading strategy: It is not suitable to chase higher at this time. Traders who already hold long positions should consider “taking profits in batches” to lock in part of their gains. Traders with no positions are better off staying on the sidelines, because the reversal risk from “good news being fully priced in” is extremely high. They may even consider setting up small counter-trend positions around the interest rate decision announcement.
- Risk management: The biggest risk is “falling short of expectations”. For example, if the market expects a one-notch rate hike, but the central bank ultimately raises rates by only half a notch, or releases a strong dovish signal in its statement, it may trigger a sharp reversal.
Script Three: Expectation Reversal Period (From Rate Hike Expectations to Rate Cut Expectations) – How to Adjust Strategy Quickly?
When economic data begins to weaken and inflation comes under control, the market’s focus shifts from “rate hikes” to “when rate hikes will stop”, and may even begin to expect “when rate cuts will begin”.
- Asset performance: The US dollar may begin to pull back from its highs, government bond yields (especially short-term yields) may decline rapidly, and assets such as gold and technology stocks may start to attract buying.
- Trading strategy: This is the moment when strategies need a 180-degree turn. Traders should decisively close previous US dollar long positions and shift to going long on non-US currencies or gold. In stocks, they should refocus on investment opportunities in growth stocks and technology stocks.
- Risk management: In the early stage of expectation reversal, market disagreements between bulls and bears are at their strongest, and price movements can easily become highly volatile. It is recommended to wait until the trend becomes clearer before entering the market, and to strictly control position size.
The Impact of Rate Hike Expectations on Different Assets and Trading Strategies
After mastering the macro script, we need to apply it to specific asset classes in order to formulate an executable trading plan.

Forex Market: How to Trade the US Dollar and Non-US Currencies?
The forex market is one of the markets most sensitive to interest rate expectations. When US rate hike expectations heat up, the following usually happens:
- US dollar strengthens: Capital seeking higher returns flows into the United States, pushing up the US dollar exchange rate. In terms of trading strategy, you can consider going long on the US Dollar Index (DXY), or shorting non-US currency pairs, such as EUR/USD and GBP/USD.
- Yen comes under pressure: When the interest rate differential between the US and Japan widens (with the US raising rates and Japan maintaining low interest rates), USD/JPY usually rises sharply. This is also a classic strategy for trading interest rate policy divergence.
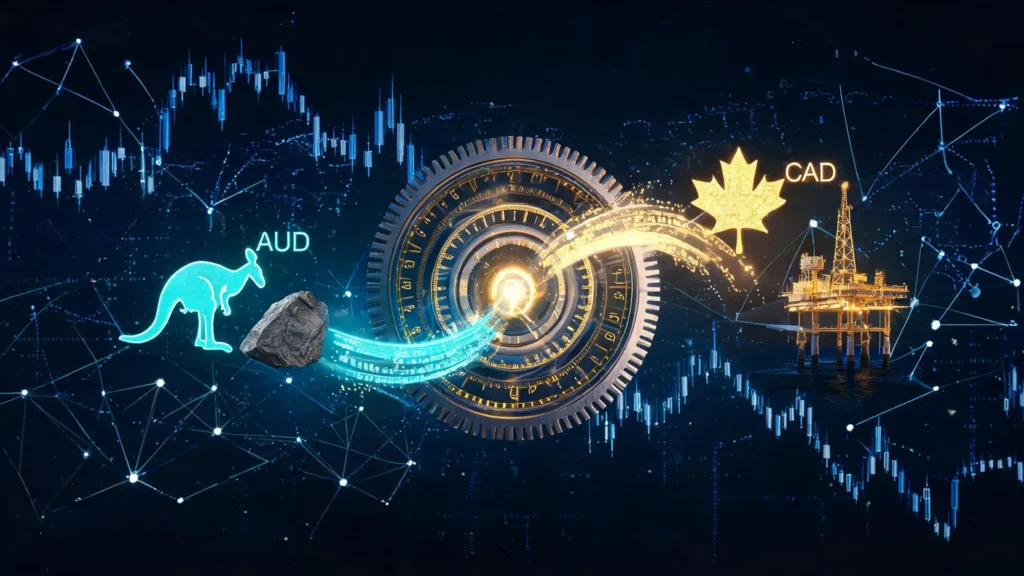
- Commodity currencies (Australian dollar, Canadian dollar) show mixed performance: Rate hike expectations are usually accompanied by concerns about an overheating economy, which may suppress commodity demand and be unfavorable for commodity currencies such as the Australian dollar and Canadian dollar.
Stock Market: Rotation Between Technology Stocks vs. Value Stocks
Rate hike expectations change the internal structure of the stock market and trigger sector rotation:
- Technology stocks/growth stocks come under pressure: The valuations of these companies depend heavily on discounted future cash flows. When interest rates (namely the discount rate) rise, the present value of their future earnings declines, leading to valuation cuts and making their share prices more likely to fall.
- Value stocks/financial stocks benefit: The net interest margin of the financial industry, (especially banks) expands as interest rates rise, which is favorable for earnings. Traditional value stocks usually have stable cash flows and lower debt, making them less sensitive to interest rate changes and more defensive in a rate hike environment.
Gold Market: Why Do Rate Hike Expectations Suppress Gold Prices?
Gold is a non-yielding asset. When interest rate expectations rise, the “opportunity cost” of holding gold increases.
- Opportunity cost: Investors can deposit funds in banks or buy bonds to earn higher risk-free interest, instead of holding gold that generates no interest income.
- Impact of the US dollar: Rate hike expectations push the US dollar higher, and gold priced in US dollars naturally comes under pressure.
Therefore, during periods of strong rate hike expectations, gold prices often perform weakly. Conversely, when the market begins to expect rate cuts, the opportunity cost of holding gold declines, and gold prices may gain an upward opportunity.
Frequently Asked Questions (FAQ)
Q: What if expectations are wrong?
A: Incorrect expectations are part of trading, and no strategy can guarantee 100% accuracy. The key lies in risk management. First, never take excessively large positions or overuse leverage, ensuring that the loss from any single trade remains within a tolerable range. Second, set a clear stop-loss point. Once the market trend moves against your expectations and hits the stop-loss, you must exit decisively to avoid expanding losses. Finally, continuously review your strategy and analyze why the expectation was wrong, whether it was due to incorrect data interpretation or an unexpected “black swan” event, so as to continuously optimize your trading system.
Q: Besides the US, are rate hike expectations in other countries also worth trading?
A: They are certainly worth trading. Volatility in the global forex market largely comes from “monetary policy divergence” among central banks of different countries (such as the European Central Bank (ECB), Bank of England (BOE), and Reserve Bank of Australia (RBA)). When one country is in a rate hike cycle while another is still implementing monetary easing, their currency pairs (such as EUR/USD and GBP/JPY) will produce very clear trending moves. By analyzing each country’s economic data and central bank stance, trading these policy divergences is a very mainstream and effective strategy in forex trading.
Q: What Is the “Dot Plot”?
A: The dot plot is a chart released by the Federal Reserve four times a year (in March, June, September, and December) after FOMC meetings. Each dot in the chart represents one Federal Reserve official’s forecast for the federal funds rate level at the end of future years. It is not an official policy commitment, but the market views it as a “wind vane” for observing the median interest rate expectations of Federal Reserve officials and the overall policy bias. Through changes in the dot plot, investors can gain insight into whether the Federal Reserve’s collective view on the future path of rate hikes or rate cuts has changed.
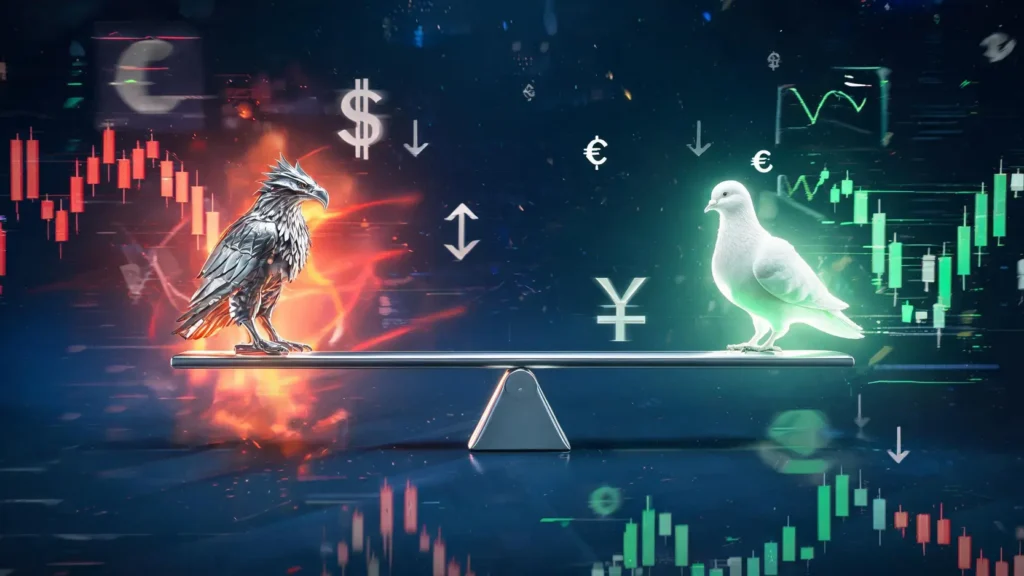
Q: What do “hawkish” and “dovish” mean when central bank officials use these terms?
A: “Hawk” and “dove” are terms used to describe the policy tendencies of central bank officials. Hawkish officials are more concerned about inflation and tend to support raising interest rates, (namely tightening monetary policy) to curb price increases, even if this may slow economic growth. Dovish officials are more concerned about economic growth and employment, and tend to support maintaining lower interest rates (namely loose monetary policy), to stimulate the economy. Understanding officials’ hawkish or dovish stance helps predict the possible direction of future policy.
Conclusion
The core of rate hike expectations trading lies in shifting from a passive information receiver to an active strategy executor. It requires traders to understand the evolution of market sentiment and take action before consensus forms. This is not simply guesswork, but a comprehensive judgment based on a series of data and information, including the CME FedWatch Tool, Treasury yields, and official statements. By learning and practicing the response scripts for different expectation stages mentioned in this article, and understanding their transmission mechanisms across various asset classes, you will gain a deeper understanding of how the market operates, allowing you to seize your own opportunities amid waves of interest rate changes. Please remember, the market always rewards traders who can see ahead and prepare fully.
Related Articles
-
What Is a Monetary Policy Shift? Understand Hawkish and Dovish Signals to Position Ahead of the Market Why does the market always hold its breath for the results of Federal Reserve (Fed) meetings? Why can every interest rate decision, and even a slight “shift” in wording, always trigger sharp volatility...2026 年 6 月 25 日
-
Ultimate Guide to 2026 Australian Dollar Trading Strategy: Master the 3 Key Factors Affecting the Australian Dollar From Scratch The Australian dollar (AUD), due to its unique attributes as both a commodity currency and a risk currency, has become an excellent choice in the forex market where volatility and opportunities...2026 年 6 月 25 日
-
In-Depth Analysis: How Do Monetary Policy Shifts Affect Commodity-Related Currencies (Australian Dollar, Canadian Dollar)? When trading commodity-related currencies such as the Australian dollar (AUD) and Canadian dollar (CAD), you must never focus on a single economic data point alone. Their exchange rate trends are actually the result of a tug-of-war...2026 年 6 月 25 日


