Divergence Tutorial: Understand RSI/MACD Bearish and Bullish Divergence in One Article, Easily Capture Reversal Signals!
You often hear investment experts mention “bearish divergence” and “bullish divergence”, but do you truly understand what divergence means? When a stock or asset price reaches new highs yet the underlying technical indicators show weakness and fail to keep pace, this is an important warning from the market. This phenomenon, where price and indicators “behave inconsistently” is known as technical indicator divergence. This article will clearly explain “what divergence is” and teach you how to use the principles of bearish and bullish divergence with common indicators to anticipate potential market reversals and improve the accuracy of your trading decisions.
What Is Divergence? Understand the Core Definition in One Minute
Basic Meaning of Divergence: Price Movement and Technical Indicators “Out of Sync”
Imagine climbing a mountain: each step takes you higher than before (price makes a new high), but your energy declines and your breathing grows heavier (indicator drops). This suggests your upward momentum may not last, and a reversal could occur at any time. In technical analysis, “divergence” refers to a situation where the direction of an asset’s price movement is inconsistent, or even opposite, to the movement of technical indicators (such as RSI or MACD). Simply put, the price momentum fails to confirm the price trend.
Why Divergence Is an Important Market Reversal Warning Signal?
Divergence is crucial because it is a leading indicator. Most technical indicators lag behind price movements, but divergence can provide an early warning, indicating that the underlying strength of the current trend is weakening. When prices reach new highs or lows, the appearance of a divergence signal suggests the driving force behind the trend may be fading, and a market adjustment or reversal could follow. However, it is important to remember that divergence is a “warning”, not an “action signal”. It indicates a potential slowdown or reversal but does not guarantee it will occur. Authoritative financial websites like Investopedia also explain that divergence is an essential tool for assessing changes in trend momentum.
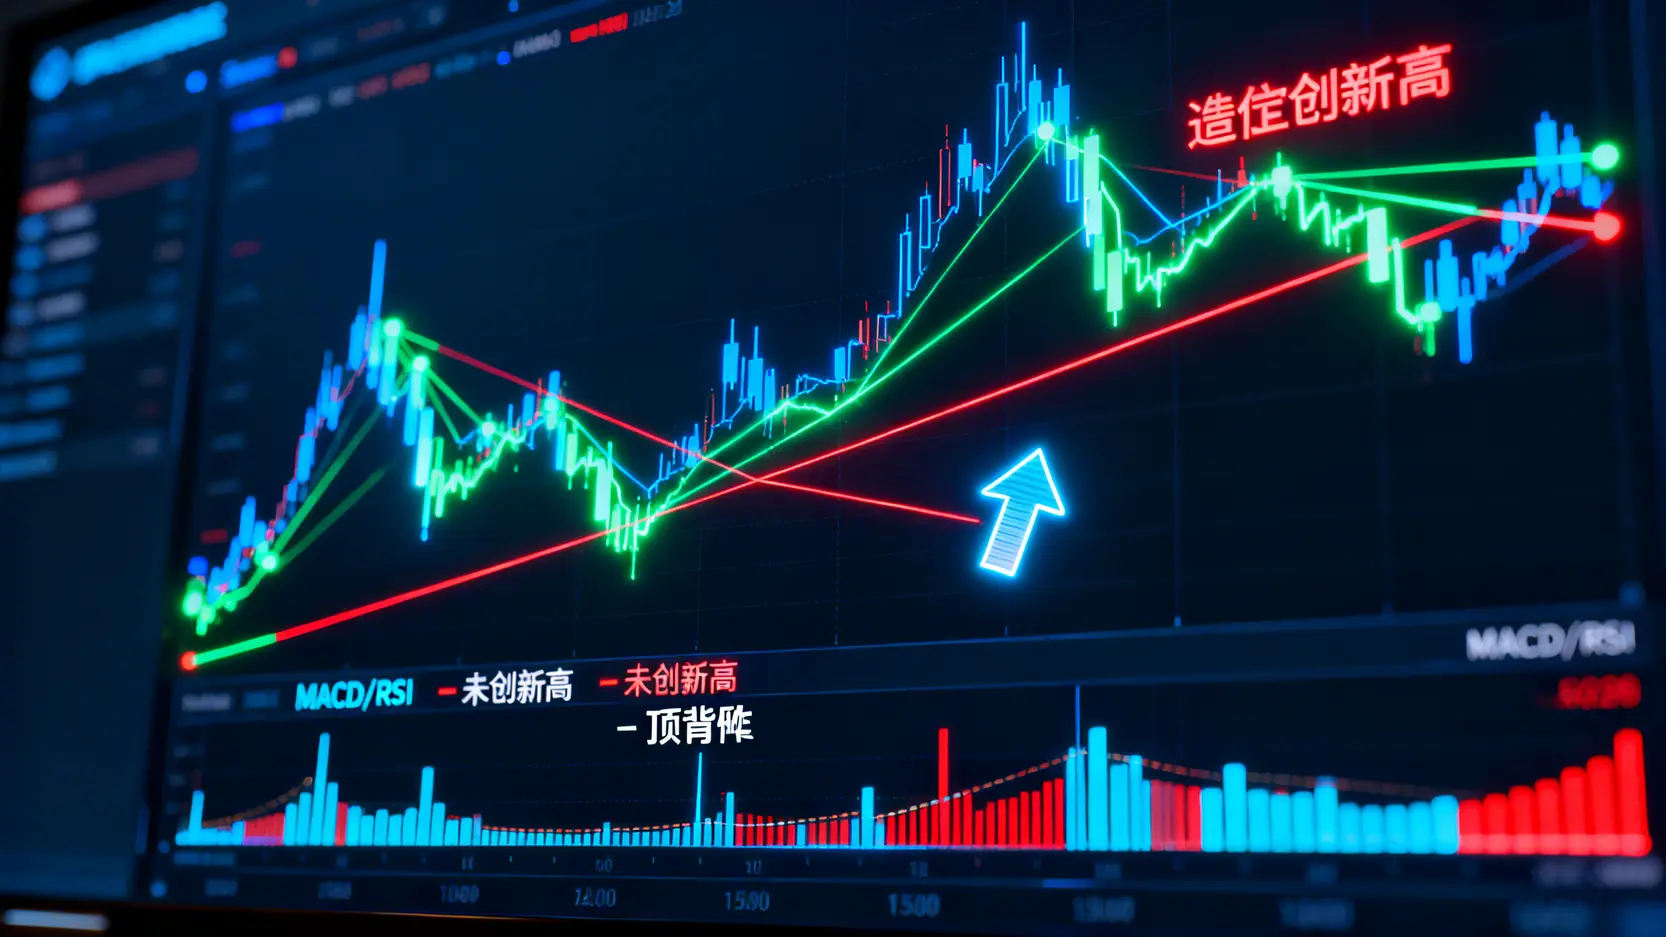
Two Main Types of Divergence: Bearish vs Bullish
After understanding divergence, you need to distinguish between the two main forms: “bearish divergence”, signaling potential declines, and “bullish divergence”, signaling potential rises.
Bearish Divergence: Price Makes a New High, Indicator Falls (Potential Downside Warning)
Also called “top divergence”, bearish divergence usually appears near the end of an uptrend. Be alert when the following occurs:
- Price Movement: Makes a “higher high”.
- Indicator Movement: Corresponding technical indicators fail to reach a new high, forming a “lower high” instead.
This pattern shows that although the price is still rising, the buying momentum behind it is waning, and the uptrend may reverse at any time. This serves as a potential sell or reduction warning.
Bullish Divergence: Price Makes a New Low, Indicator Rises (Potential Upside Signal)
Also called “bottom divergence”, bullish divergence usually forms at the bottom of a downtrend. Its characteristics are the opposite of bearish divergence:
- Price Movement: Makes a “lower low”.
- Indicator Movement: Corresponding technical indicators do not follow to a new low, forming a “higher low” instead.
This indicates that although the price is still declining, selling pressure is weakening, and market sentiment may be quietly improving. Bullish divergence is an important reference signal for potential buying or initiating long positions.
Further Reading (Highly Recommended)
RSI Tutorial: Understand the Relative Strength Index in One Article, from Overbought/Oversold to Divergence in 5 Practical Steps…
MACD Tutorial: Fully Understand Fast/Slow Lines, Histogram, Golden Cross, and Divergence!
How to Use Common Technical Indicators to Identify Divergence? (With Charts)
To effectively identify bearish and bullish divergence, momentum indicators are essential. RSI and MACD are the most widely used tools for observing divergence.
RSI Divergence Tutorial: Find Reversal Points from Overbought and Oversold Zones
The Relative Strength Index (RSI) is an excellent tool for measuring price momentum. Tips for using RSI to identify divergence:
- Bearish Divergence: Price makes a new high, but RSI peaks lower than the previous peak. The signal is stronger when the first peak is above 70 (overbought) and the second peak fails to surpass 70.
- Bullish Divergence: Price makes a new low, but RSI troughs are higher than the previous trough. This is especially notable when the first trough falls below 30 (oversold) and the second trough rises above 30, indicating a decline is losing strength. For more details on RSI, see the complete RSI tutorial.
MACD Divergence Tutorial: Observe Histogram Changes
The MACD histogram reflects the distance between the fast line (DIF) and the slow line (DEA). Using the MACD histogram to identify divergence is straightforward:
- Bearish Divergence: When price makes a new high, the corresponding histogram peak (positive value) is lower than the previous peak, indicating upward momentum is shrinking.
- Bullish Divergence: When price makes a new low, the corresponding histogram trough (negative value) is shallower than the previous trough (closer to the zero line), indicating downward momentum is weakening. For more MACD details, see the MACD tutorial.
Practical Case Analysis: Tesla (TSLA) Example
Consider an example of bearish divergence. Suppose Tesla (TSLA) rises strongly from $280 to $300, reaching a new high. During the same period, the daily MACD histogram shows that the histogram height at the second price peak is noticeably lower than the first peak. This forms a standard bearish divergence pattern. After this signal, the price may briefly spike higher but soon experiences a significant pullback, dropping from around $300 to $260. This example clearly demonstrates how bearish divergence can provide an early warning of weakening upward momentum.
Common Questions About Technical Indicator Divergence (FAQ)
Q: Are divergence signals always accurate? What are the limitations?
A: No technical indicator is 100% accurate, and divergence is no exception. Its main limitations include: 1. Multiple divergences may appear: in a strong trend, price may show 2–3 consecutive divergences before a true reversal occurs, so entering too early can lead to losses. 2. Signals may fail: sometimes after a divergence appears, the market may only enter a sideways consolidation rather than a trend reversal. Therefore, divergence should be treated as a warning and used in combination with other analysis tools (such as trendlines or support and resistance levels) for comprehensive judgment.
Q: Should I sell immediately after a bearish divergence appears?
A: Immediate action is not recommended. A mature trading strategy is to “wait for confirmation”. After a bearish divergence appears, you can wait for the price to break a key uptrend line or show a clear bearish candlestick pattern (such as Dark Cloud Cover or Engulfing) as confirmation before executing a sell or closing a position. Similarly, after a bullish divergence, wait for the price to break the downtrend line or display a bullish pattern before considering a buy.
Q: Besides RSI and MACD, which other indicators can reveal divergence?
A: Many momentum indicators can be used to observe divergence. In addition to the widely used RSI and MACD, the Stochastic Oscillator (KD), Momentum Indicator (MOM), and volume-related indicators like On-Balance Volume (OBV) can also be applied for divergence analysis. The core principle is the same: identify inconsistencies between price movements and indicator momentum.
Conclusion
In summary, understanding and mastering technical indicator divergence is an essential skill for every investor. Whether it is bearish divergence signaling weakening upward momentum or bullish divergence indicating a potential end to a downtrend, divergence provides valuable market insight and helps anticipate trend changes. However, remember that divergence is a warning signal that must be used alongside other analysis tools, not a standalone trading “holy grail.” By incorporating divergence analysis into your strategy and combining it with disciplined risk management, you can more effectively capture key market turning points.


