KD Indicator Tutorial: Master KD Value Usage in 5 Steps, From Parameter Settings to Complete Chart Analysis
For stock investment beginners, the hardest part is knowing “when to buy and when to sell”. Among the many technical indicators in the market, the KD indicator is definitely one of the most popular and easiest to use. But do you really understand how to read the KD indicator? Correctly understanding KD value usage can help you more accurately judge stock price trends, especially in mastering the timing of buying and selling. This article will guide you from basic to advanced, helping you fully grasp the core usage of the KD indicator, parameter setting techniques, and how to use stock KD chart analysis to identify the best golden cross and death cross signals, improving your investment success rate.
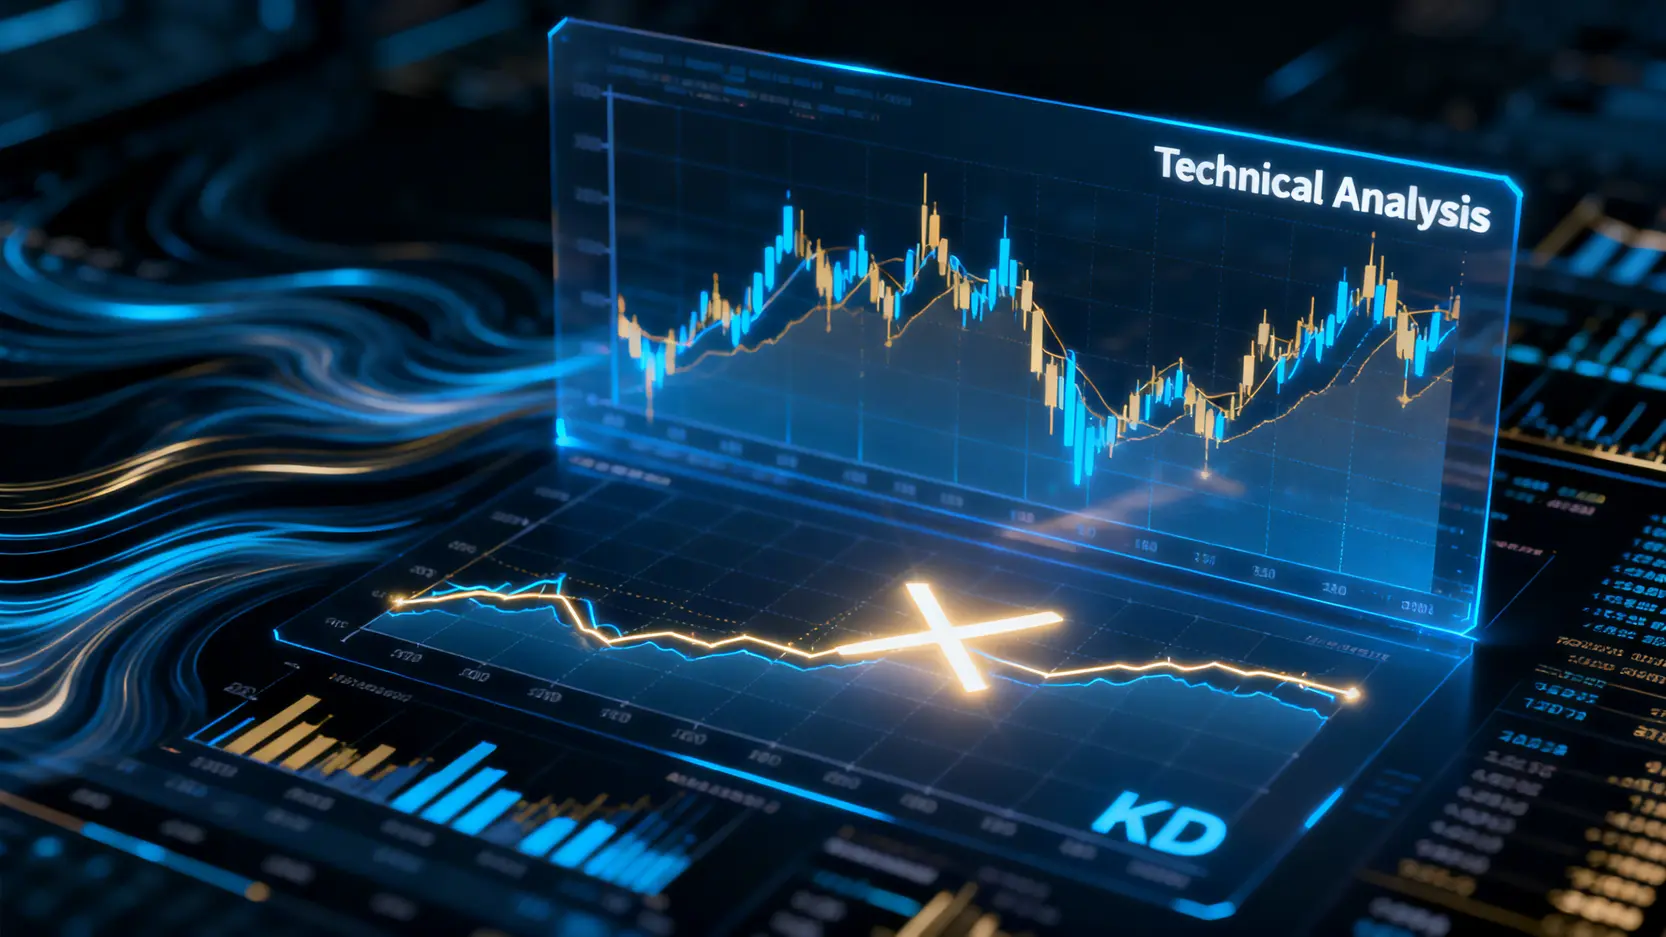
What Exactly Is the KD Indicator? Start With the Basic Concept
The KD indicator, fully named the Stochastic Oscillator, was developed by US analyst George Lane in the 1950s as a momentum indicator. It is mainly used to measure the position of a stock’s closing price relative to its price range over a certain period, thereby determining whether the market is in an overbought or oversold state. Simply put, the KD indicator can be seen as a market sentiment detector.
Composition of K and D Values: Difference Between Fast Line and Slow Line
The KD indicator consists of two lines: K value (fast line) and D value (slow line).
K Value (%K): This is the “fast line”, highly sensitive to stock price changes. It calculates the relative position of the current closing price within the high-low range of the recent period (usually 9 days). If the closing price is near the recent high, the K value will be high; if near the low, the K value will be low.
D Value (%D): This is the “slow line”, essentially a moving average of the K value. Because it is smoothed, the D value fluctuates more gently than the K value, mainly to confirm signals from the K value and filter out short-term market noise.
On charts, when the sensitive K line crosses upward through the relatively stable D line, it forms an important buy signal, and vice versa. This is what we will explain in detail later as the “golden cross” and “death cross”.
Basic Calculation Principle of the KD Indicator (What Is RSV?)
To fully understand KD values, you first need to know the concept of “RSV” (Raw Stochastic Value). RSV reflects the relative strength of today’s closing price within the price range of the past N days (commonly 9 days).
The calculation formula is as follows:
RSV = (Today’s Closing Price – Lowest Price in N Days) / (Highest Price in N Days – Lowest Price in N Days) × 100
After obtaining RSV, K and D values are calculated using a weighted moving average method:
Today’s K Value = (Previous Day K Value × 2/3) + (Today’s RSV × 1/3)
Today’s D Value = (Previous Day D Value × 2/3) + (Today’s K Value × 1/3)
Seems complicated? Don’t worry! All stock trading software calculates this automatically. You just need to understand that the K value is based on the latest stock price strength (RSV), and the D value is a smoothed version of K. For deeper study, you can refer to Wikipedia’s explanation of the Stochastic Oscillator.
How to Read KD Values? Full Breakdown of 3 Core Uses
After learning the basic concepts, we move to the core part: KD value usage. Mastering the following three core uses means you’ve already succeeded in more than half. These techniques are essential for stock KD chart analysis.
Buy Signal: Identify the Best Timing for a “Golden Cross”
The “golden cross” is the classic buy signal of the KD indicator, especially reliable after a price decline. Identification is simple:
Condition: K line (fast line) crosses upward through D line (slow line).
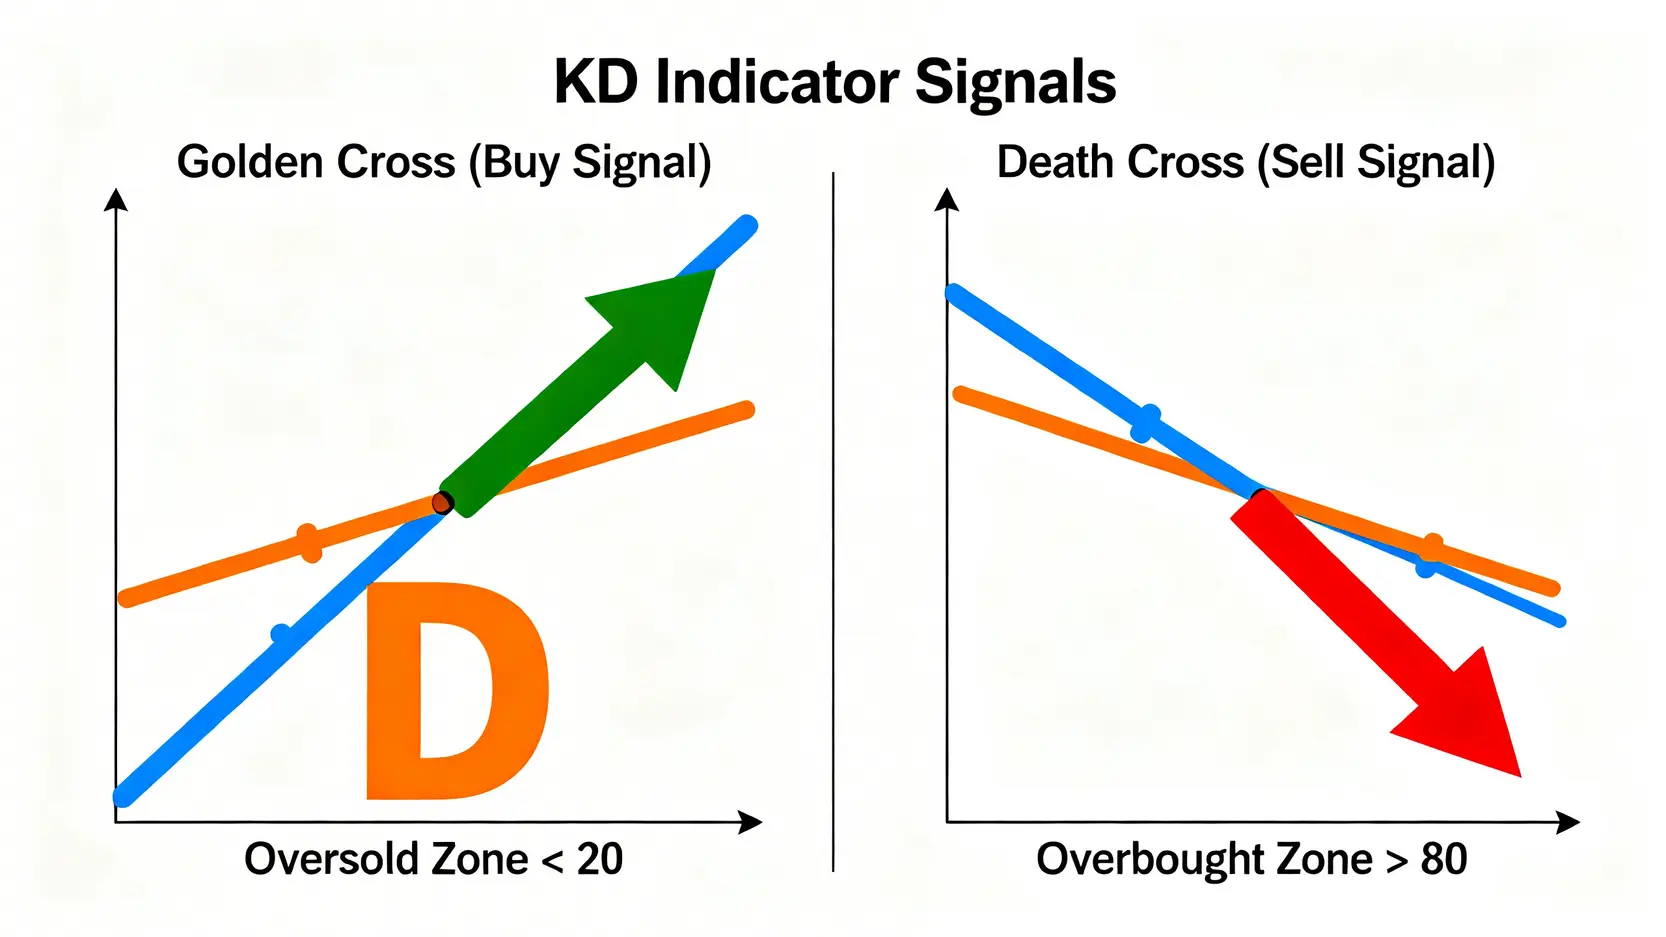
Position: If the cross occurs below KD value 50, especially near 20 in the “oversold zone”, the signal is stronger.
Interpretation: The golden cross indicates rising momentum is strengthening, and a rebound or uptrend may follow shortly. Investors can consider buying in batches at this time.
Practical Tip: It’s best to observe volume as well. If the golden cross coincides with a significant volume increase, it indicates strong capital support, greatly enhancing the reliability of the buy signal.
Sell Signal: Understand the “Death Cross” to Avoid Losses
Opposite to the golden cross, the “death cross” signals a potential need to sell or reduce holdings, especially when the stock is at a high level.
Condition: K line (fast line) crosses downward through D line (slow line).
Position: If the cross occurs above KD value 50, especially near 80 in the overbought zone, it indicates the stock may have peaked, and the signal should be carefully watched.
Interpretation: The death cross indicates weakening upward momentum and increasing downward pressure, possibly marking the start of a trend reversal or adjustment period. Consider taking profits or setting stop-loss orders at this time.
Practical Tip: If the death cross occurs with a large high-level volume spike (e.g., a long upper shadow), it is a very strong warning signal.
Chart Illustration: Golden Cross (Buy Signal) and Death Cross (Sell Signal) of the KD Indicator
Market Sentiment Indicator: Interpreting Overbought Zone (>80) and Oversold Zone (<20)
KD values themselves measure market sentiment, ranging from 0 to 100. Observing which zone the KD value is in helps determine market sentiment.
Overbought Zone: KD Value > 80 When KD exceeds 80, market sentiment is extremely optimistic, and stock prices rise sharply in the short term. Buying power has been largely exhausted. Although prices may continue to rise, the risk of a pullback increases. In the overbought zone, it’s not recommended to chase high buys; instead, watch for sell signals.
Oversold Zone: KD Value < 20 When KD drops below 20, market sentiment is extremely pessimistic, and prices have fallen sharply in the short term, with selling power nearly depleted. While prices may continue to seek a bottom, rebounds can occur at any time. In the oversold zone, avoid panic selling and start watching for golden cross or other buy signals.
Remember, overbought does not mean immediate selling, and oversold does not mean immediate buying; they are just “reminders” that risk or opportunity is brewing and should be interpreted together with cross signals.
KD Parameter Setting Guide: Choosing the Wrong Parameters Makes the Indicator Useless!
Many investors ignore the importance of KD parameter settings. Different parameter combinations directly affect the indicator’s sensitivity and signal frequency. Using the wrong parameters can lead to constantly chasing highs and cutting lows, so choose according to your trading style.
Most Common Parameters (9,3,3): What Do They Mean?
In most stock software, the default KD parameters are (9,3,3), representing:
9: Time period for calculating RSV, using the highest and lowest prices of the past 9 trading days.
3: Smoothing factor for K value.
3: Smoothing factor for D value.
This (9,3,3) parameter set is widely used in the market, suitable for most medium- to short-term swing trading, balancing sensitivity and stability well.
How to Adjust Parameters for Short-Term or Long-Term Investing?
There is no universal parameter set. Adjust according to your investment cycle and risk preference:
Short-Term Traders (Day Trading / Scalping): If you pursue quick reactions, you can reduce the first parameter (RSV period), e.g., use (5,3,3). This makes the KD indicator more sensitive, capturing small price fluctuations faster, but also generates more false signals, requiring stronger judgment.
Long-Term Investors (Swing Trading / Position Trading): If focusing on long-term trends and filtering short-term noise, increase the parameters, e.g., (18,3,3) or (24,3,3). The larger the parameters, the smoother the KD lines, with fewer signals, but higher reliability when signals appear, suitable for judging major trends.
Adjustment Suggestion: Beginners can start with the default (9,3,3) and adjust after becoming familiar, finding the parameter combination that fits their trading rhythm. The most important thing is consistency, do not change randomly.
Once you have mastered the basic KD value usage, you can learn the following two advanced techniques, which can help you analyze stock KD charts more deeply and even anticipate potential price reversals.
High/Low-Level Stagnation: A Strong Signal of Trend Continuation
Sometimes you may notice that after KD values enter the overbought zone (>80) or oversold zone (<20), prices do not immediately pull back or rebound but instead move sideways at high or low levels. This phenomenon is called “stagnation”, and many beginners make mistakes at this stage.
High-Level Stagnation (KD Value Persistently > 80): When KD values remain above 80 for several consecutive days (usually more than 3), with the K line even running close to 100, this is not simply overbought but a signal of a very strong upward trend. It indicates extremely strong buying power, and prices are unlikely to turn back in the short term. Selling too early may cause you to miss the largest gains. The correct approach is to hold and observe until KD falls below 80 before considering reducing positions.
Low-Level Stagnation (KD Value Persistently < 20): Conversely, when KD values remain below 20 for several consecutive days, it indicates a very weak downward trend. Selling power dominates the market, and prices are unlikely to rebound in the short term. Do not rush to buy at the bottom, as lower prices may still exist. The correct approach is to wait until KD breaks above 20 before considering potential entry opportunities.
KD Indicator Divergence: Key to Anticipating Price Reversals
“Divergence” is a very important early warning signal of a trend reversal and one of the essences of technical analysis. It occurs when price trends and KD indicator trends move in opposite directions.
Bearish Divergence: When the stock price reaches a new high but the KD indicator’s peak is lower than the previous peak. This suggests that although prices are still rising, upward momentum is weakening, like a car running out of fuel, ready to stall. Bearish divergence is a strong topping signal, indicating a high chance of a price reversal downward.
Bullish Divergence: When the stock price reaches a new low but the KD indicator’s low point is higher than the previous low. This indicates that although prices are still falling, downward momentum is weakening and selling power is diminishing. Bullish divergence is a potential bottoming signal, suggesting the price may soon rebound or reverse upward.
Chart Illustration: KD Indicator Divergence: A Key Signal Indicating Potential Trend Reversal.
Divergence provides an earlier warning than golden/death crosses but requires more experience to interpret. Combining it with other indicators, such as volume or trendlines on MT4 charts, can improve accuracy.
Common Questions About the KD Indicator (FAQ)
Q: Is the KD indicator 100% accurate? Are there limitations?
A: Absolutely not. No technical indicator can be 100% accurate. The main limitations of the KD indicator are: first, in extremely strong trends (continuous rises or falls), the KD indicator may give false signals due to early entry into overbought/oversold zones or stagnation. Second, it reacts well in sideways (range-bound) markets but may fail in strong one-sided trends. Third, it is a lagging indicator, meaning signals appear after actual price turning points. Therefore, the KD indicator should be used as an auxiliary tool, not the sole basis for decisions.
Q: Which indicators can be combined with the KD indicator for better results?
A: Certainly, a combination is strongly recommended. The KD indicator, being a momentum indicator, works well with trend indicators. Common combinations include: 1. KD + MACD: Use MACD to determine the overall direction (bullish or bearish), then use KD to identify precise entry and exit points. 2. KD + Moving Average (MA): Use MA to identify support and resistance levels; for example, if prices stabilize above the MA and KD shows a golden cross, the buy signal is more reliable. 3. KD + Volume: Volume reflects capital flow. Any KD signal confirmed by volume (e.g., golden cross with increased volume) greatly improves success rates.
Q: Why does the KD indicator sometimes “stagnate” and appear ineffective?
A: KD stagnation is not “ineffective” but reflects an extreme market trend. The root cause is the calculation principle of the KD indicator, which is based on the “closing price’s relative position within the recent price range”. When a stock is continuously strong, daily closing prices remain near recent highs, causing RSV values to approach 100, and K and D values stay above 80, forming high-level stagnation. The reverse applies for low-level stagnation. When stagnation occurs, recognize it as a strong trending market and avoid using traditional overbought/oversold logic to trade against the trend.
Q: What are the differences between daily, weekly, and monthly KD charts?
A: The differences are significant, mainly reflecting time periods and signal stability Daily KD: Responds fastest, suitable for short-term traders but produces the most false signals Weekly KD: Reflects mid-term trends, relatively stable signals, suitable for swing traders. Weekly golden or death crosses often indicate trends lasting several weeks to months. Monthly KD: Reflects long-term trends, most stable signals but slowest to respond, suitable for long-term investors. Monthly KD cross signals may appear only once in several years but usually indicate major market shifts. Generally recommended: “look at weekly for long-term, daily for short-term”, combining different KD periods for analysis.
Conclusion
In summary, to truly master how to read the KD indicator, you need to combine the three core uses: golden cross, death cross, and overbought/oversold zones, and adjust KD parameters according to your investment style. Advanced users should also learn to interpret stagnation and divergence, which are key to enhancing your stock KD chart analysis skills. While no indicator is perfect, learning to correctly use the KD indicator can significantly improve your judgment accuracy, helping you find clearer directions in a complex stock market. To improve your investment success rate, start applying the KD indicator in your practical analysis today!
How to Get Started with Bitcoin? The Complete 2026 Bitcoin Buying Guide for Beginners After watching Bitcoin repeatedly reach new highs in recent years and successfully pass spot ETF reviews in the US and Hong Kong in 2024, officially entering mainstream financial markets, many investors have turned their attention to...
Is Gold’s V-Shaped Rebound a Bottom-Fishing Signal? A Complete Guide to Trading Strategies Amid “$100 Price Swings” What Is a Gold V-Shaped Rebound? More Than Just a Technical Pattern The gold market has recently experienced sharp rises and falls, with prices frequently displaying dramatic “gold V-shaped rebounds”. Single-day “$100 price...
What Is PPI Data? 2026 Latest Analysis: Understand the Differences from CPI and How It Affects Stock Market Trends With market information constantly changing, do you always hold your breath while waiting for CPI data to be released? But did you know that a more forward-looking inflation indicator, PPI data...