Volume-Price Analysis 2026: Confirmation & Divergence

Updated: 2026/02/27  |  CashbackIsland

【量價關係教學】從量價配合到背離,8大經典圖解一次看懂!

Do you often stare at candlestick charts yet have no idea what the trading volume below actually means? Why does the stock price keep rising while volume continues to shrink? In fact, trading volume is one of the most honest indicators in the market, revealing the true intentions behind capital flows. Once you learn how to interpret the “volume-price relationship”, you can gain insight into major players’ movements, capture early breakout points, and avoid distribution zones. This comprehensive volume-price relationship tutorial takes you from the basics of volume-price confirmation to advanced interpretation of volume-price divergence, while also uncovering the secrets of volume accumulation zones, helping you fully master this core element of technical analysis and improve your trading win rate. 


What Is the Volume-Price Relationship? Why Do “Beginners Watch Price, Veterans Watch Volume”?

In the stock market, there is a well-known saying: “Beginners watch price, veterans watch volume, experts watch positioning”. This phrase highlights the central role of trading volume in technical analysis. Price movements may be full of false signals and traps, but trading volume represents real money committed by market participants and is much harder to fake. Understanding the volume-price relationship is a crucial step in moving from a beginner to a more experienced trader.


Definitions of “Volume” and “Price”: The Basic Concepts of Trading Volume and Stock Price

  • Price: Refers to the transaction price of a stock, representing the consensus between buyers and sellers on its current value. The red and green candlesticks on a chart record price fluctuations over a given period. Price reflects “market sentiment”.
  • Volume: Refers to trading volume, meaning the total number of shares traded within a specific period (such as a day or a week). It represents the level of market activity and participant commitment. Volume reflects “market force”.

Simply put, price is the visible outcome of a trend, while volume is the energy that drives it. Price movement without volume is like a sports car without fuel: it will not go far and lacks credibility. 


The Importance of Trading Volume: The Key to Judging Trend Strength and True or False Breakouts

The greatest value of trading volume lies in “confirmation”. It helps us determine whether current price movements are real and healthy, or merely short-lived illusions. For example:

  • Confirming trend strength: An uptrend accompanied by steadily increasing volume indicates strong market consensus and a higher likelihood that the trend will continue. Conversely, rising prices with shrinking volume may signal only a weak rebound.
  • Identifying true or false breakouts: When price breaks through a key resistance level and volume surges sharply, it represents a “volume-backed breakout”, with a higher probability of holding above the level. If volume fails to follow, caution is needed, as it may be a “false breakout” and price could quickly fall back.


Trend Confirmation Signals: Instantly Understanding Healthy “Volume-Price Confirmation” Patterns

“Volume-price confirmation” represents the healthiest state of a market trend, where price movement and volume direction align. This is a strong signal that a trend is likely to continue. There are two fundamental patterns:

量價配合示意圖,左側為價漲量增,右側為價跌量縮,展示健康的趨勢型態。

Illustration: Healthy volume-price confirmation patterns, rising price with increasing volume (left) and falling price with decreasing volume (right).


Rising Price With Increasing Volume: The Most Classic Bullish Attack Signal

This is the most classic and easily recognizable bullish signal. When stock prices rise while trading volume simultaneously expands, forming a “rising price with increasing volume” pattern 📈

  • Market Interpretation: This indicates very strong buying interest in the market, with investors willing to chase prices higher and continuous capital flowing in. Buying pressure is sufficient to support further upward movement.
  • Trading Strategy: In an uptrend, rising price with increasing volume confirms a healthy trend, and investors holding long positions can continue to hold. If price has just launched from a bottom area, this pattern is often a very good entry signal.


Falling Price With Decreasing Volume: Bearish Momentum Fades, and the Trend May Slow

When the stock price falls but trading volume gradually shrinks, it forms a “falling price with decreasing volume” condition.

  • Market Interpretation: This means that although price is still moving lower, fewer and fewer sellers are willing to sell at lower levels, and selling pressure is easing. Bearish strength is fading, and the downtrend may be nearing its end or pausing.
  • Trading Strategy: This is not a buy signal in itself, but it is a warning that short positions should consider scaling out in stages. For investors looking to catch a rebound, they can begin monitoring and wait for a subsequent “rising price with increasing volume” signal before entering.


Trend Reversal Warning: How to Interpret “Volume-Price Divergence”?

When price movement and trading volume move in opposite directions, it is called “volume-price divergence”. This is a very important reversal warning, reminding us that the current trend may be running out of steam and could reverse at any time. Understanding how to interpret volume-price divergence can help you identify risks or opportunities earlier than others.

量價背離示意圖,包含頂背離(價漲量縮)與底背離(價跌量增)的圖解。

Illustration: Key reversal warning signals, a top divergence (left) and a bottom divergence (right).


Top Divergence (Rising Price With Decreasing Volume): A Warning of Insufficient Upward Momentum

“Top divergence” is a warning signal that appears near the end of an uptrend. When stock prices keep making new highs, but the corresponding trading volume becomes lower with each wave and fails to keep pace with price.

  • Market Interpretation: This suggests that although prices still appear strong on the surface, the buying momentum chasing higher prices is actually weakening. Large players or major capital may be gradually selling their holdings to retail investors while pushing prices higher, which is often referred to as “marking up to distribute”. This is a classic case of “price and volume not matching”.
  • Trading Strategy: When top divergence appears, caution should be raised. Prices may not fall immediately, but it indicates that upside risk has increased significantly. At this point, it is not advisable to chase higher prices. Investors holding long positions should consider gradually reducing exposure or setting stricter take-profit levels.


Bottom Divergence (Falling Price With Increasing Volume): A Potential Turning Point in a Decline

“Bottom divergence” typically appears near the end of a downtrend. When stock prices keep breaking lower and making new lows, trading volume does not shrink. Instead, it begins to expand, and may even spike sharply.

  • Market Interpretation: With continued price declines, selling pressure should theoretically be heavy. However, rising volume indicates substantial turnover at lower levels. This usually points to two possibilities: first, retail investors panic-selling and stopping out, dumping their positions entirely, (known as “panic selling with a price-volume mismatch”). Second, major capital considers prices attractive and starts absorbing selling pressure heavily at lower levels. Either way, it suggests downward momentum may be close to exhaustion. For a deeper understanding, you can refer to professional analysis on the authoritative financial website Yahoo Finance.
  • Trading Strategy: Bottom divergence is a potential bottoming signal, but it does not mean you should enter immediately. Smart investors treat it as a watchlist signal, waiting until price stops making new lows and a key bullish candlestick appears with expanding volume, before considering scaling in gradually.


The Main Players’ Secret Base: How to Interpret “Volume Accumulation Zones”?

Beyond observing day-to-day volume-price relationships, analyzing the distribution of trading volume over a period of time, known as “volume accumulation zones”, can better help us identify key support and resistance levels and see through the cost bases of major market players.


What Is a Volume Accumulation Zone (Volume Profile)?

A volume accumulation zone, often referred to in charting software as a “volume profile”, does not display daily trading volume. Instead, it aggregates trading volume over a selected period based on “price” and displays it as horizontal bars along the side of the candlestick chart.

The longer the bar, the greater the total volume traded within that price range. Conversely, shorter bars indicate relatively sparse trading volume.


Using Volume Accumulation Zones to Identify Key Support and Resistance Levels

Volume accumulation zones represent the market’s “memory”. Areas with dense trading volume indicate price levels that buyers and sellers focused on most over a given period, and therefore tend to form strong support or resistance.

成交量堆積區(量能分佈圖)示意圖,展示高成交量區域如何形成關鍵的支撐與壓力位。

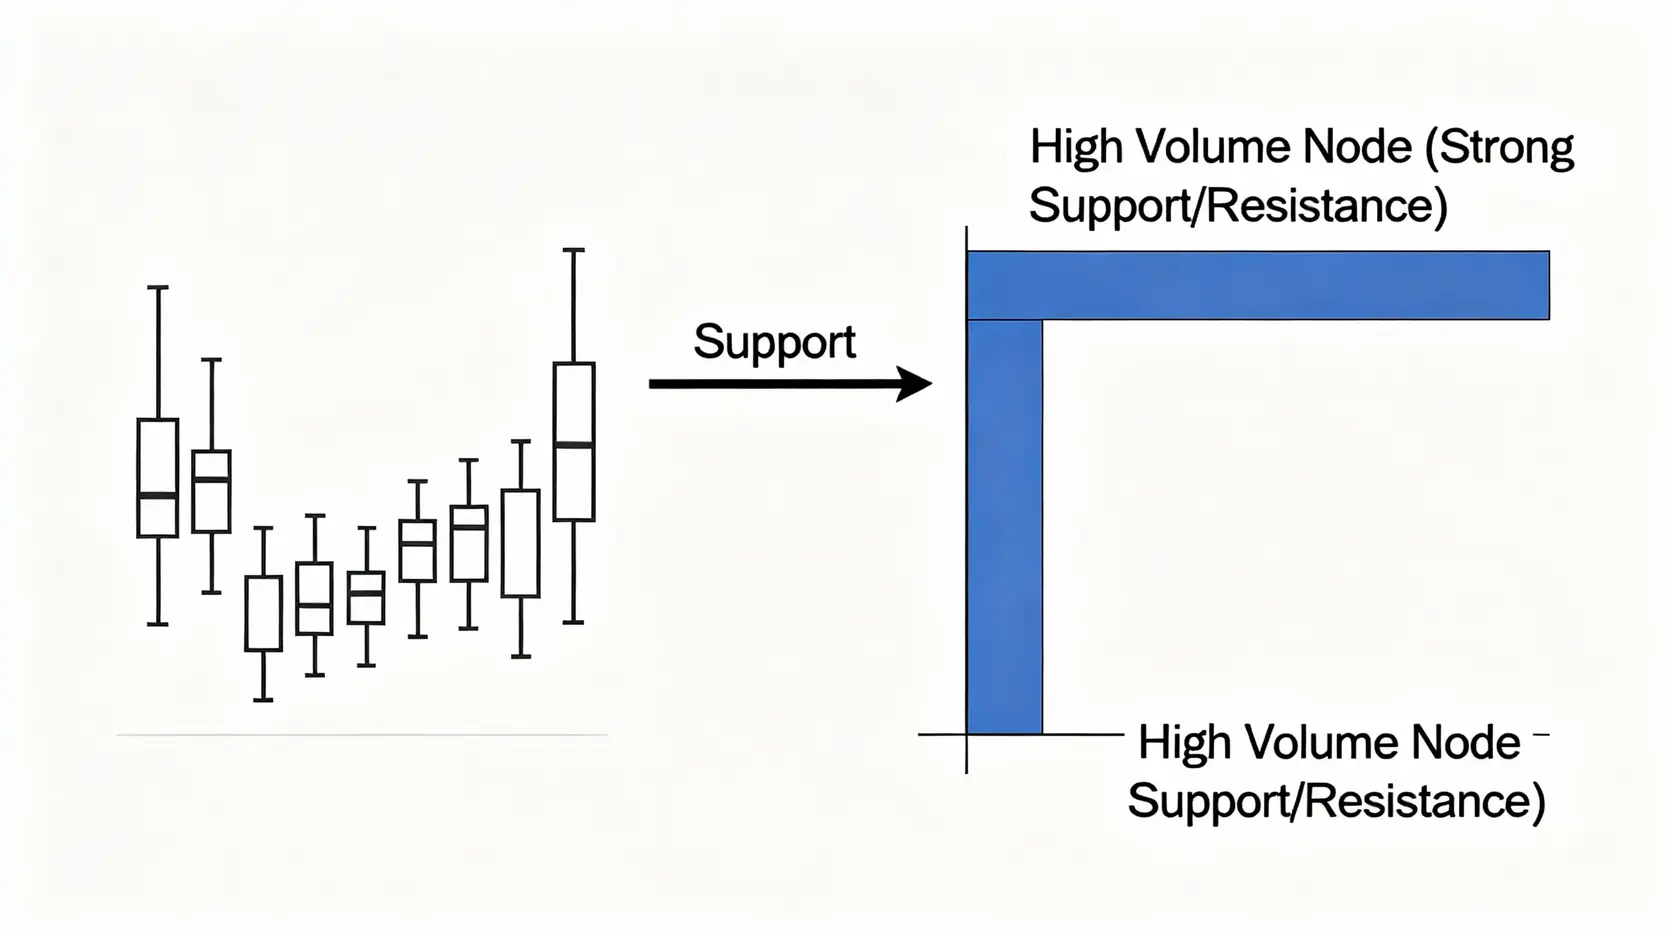
Volume accumulation zones (Volume Profile) are the main players’ secret base. Areas with concentrated trading volume tend to form strong support or resistance.

  • As Support: If the current price is above a volume accumulation zone, that zone often becomes strong support when prices pull back. This is because a large number of investors who bought in this area are in profit and are inclined to defend this price level, preventing the price from falling below their cost base.
  • Resistance: If the current price is below a volume accumulation zone, that zone often becomes significant resistance when prices rise. This is because many investors who bought in this area are trapped. Once prices rebound to this level, heavy selling pressure from investors seeking to break even may emerge, hindering further upside.

By observing volume accumulation zones, you can effectively identify which price levels are the market’s “key battlegrounds” and formulate more precise trading strategies. Identifying critical support and resistance levels is a fundamental skill every trader must master.


Common Questions About Volume-Price Relationships (FAQ)

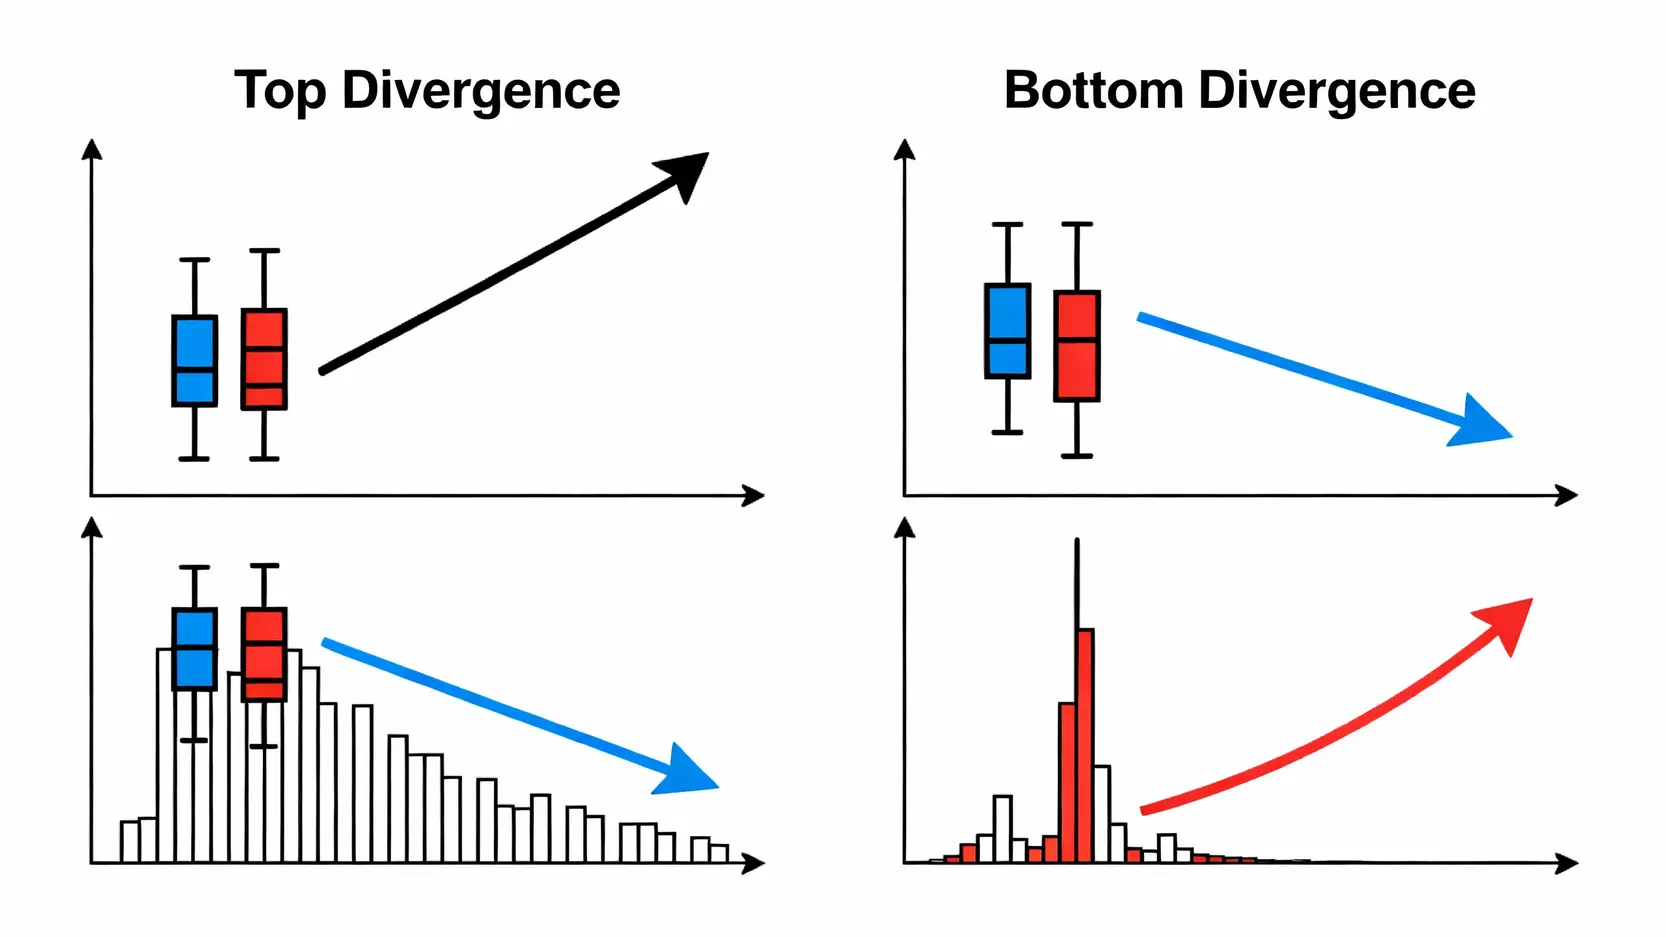
Q: After volume-price divergence appears, will the stock price definitely reverse immediately?

A: Not necessarily. Volume-price divergence is a very important “warning signal”, not an “absolute trading signal”. It reminds us that trend momentum is weakening and risk is increasing. After a top divergence, prices may still make new highs, (known as “divergence after divergence”). After a bottom divergence, prices may also continue to make new lows. Therefore, after seeing a divergence signal, it is necessary to combine other signals such as well-established candlestick patterns (for example, engulfing patterns or morning stars), breaks or rebounds of trendlines, and make a comprehensive judgment to improve the win rate.

Q: Should trading volume be analyzed on daily, weekly, or monthly charts to be more accurate?

A: This depends on your trading horizon and strategy. Generally speaking:

  • Short-term traders (day trading, overnight trading): Focus more on intraday charts (such as 5-minute or 15-minute candlesticks) and daily volume to capture short-term volume spikes and exhaustion signals.
  • Swing traders: Primarily reference daily and weekly volume-price relationships. Daily charts are used to find precise entry and exit points, while weekly charts are used to determine whether the medium- to long-term trend direction has changed.
  • Long-term investors: Place greater emphasis on weekly and monthly volume-price structures. Large volume at weekly-level bottoms is often an important signal of long-term trend reversal.

Volume-price relationships across different timeframes do not conflict. Long-term trends protect short-term analysis, and short-term signals validate long-term trends, making the overall judgment more comprehensive.

Q: How can volume-price relationships be used to distinguish between major players’ “shakeouts” and “distribution”?

A: This is an advanced application of volume-price analysis. The two may look similar on candlestick charts, but trading volume is the key differentiator:

  • Shakeout: Usually occurs in the early or middle stages of an uptrend. Major players deliberately push prices down to scare off followers and create panic. The characteristic is a sharp price drop accompanied by “rapidly shrinking volume”, indicating that chips are still locked by major players and there is no large-scale selling. After the shakeout ends, prices often recover quickly and make new highs.
  • Distribution: Most commonly occurs at high levels after a prolonged price advance. Major players gradually sell their holdings to retail investors in this zone. The characteristic is prices consolidating at high levels and appearing strong, while volume remains “consistently high or expanding”, and may even show repeated “rising price with decreasing volume” top divergences. Prices struggle to move higher despite heavy volume, which is a sign that major players are quietly transferring chips.


Conclusion

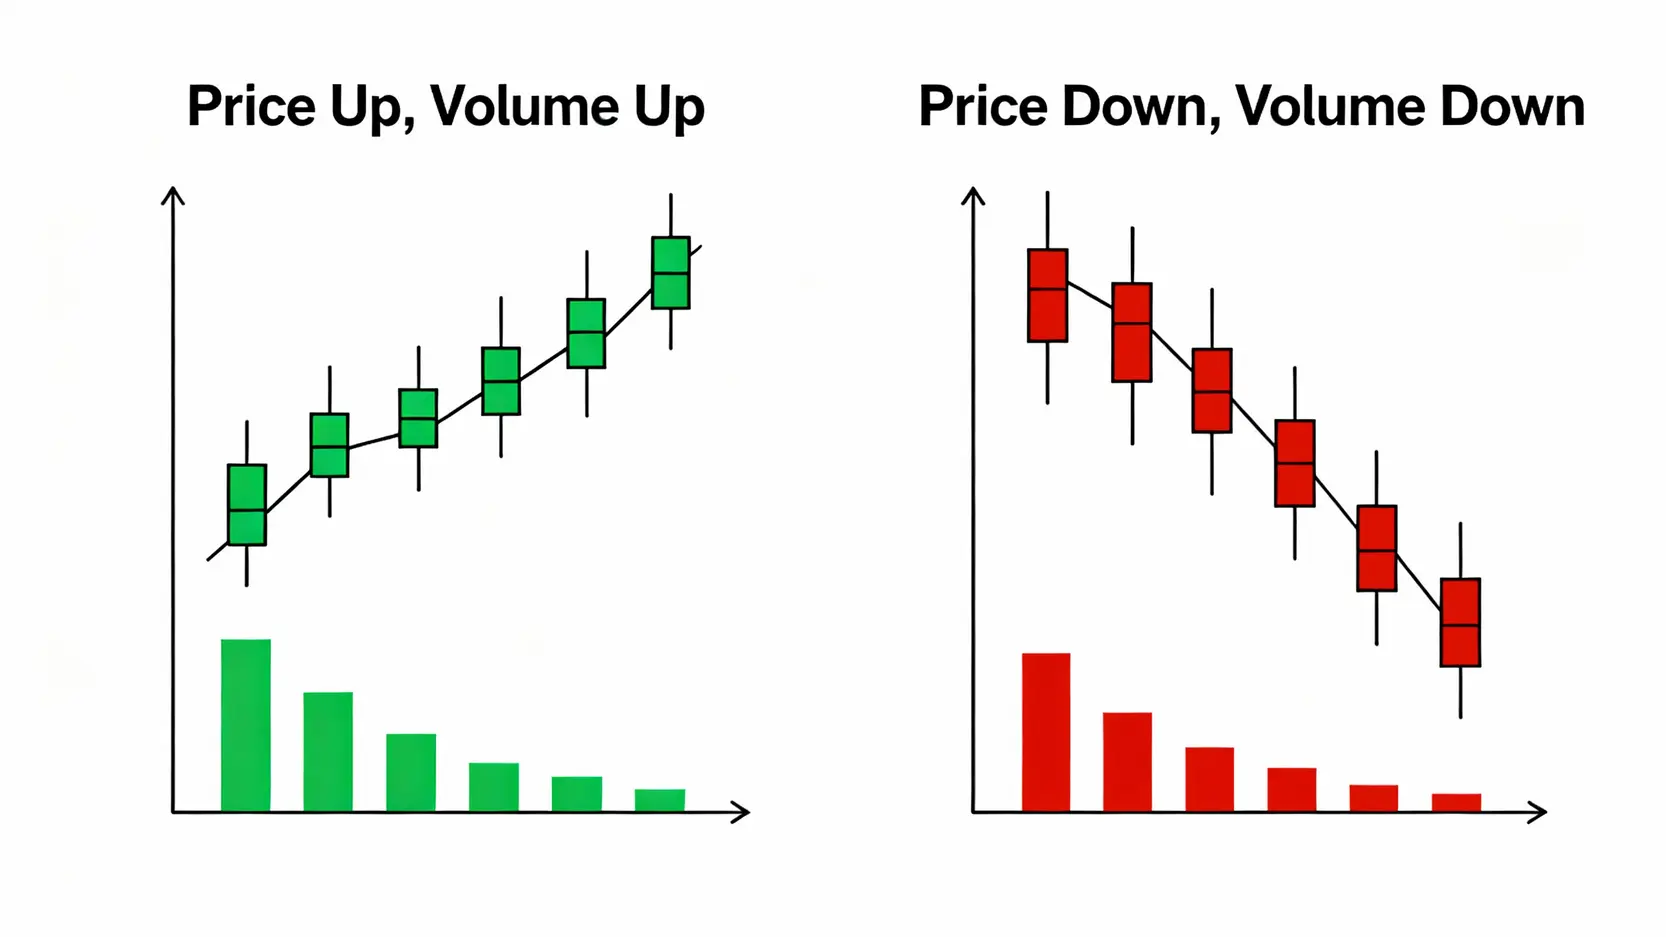
In summary, relying solely on price movements can easily lead to being misled by market illusions. By combining trading volume with a comprehensive analysis of “volume-price relationships”, you can more accurately assess the true balance between bullish and bearish forces. From understanding volume-price confirmation for trend validation, to recognizing volume-price divergence as a reversal warning, and further using volume accumulation zones to identify key battleground levels, these are essential lessons every investor should master. We hope this volume-price relationship tutorial helps you build a more complete analytical framework, allowing trading volume to become your trusted ally in navigating the market and making more informed investment decisions.

If you liked this article, please share it!

Related Articles

  • FedWatch Guide: Predict Rate Hikes Before the Market
    Rate Hike Expectations Trading Guide: Use FedWatch to Predict Rate Hikes and Position Ahead of the Market Core Concept: Why Trade “Expectations” Instead of “Facts”? After spending enough time in the financial markets, you will notice an interesting phenomenon: the market often completes a major move before the Federal Reserve...
    2026 年 6 月 25 日
  • Monetary Policy Shifts: Hawkish vs Dovish Guide
    What Is a Monetary Policy Shift? Understand Hawkish and Dovish Signals to Position Ahead of the Market Why does the market always hold its breath for the results of Federal Reserve (Fed) meetings? Why can every interest rate decision, and even a slight “shift” in wording, always trigger sharp volatility...
    2026 年 6 月 25 日
  • 2026 Australian Dollar Trading Strategy Guide
    Ultimate Guide to 2026 Australian Dollar Trading Strategy: Master the 3 Key Factors Affecting the Australian Dollar From Scratch The Australian dollar (AUD), due to its unique attributes as both a commodity currency and a risk currency, has become an excellent choice in the forex market where volatility and opportunities...
    2026 年 6 月 25 日
返回顶部