Volume Indicator Guide 2026: VWAP & Order Flow Strategy

Have you often watched prices rise but hesitated to chase, or seen prices fall without knowing whether you should sell? The problem may be that you have overlooked the market’s most honest signal, “trading volume”. Trading volume is the fuel that drives price movement. Price action without volume is like a sports car without an engine, impressive on the surface but lacking substance. This article will take you step by step from the ground up, clearly explaining the core concepts of volume indicators, including the most important Volume-Weighted Average Price (VWAP), volume moving average settings, and how to conduct large order volume analysis, enabling you to see through the true intentions of major capital at a glance and enhance the quality of your trading decisions.
Why Are Volume Indicators a Core Requirement in Technical Analysis?
Among the many technical indicators, volume indicators hold an indispensable position because they directly reflect market participation and capital activity. Prices can be manipulated in the short term, but real capital flows are difficult to conceal. Understanding volume is equivalent to holding the key to seeing through the underlying logic of the market.
Volume Leads Price: How Trading Volume Signals Future Price Movements
There is an old saying in the market: “Volume comes before price”. This means changes in trading volume often precede sharp price movements. Imagine a stock that has been consolidating at the bottom for a long time. If trading volume suddenly begins to expand moderately, even if price has not moved much, it may indicate that major capital is quietly accumulating positions, and a subsequent rally could be imminent. Conversely, if at the top of a long-term uptrend, prices continue to make new highs while trading volume starts to shrink, forming a “volume-price divergence”, this is a dangerous warning sign. It indicates insufficient willingness to chase higher prices, and the trend may reverse at any time.
Identifying Real and False Breakouts: Using Volume to Confirm Trend Strength
“Breakouts” are a favored entry signal for many traders, but “false breakouts” are a common trap. How can they be distinguished? Trading volume is the best filter. A genuine price breakout (whether breaking above resistance or below support) is usually accompanied by a significant expansion in trading volume. This indicates that the market has reached a consensus on the new price direction, and the likelihood of trend continuation is high. In contrast, if a breakout occurs on thin volume, or even lower-than-usual volume, it is likely a bull trap or bear trap, and price may quickly return to its previous range. Learning to use volume to validate breakouts can help you avoid many unnecessary losses.
Core Indicator One: Practical Analysis of the Volume-Weighted Average Price (VWAP)
Among all volume indicators, VWAP is undoubtedly one of the most closely watched by institutional investors and day traders. It is not merely a number, but the “lifeline” of intraday bulls and bears.
What Is VWAP, and How Is It Different From a Regular Moving Average?
VWAP stands for Volume-Weighted Average Price. It is calculated by dividing the “total traded value” from the market open to the current moment by the “total traded volume”, resulting in a volume-weighted average price. For a deeper definition, you can refer to the authoritative explanation on Investopedia.
The biggest difference between VWAP and a traditional Moving Average (MA) lies in the following:
- MA: Considers only “price”, simply averaging closing prices over a period, with each day’s price given equal weight.
- VWAP: Consider both “price” and “trading volume”. Prices with larger trading volume have a greater influence on VWAP.

Simply put, VWAP represents the “average holding cost” of all market participants for the day. As a result, this price level carries strong psychological significance and often acts as an important area of support or resistance.
VWAP Calculation and Practical Application: The Lifeline for Judging Intraday Bullish and Bearish Strength
In practice, the application of VWAP is very intuitive:
- Price Above VWAP: This indicates that buying strength is currently stronger, most traders are in a profitable position, and VWAP forms a solid support level. When price pulls back to the VWAP area, finds support, and rebounds, it is often regarded as a good intraday buying opportunity.
- Price Below VWAP: This indicates heavy selling pressure, with bears in control and most traders in a losing position. VWAP then turns into a strong resistance level. When price rebounds to the VWAP area and is rejected, it becomes an intraday opportunity for short positions.
- Price Hovering Around VWAP: This suggests that bullish and bearish forces are locked in a stalemate, market direction is unclear, and conditions are range-bound. In this case, it is advisable to observe more and trade less, waiting for price to break decisively above or below VWAP before making a decision.
For day traders or short-term traders, treating VWAP as the intraday bullish-bearish dividing line is a highly efficient strategy.
Core Indicator Two: Volume Moving Average (MAVOL) Settings and Applications
If VWAP focuses on “intraday” capital cost, then the Volume Moving Average (MAVOL, Moving Average of Volume) is a powerful tool for observing the “volume trend” over a period of time.
What Is a Volume Moving Average? Common Parameter Settings (5MA, 10MA, 20MA)
As the name suggests, a volume moving average is a moving “average calculated from trading volume”. It averages trading volume over a selected period and plots it as a smooth line, helping us assess whether current volume is at a relatively high or low level compared with recent periods.
Common parameter settings and their meanings are as follows:
- 5MAVOL (5-day volume MA): Represents the average trading volume over one week, responds most sensitively, and is suitable for short-term observation of momentum changes.
- 10MAVOL (10-day volume MA): Represents the average trading volume over two weeks, with a more moderate response, and helps identify short-term volume trends.
- 20MAVOL (20-day volume MA): Represents the average trading volume over one month and is often regarded as the medium-term bullish-bearish volume dividing line.
Whether the current day’s volume bar is above or below these averages reveals changes in market activity.
Rising Volume With Rising Price vs. Shrinking Volume With Falling Price: Understanding Market Sentiment Through Volume Moving Averages
By combining price movement with volume moving averages, several classic interpretation rules can be derived:
- Healthy Rise (Rising Volume With Rising Price): Prices rise while volume bars remain consistently above the 5-day and 10-day volume moving averages, indicating active buying and strong upward momentum.
- Dangerous Rise (Shrinking Volume With Rising Price): Prices continue to rise, but volume gradually shrinks, and may even fall below the monthly average. This is a volume-price divergence signal, indicating weak follow-through buying and a trend that may reverse at any time.
- Healthy Decline (Shrinking Volume With Falling Price): Prices fall while volume also contracts, indicating limited selling pressure, often reflecting a shakeout of floating supply with relatively stable holdings.
- Panic Decline (Rising Volume With Falling Price): Prices fall while volume surges sharply (heavy-volume sell-off) representing panic selling in the market and a trend that is difficult to reverse in the short term. Especially when this signal appears at elevated levels, it often indicates the formation of a market top.

Advanced Technique: How to Conduct Large Order Volume Analysis?
After mastering the basics of VWAP and MAVOL, if you want to take your analysis to the next level and gain insight into the movements of “smart money”, you must learn large order volume analysis.
What Is a “Large Order”? How to Define and Track Major Players’ Activity
A “large order” or “institutional order” does not have an absolute monetary standard. It is a relative concept. For small-cap stocks, an order of several hundred thousand may already be considered large, while for large-cap heavyweight stocks, an order of tens of millions may be required. Many charting platforms provide features such as “large trader buying and selling strength” or “institutional activity”, which automatically filter and aggregate the flow of large orders.
The key to tracking major players’ activity lies in observing “continuity” and “accumulation”. A single day of large-order inflow or outflow may not be representative, but if large orders show net buying over several consecutive days or weeks, there is certainly a story behind it. This indicates that institutional players are conducting long-term positioning. Even if the price has not yet moved, it is worth adding the stock to your watchlist.
Seeing Through Institutional Positioning and True Intentions From Large Order Flows
The essence of large order analysis is to combine order flow with the current price position to judge institutional intent:
- Low-Level Consolidation With Net Large-Order Inflow: This is the most classic “accumulation” signal. Institutions take advantage of retail investors’ lack of patience to gradually build positions at the bottom. During this phase, price action is usually calm, but the net large-order buying balance remains consistently positive.
- During an Uptrend With Net Large-Order Inflow: Institutions are buying while pushing prices higher, with long-term objectives in mind. The trend is healthy.
- High-Level Consolidation With Net Large-Order Outflow: This is a dangerous “distribution” signal. Institutions exploit retail investors’ greed to offload positions to those chasing higher prices at elevated levels. At this stage, prices may still be making new highs, but large-order buying strength has already turned from positive to negative, forming a top divergence.
- During a Downtrend With Net Large-Order Inflow: This may indicate institutions are providing “support” or engaging in “left-side trading”, believing prices have entered a value zone. However, it is not advisable to follow blindly. One should wait for prices to stop falling and stabilize before making a judgment.

By tracking large order volume analysis over the long term, you can get closer to the core forces of the market and make decisions with a higher probability of success.
Common Questions (FAQ)
Q: Are volume indicators applicable to all markets (such as stocks and cryptocurrencies)?
A: Yes. The basic principles of volume analysis (such as volume-price relationships and identifying real versus false breakouts), apply to any market with publicly available volume data, including stocks, futures, the foreign exchange market (part of it), and cryptocurrencies. However, different markets have different participant structures, so interpretation requires adjustment. For example, trading volume in the cryptocurrency market is more easily influenced by a single whale (or large holder), resulting in greater volatility.
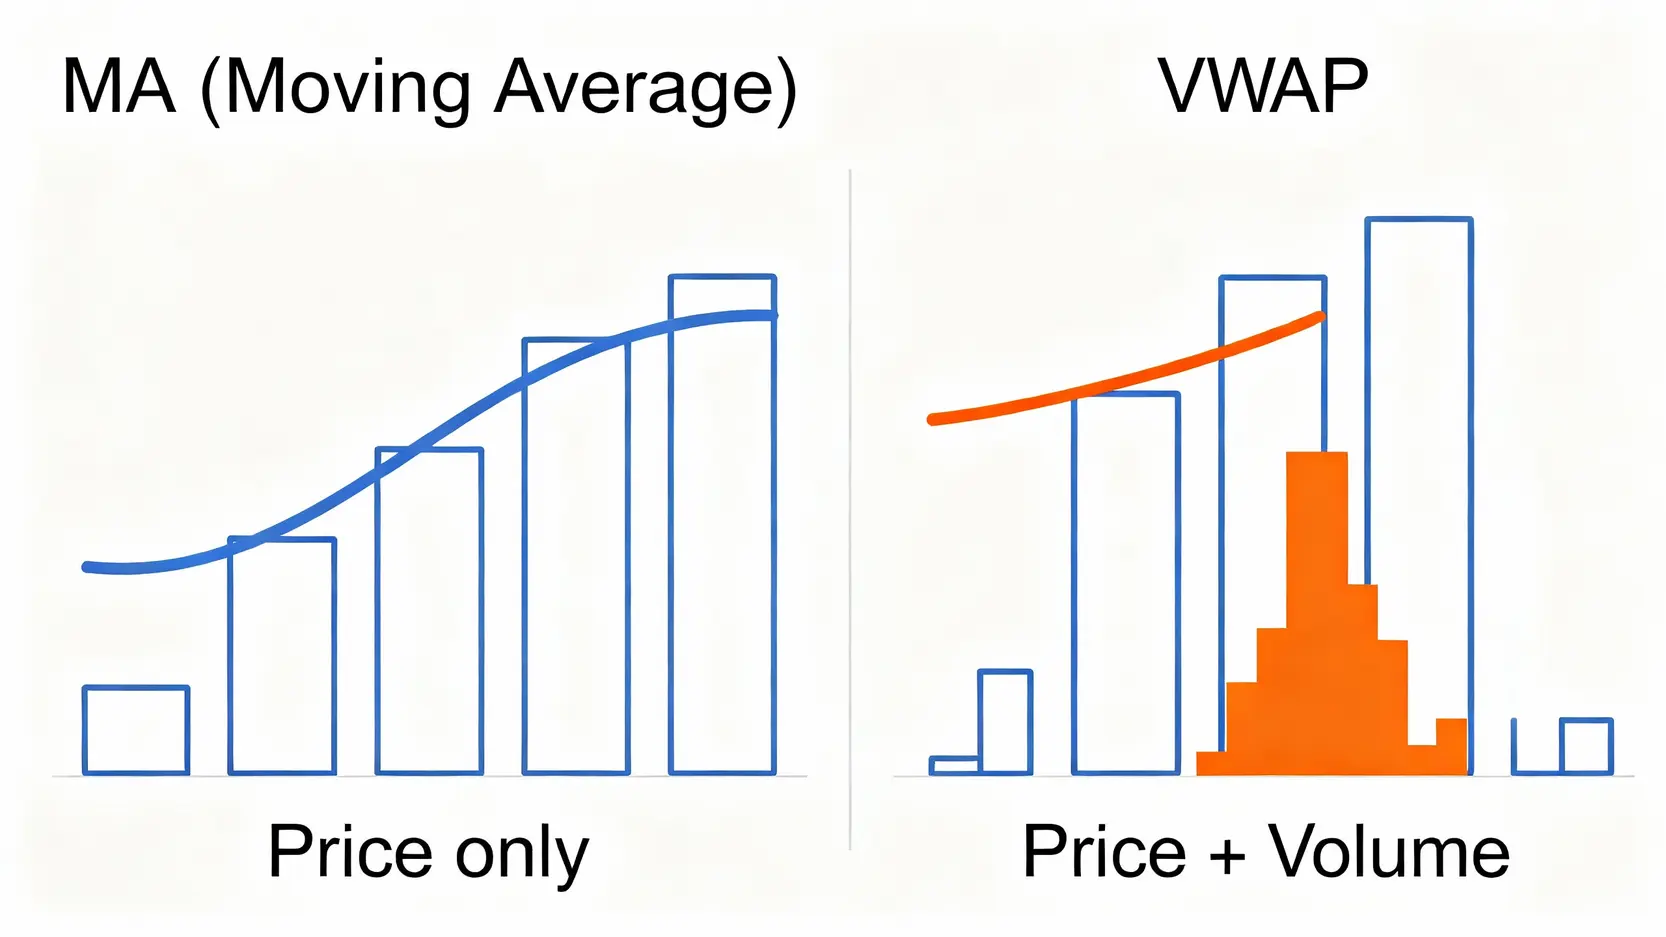
Q: Is the VWAP indicator only suitable for day trading? How should long-term investors reference it?
A: VWAP is primarily designed for intraday trading, as it resets and recalculates each day. However, long-term investors can still gain insights from it. For example, they can observe whether price remains consistently above or below VWAP over time to judge intraday strength or weakness inertia. In addition, there are variations such as “weekly VWAP” or “monthly VWAP”, which are used to assess the average bullish or bearish cost over a week or a month, and are highly valuable references for swing traders.
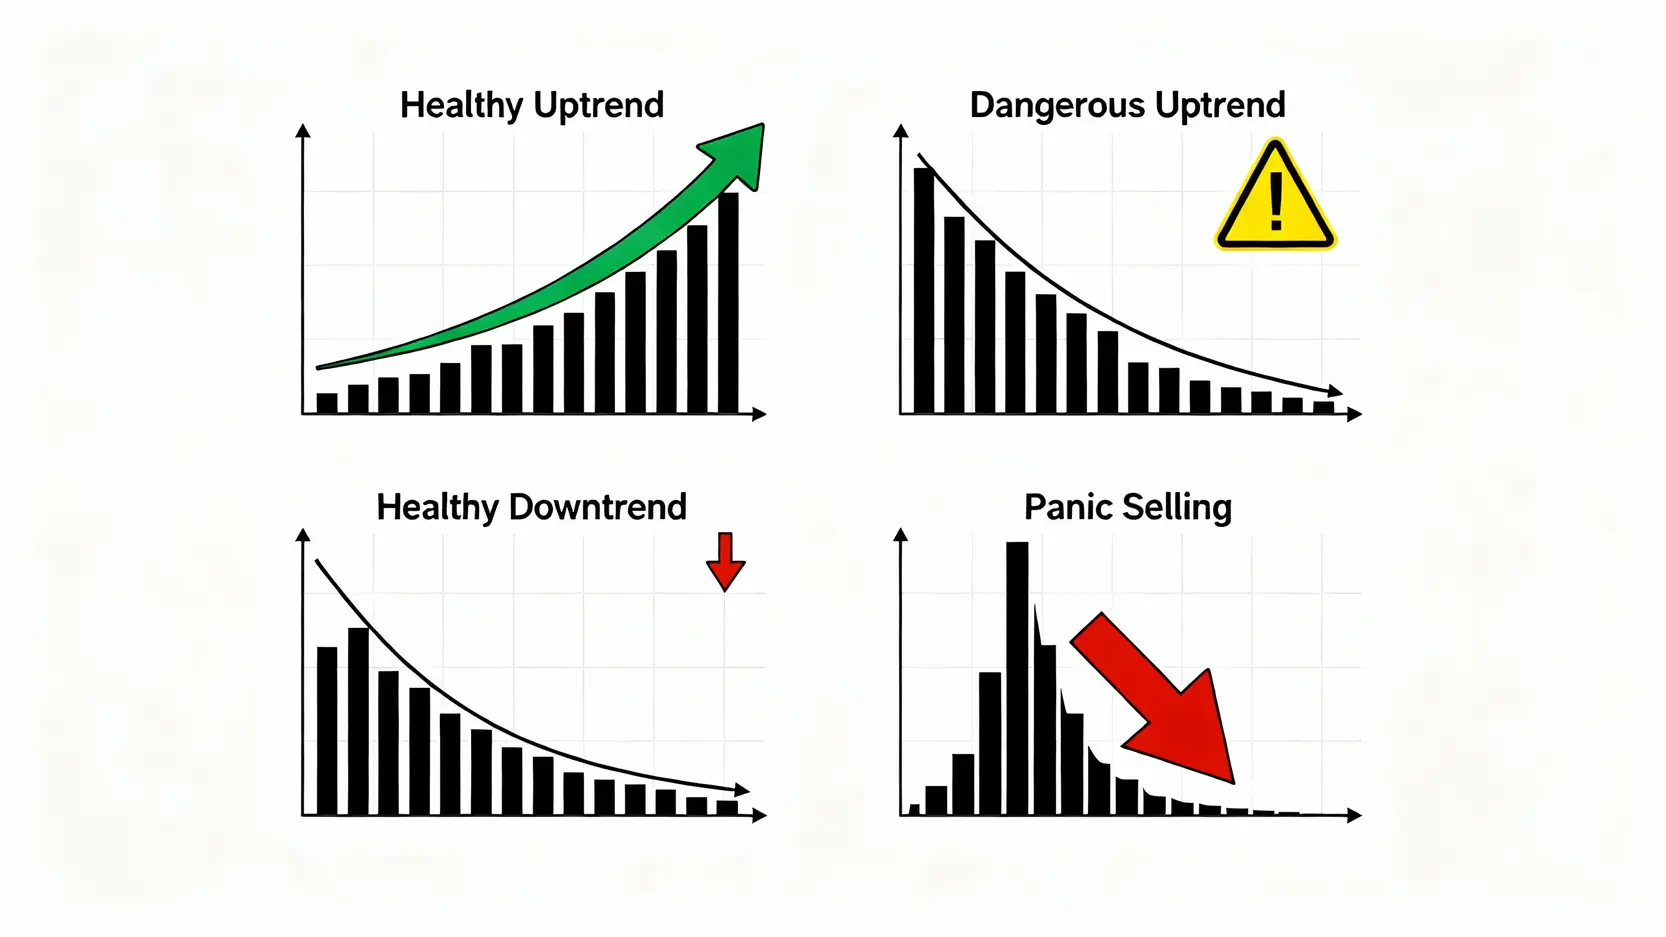
Q: Does high-volume expansion at elevated levels always signal a sell? How should it be combined with other indicators?
A: Not necessarily. High-volume expansion at elevated levels generally has two main possibilities. One is “distribution turnover”, where major players transfer positions to retail investors, which is a topping signal. The other is “offensive turnover”, where a stronger group of major players takes over, clears out weak holders, and prepares for the next upward leg. The key lies in price behavior after the volume surge. If price fails to make new highs after the surge, or even falls below the low of the high-volume candlestick, the likelihood of distribution is very high. Conversely, if after a brief consolidation price quickly stabilizes above the high-volume candlestick, the outlook can still remain positive. It is recommended to combine this analysis with trend or momentum indicators such as MACD or RSI to avoid misjudgment from relying on a single indicator.
Q: Can trading volume data be manipulated?
A: In mature and strictly regulated markets (such as major national stock exchanges), the authenticity of trading volume data is very high. However, in some loosely regulated markets or certain smaller cryptocurrency exchanges, “wash trading” may exist to create artificial activity. Therefore, when selecting trading instruments, it is preferable to focus on assets listed on large and reputable exchanges, where volume data is more reliable.
Conclusion
In summary, mastering volume indicators, especially the Volume-Weighted Average Price (VWAP), volume moving averages, and large order volume analysis, is a key step in transforming from a beginner into a professional trader. Prices may lie, but there is always a reason behind massive trading volume. Learning to correctly apply these volume analysis tools allows you to stop blindly chasing rallies or panic-selling declines, and instead interpret the market’s language more precisely and think from the perspective of major players. Open your charting software now, add these indicators, and begin your data-driven trading journey!
Related Articles
-
Practical Applications of Volatility Surfaces: From Options Modeling to Advanced Skew Trading Strategies In options markets, implied volatility is never a flat line. Instead, it forms complex "smile" or "skew" surfaces. For advanced traders, mastering the practical applications of volatility surfaces is equivalent to possessing a lens that reveals market...2026 年 6 月 3 日
-
Building a Foreign Capital Flow Copy Trading Model: A Stock Market Indicator for Accurately Tracking Institutional Positioning In Asia-Pacific stock markets, foreign capital inflows and outflows often determine the direction of the index. However, simply looking at daily net buy and sell data is no longer enough. Only by building...2026 年 6 月 3 日
-
Options Buyer Strategies During Extreme Market Conditions: Black Swan Hedging and Cross-Market Arbitrage During Volatility Surges The most terrifying aspect of financial markets is not a gradual decline, but overnight flash crashes and cross-market capital withdrawals accompanied by volatility surges. In the highly unpredictable global macroeconomic environment of 2026, geopolitical...2026 年 6 月 3 日


