How Stocks Make Money: Beginner Investment Guide

Updated: 2026/04/08  |  CashbackIsland

stock-investing-guide

How Stocks Make Money? Beginner’s Investment Guide: From Market Trend Analysis to Bull and Bear Market Identification

Want to make money through stock investing and break free from the limitations of a fixed salary, but feel uncertain due to market fluctuations and don’t know where to start? Many new investors face the same dilemma: on one hand, they crave financial growth, on the other, they fear losses due to insufficient knowledge. This detailed beginner’s investment guide is designed for zero-experience investors, gradually teaching you from the basic concept of “how stocks make money” to advanced “market trend analysis” and “bull and bear market indicators”, providing a clear and complete learning path to help you confidently take your first investment step and gradually build your own profit model.


Stock Investment for Beginners: How to Make Money from Stocks?

For new investors, the first step is to understand the two core ways to profit from stocks. These two methods represent different investment philosophies and strategies: one aims for rapid asset growth, while the other focuses on generating stable passive income. Understanding their differences helps you find the path that best aligns with your financial goals and risk tolerance.


Primary Method One: Earning Capital Gains (Price Appreciation)

This is the most well-known way to make money in stocks, with the core concept being “buy low, sell high”. Investors analyze and anticipate the market, buying a company’s stock when prices are expected to be low and selling after prices rise, earning the difference, which is referred to as “capital gains” or “price appreciation”.

  • Operation: Investors need to closely monitor market trends, company news, and industry developments to anticipate future price movements. For example, if you analyze that a tech company is about to release a revolutionary product and expect its stock price to rise, you might buy at $100 per share before the release. If the market reacts enthusiastically and the stock rises to $150, selling then earns a $50 profit per share.
  • Required Skills: Successfully earning price appreciation usually requires learning stock fundamental analysis, studying company financial statements and industry outlook, or applying technical analysis indicators, observing price charts, volume data, and other metrics to time buying and selling.
  • Risk and Return: Potential returns are higher, offering substantial profits in a short period, but the risk is also relatively high. If your judgment is incorrect and the stock falls instead of rises, you face capital losses.


Primary Method Two: Earning Stable Dividends (Cash Flow)

Another way to make money is by investing in companies that regularly return part of their profits to shareholders as “dividends”. This method is like collecting rent as a shareholder, providing relatively stable cash flow, favored by investors who prefer long-term investment and steady returns.

  • Operation: Investors focus on companies with sound financials, consistent profitability, and a stable dividend history. As long as you hold the stock past the “ex-dividend date”, you are entitled to receive dividends. Dividends provide extra cash, and you can also reinvest them to buy more shares, creating a compounding effect.
  • Required Skills: Focus on company fundamentals such as earnings stability, cash flow, debt ratios, and historical dividend records. Understanding dividend investment strategies, including calculating the “dividend yield” is key to evaluating returns.
  • Risk and Return: Returns are relatively stable, with lower risk, because even if stock prices fluctuate in the short term, as long as the company continues paying dividends, investors still receive cash income. However, companies are not obligated to pay dividends, and if financial conditions worsen, they may reduce or cancel dividend payments.

圖解股票賺錢的兩種方式:左邊是低買高賣賺取價差的資本增值圖,右邊是持有股票穩定收取股息的現金流圖。

Illustration: Capital Gains vs Dividends, Two Core Stock Profit Models


Further Reading (Highly Recommended)

Hong Kong Stock Investment for Beginners: Learn How Stocks Make Money from Scratch (with 2026 Popular Hong Kong Stock Account Recommendations)

How to Choose MACD and RSI? The Strongest Technical Indicator Combination Strategy to Improve Short-Term Trading Success!


Mastering Market Trends: Practical Guide to Market Trend Analysis

After learning the two basic ways to make money from stocks, the next step is to learn how to “predict” market direction. Market trend analysis is the core of investment decisions, helping you determine whether the market is moving up, down, or sideways, which guides your buying and selling strategies. It is mainly divided into two schools: fundamental analysis and technical analysis.


Fundamental Analysis vs Technical Analysis: Which Should Beginners Choose?

These two methods are not mutually exclusive but complement each other. Many successful investors combine both in their decision-making.

基本面分析與技術面分析的對比圖。左側展示研究公司財報的基本面分析,右側展示觀察價格圖表的技術面分析。

Fundamental Analysis vs. Technical Analysis: Two Methods of Market Research


Fundamental Analysis

  • Core Idea: Over the long term, a stock’s price will return to its “intrinsic value.” Therefore, by analyzing macroeconomic factors, industry outlook, and a company’s financial condition (such as revenue, profit, and debt), investors can assess whether a stock is undervalued or overvalued.
  • Analysis Tools: Annual reports, financial statements (income statement, balance sheet, cash flow statement), price-to-earnings ratio (P/E Ratio), return on equity (ROE), etc.
  • Suitable For: Investors who prefer long-term or value investing, focusing on a company’s long-term growth potential rather than short-term price fluctuations.


Technical Analysis

  • Core Idea: “History repeats itself” and market prices, volumes, and other data already reflect all known fundamentals. By analyzing past price charts (candlestick charts) and various technical indicators, future price movements can be predicted.
  • Analysis Tools: Candlestick charts, moving averages (MA), relative strength index (RSI), MACD indicators, etc.
  • Suitable For: Investors who prefer short- to medium-term trading, focusing on capturing trading opportunities from market sentiment and price fluctuations.


Advice for Beginners: Initially, start by learning fundamental analysis, selecting financially healthy companies as observation targets. Once you gain basic market understanding, gradually learn simple technical analysis tools (such as moving averages) to assist in timing buy and sell points, building a more comprehensive analysis framework


3 Free Tools to Effortlessly Analyze Market Trends

In the information era, market analysis isn’t difficult. Many free tools offer powerful support:

  1. Yahoo Finance: Provides real-time global stock quotes, historical price charts, company financial data, news, and analysis reports. Its intuitive interface makes it beginner-friendly and an excellent starting point for research.
  2. Google Finance: Similar to Yahoo Finance, but with the advantage of integrating Google’s powerful news search function, allowing you to easily track the latest updates on specific companies or industries and gauge market sentiment.
  3. Brokerage Trading Apps: Most brokers provide feature-rich trading apps. These apps offer real-time quotes and order placement, and often include technical analysis charting tools, letting you draw lines and set indicators directly on your phone for instant analysis.


Advanced Tips: How to Use Key Indicators to Identify Bull and Bear Markets?

Once you’ve built a foundation in individual stock analysis, you need to expand your perspective to the entire market learning to determine whether it’s a “bull market” or “bear market”. This skill is essential for asset allocation and risk management, helping you stay calm during market euphoria and spot opportunities during pessimistic phases.


What Are Bull and Bear Markets? Why Learn to Identify Them?

  • Bull Market: Refers to a period when the stock market is generally rising. The market is filled with optimism, investor confidence is high, trading is active, and the economy is usually in a growth phase
  • Bear Market: Refers to a period when the stock market is generally falling, usually defined as a decline of more than 20% from the peak. The market is permeated with pessimism, investors sell off assets, and the economy may face a recession

Learning to identify bull and bear markets allows you to act in line with trends. In a bull market, you can adopt a more aggressive strategy and increase your equity allocation; in a bear market, you should shift to a defensive stance, retain cash, or allocate more to safe-haven assets while waiting for opportunities. This is a key skill for long-term survival in the market.

牛市與熊市的示意圖。左邊是代表市場上漲的牛市,伴隨降息與低失業率;右邊是代表市場下跌的熊市,伴隨升息與高失業率。

Key Indicators of Bull and Bear Markets: How Economic Data Influences Market Direction


Key Indicator 1: Total Market Volume

Trading volume is a direct reflection of market sentiment and a key indicator of whether a trend is healthy. The basic principle of price-volume relationship is “rising prices with increasing volume, falling prices with decreasing volume” for a healthy bullish market.

  • Bull Market Signal: When the major index continues to rise and daily total trading volume gradually expands, it indicates a continuous inflow of funds chasing prices, confirming a stable bull trend.
  • Bear Market Warning: If the index rises but volume shrinks (price-volume divergence), it may indicate insufficient upward momentum and signal a potential trend reversal. Conversely, if the index starts falling and volume surges, it indicates panic selling in the market, suggesting a bear market may have arrived.


Key Indicator 2: Economic Data (such as Interest Rates, Unemployment Rate)

The stock market is a barometer of the economy. Macroeconomic data directly affects capital flows and corporate earnings, thereby guiding the direction of bull and bear markets.

  • Interest Rates: Interest rates represent the cost of capital. Generally, when central banks (such as the US Federal Reserve Fed) stop raising rates, or even cut rates or implement quantitative easing (QE), market liquidity increases and capital costs decrease, which greatly stimulates asset prices. Understanding the impact of Fed rate decisions helps you anticipate market moves.
  • Unemployment Rate: The unemployment rate is an important indicator of economic health. A low and steadily declining unemployment rate indicates a strong economy, profitable companies, and strong consumer spending, forming a solid foundation for a bull market. A sudden rise in unemployment signals an economic recession and significantly increases bear market risk.

By observing these indicators comprehensively, although you cannot predict the market with 100% accuracy, you can greatly enhance your understanding of the overall market environment and make wiser investment decisions.


Common Questions About Making Money in Stocks (FAQ)

Q: How much money do I need to invest in stocks?

A: In theory, the threshold for investing in stocks is very low. Many markets (such as US stocks) allow fractional share trading, meaning you can buy a small portion of high-priced shares with just a few dozen or hundreds of dollars. For beginners, it is recommended to start with spare money that would not affect your daily life even if lost, such as a few thousand dollars, focusing on the learning process rather than initial profits.

Q: How long do bull and bear markets usually last?

A: There is no fixed duration for bull or bear markets, which vary in length. Historically, bull markets tend to last much longer than bear markets. A bull market may continue for several years, while a bear market may end within months to one or two years. The key is to understand market cycles and adopt appropriate strategies at different stages.

Q: Besides stocks, what investment options are available for beginners?

A: For beginners, in addition to investing directly in individual stocks, you can consider more diversified investment tools, such as index funds (ETFs). ETFs track the performance of the entire market or specific sectors, so buying an ETF is equivalent to investing in dozens or even hundreds of companies at once. This effectively spreads risk and is ideal for a stable start.

Q: Which is more important, technical analysis or fundamental analysis?

A: There is no absolute answer; it depends on your investment style. For long-term value investors, fundamental analysis is the foundation to “choose good companies”. For short-term traders, technical analysis is a tool to “find the right timing”. Ideally, both should be combined: use fundamental analysis to identify quality stocks worth investing in, then use technical analysis to find suitable entry and exit points.


Conclusion

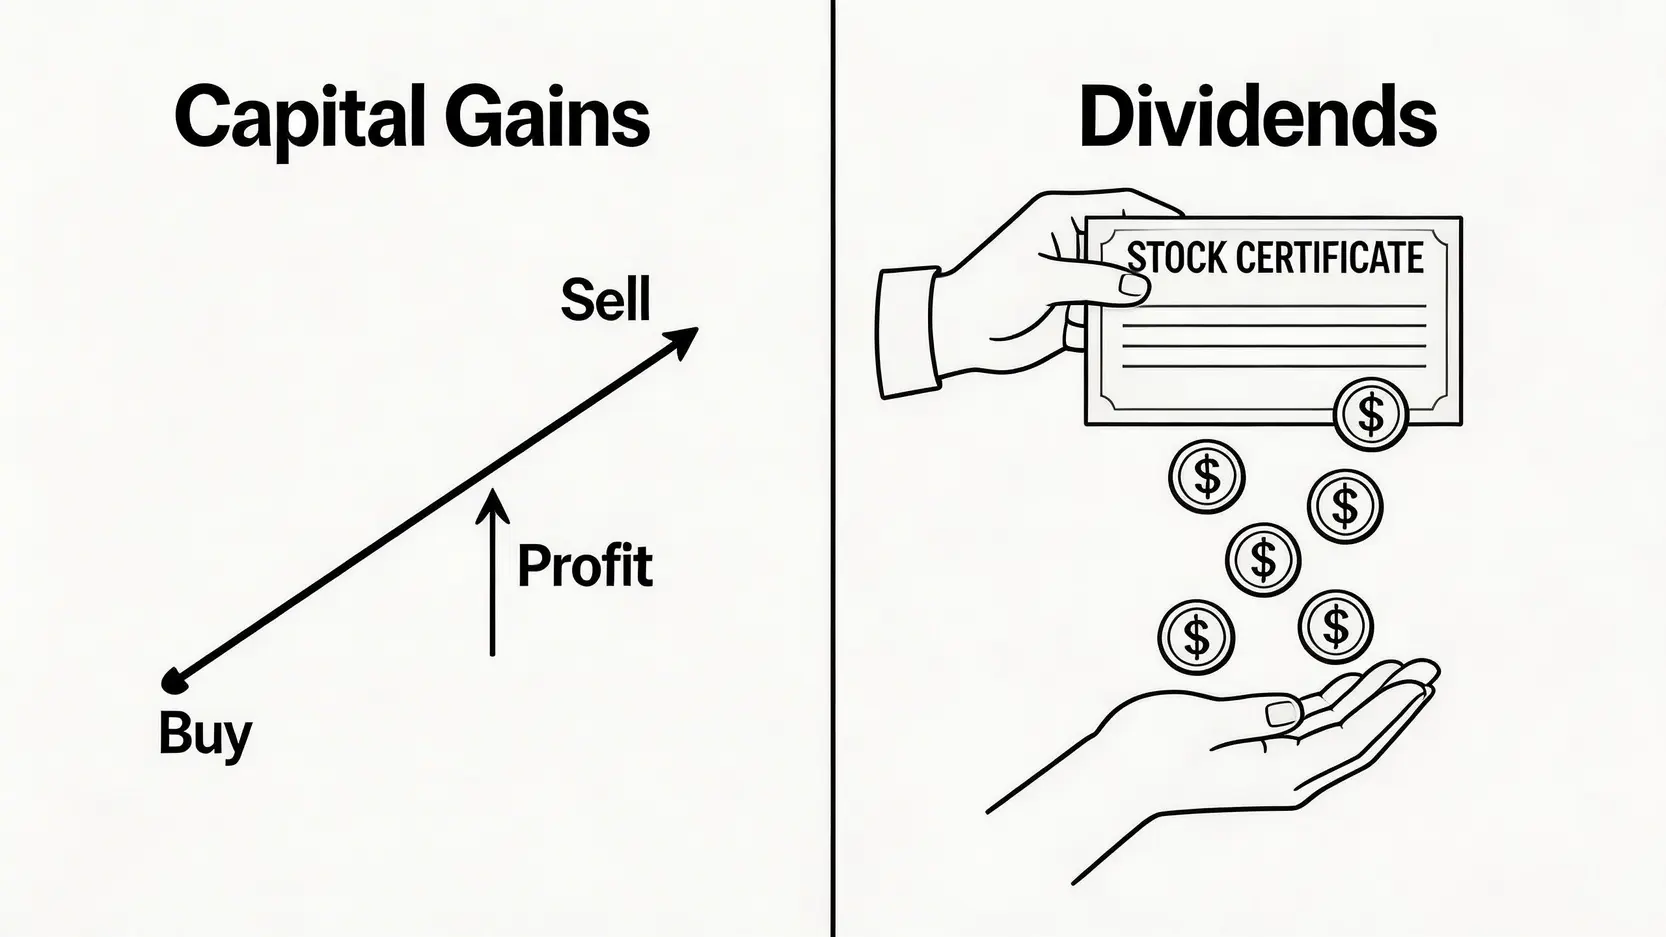
In summary, successfully making money from stocks does not rely on luck alone. From understanding the basics of earning price differences and dividends, to learning to apply market trend analysis and referencing indicators such as total trading volume and economic data to identify bull and bear markets, every step is key to building investment confidence. This beginner’s investment guide is designed to lay a solid foundation, but real growth comes from practice and continuous learning. Remember, constantly refining your knowledge and strategies is the most effective investment in the market. Start planning your investment blueprint now and steadily move toward financial freedom!

If you liked this article, please share it!

Related Articles

  • Volatility Surface Guide: Skew Trading Strategies
    Practical Applications of Volatility Surfaces: From Options Modeling to Advanced Skew Trading Strategies In options markets, implied volatility is never a flat line. Instead, it forms complex "smile" or "skew" surfaces. For advanced traders, mastering the practical applications of volatility surfaces is equivalent to possessing a lens that reveals market...
    2026 年 6 月 3 日
  • Foreign Capital Flow Model: Track Institutional Money
    Building a Foreign Capital Flow Copy Trading Model: A Stock Market Indicator for Accurately Tracking Institutional Positioning In Asia-Pacific stock markets, foreign capital inflows and outflows often determine the direction of the index. However, simply looking at daily net buy and sell data is no longer enough. Only by building...
    2026 年 6 月 3 日
  • Options Buying Strategies for Extreme Market Risks
    Options Buyer Strategies During Extreme Market Conditions: Black Swan Hedging and Cross-Market Arbitrage During Volatility Surges The most terrifying aspect of financial markets is not a gradual decline, but overnight flash crashes and cross-market capital withdrawals accompanied by volatility surges. In the highly unpredictable global macroeconomic environment of 2026, geopolitical...
    2026 年 6 月 3 日
返回顶部