Bull Market Signals: 4 Early Signs & Divergence Guide

Updated: 2026/04/08  |  CashbackIsland

牛市特徵全攻略:如何捕捉4大初期訊號?從大牛市先兆到背離點

Complete Guide to Bull Market Characteristics: How to Capture the Four Major Early Signals? From Early Signs of a Major Bull Market to Divergence Points

In the unpredictable and ever-changing investment market, missing a major bull market can be more frustrating than making the wrong directional call and suffering losses. Many investors only react when market sentiment is at its peak and news headlines report new stock highs, often ending up as “bag holders” at the top. To escape this fate, the key is to learn forward-looking thinking. This article systematically breaks down bull market characteristics, guiding you step by step to identify early signs of a major bull market and valuable initial bull market signals from macroeconomics, market sentiment, and key technical indicators, while delving into professional methods such as “how to interpret bull market divergence”, helping you secure the lead and ride the wave before the next bull market surge.

What Is a Bull Market? Deconstructing the Three Phases of a Bull Market (Bull One, Bull Two, Bull Three)

To capture a bull market, you must first understand its lifecycle. A full-scale major bull market does not rise in a straight line; it is like a brilliant symphony, divided into three distinct movements, commonly referred to as “Bull One, Bull Two, Bull Three”. Understanding the characteristics of each stage allows you to make the right decisions at the right time.

牛市三部曲示意圖,展示了從牛一的絕望積累期,到牛二的大眾參與期,再到牛三的瘋狂泡沫期的演變過程。

Three Phases of a Bull Market: From Despair to Widespread Euphoria


Bull One (Accumulation Phase): Market Born from Despair, Smart Money Quietly Enters

The first phase of a bull market typically emerges quietly amidst the ruins of a bear market. At this time, market sentiment is extremely pessimistic, bad news is everywhere, and most investors have lost hope, vowing never to touch stocks again. Yet it is in this despair that opportunities begin to arise. Typical characteristics of Bull One include:

  • Extreme Market Pessimism: News media is flooded with reports of economic recession and corporate bankruptcies, trading volumes remain low, as if the market is dead.
  • Value Emergence: Many quality assets are priced far below intrinsic value, making valuations highly attractive.
  • Smart Money Entry: Some farsighted institutional investors and industry capitalists ignore short-term noise and quietly accumulate undervalued assets in batches, a process called “Accumulation”.
  • Slow Index Recovery: After prolonged declines, indices begin to stabilize and slowly climb amid hesitation and skepticism. Most people perceive this as a “bear market rebound” and hesitate to believe a bull market has arrived.


Bull Two (Main Uptrend): Fundamental Improvement and Growing Public Confidence

As the market enters Bull Two, it is like the symphony reaching its main theme; this is the longest, most stable, and most profitable phase of a bull market. The core driver is substantial improvement in economic fundamentals. Public investors shift from doubt to confidence, and funds begin to pour into the market. Signals of Bull Two include:

  • Economic Data Improvement: GDP resumes growth, unemployment declines, corporate earnings exceed expectations, and various macroeconomic indicators send positive signals.
  • Investor Confidence Recovery: With stock prices rising steadily, pessimism disappears, and more retail investors re-enter the market, significantly increasing trading volumes.
  • Sector Rotation Uptrend: The market shows healthy rotation patterns, starting with leading and blue-chip stocks, gradually spreading to second- and third-tier stocks, forming a broad upward trend.
  • Optimistic Media Coverage: Financial media tone shifts from pessimistic to optimistic, and stories of “stock market geniuses” circulate, attracting more attention.


Bull Three (Bubble Phase): Mass Participation and the Intersection of Risk and Opportunity

Bull Three is the final frenzy of a bull market, where risks accumulate fastest. Market sentiment peaks, and rationality is replaced by greed. “Everyone is in stocks” becomes the norm, with taxi drivers and market vendors alike discussing which stocks will rise. Characteristics of Bull Three include:

  • Irrational Exuberance: The market is fully driven by sentiment, stock valuations reach extremely unreasonable levels, and even low-quality stocks can “soar”.
  • Retail Investor Surge: Numerous new investors succumb to temptation, investing life savings or borrowed money in hopes of overnight riches.
  • Price-Volume Divergence: Although the stock index continues to reach new highs, trading volumes may lag, or some leading stocks show fatigue, signaling internal weakening.
  • Smart Money Exit: While retail investors flood in, institutions that entered during Bull One quietly sell stocks in batches, distributing holdings to latecomers.


Recommended Further Reading

RSI Indicator Tutorial: Understand the Relative Strength Index from overbought/oversold to divergence in five practical steps …

MACD and Stock Golden Cross Explained: Three Tips to Select Stocks and Avoid False Signals


Four Core Characteristics and Early Signs of an Impending Major Bull Market

Instead of chasing highs in the later stages of a bull market, it is better to learn how to identify key early signs before a major bull market begins. These signals are not single indicators but a comprehensive system covering macroeconomics, market sentiment, policy direction, and technical analysis. Mastering these four core characteristics allows you to capture initial bull market signals ahead of others.


Macroeconomic Characteristics: Understanding Economic Cycles Through GDP Growth and Unemployment

The stock market is the barometer of the economy. A sustainable major bull market requires strong macroeconomic fundamentals. The two most important indicators are:

  • Gross Domestic Product (GDP): GDP measures the total economic activity of a country. When GDP turns positive and shows accelerating growth over several quarters, it signals improved corporate profitability and stronger consumer spending, forming the fundamental base for a bull market. You can reference economic forecasts from authoritative institutions such as the World Bank or IMF.
  • Unemployment Rate: The unemployment rate reflects economic health and is a lagging indicator, but its trend is highly informative. When unemployment peaks and then steadily declines, it indicates labor market recovery, rising household income, and renewed consumer confidence, which will transmit to capital markets.


Market Sentiment and Capital Flows: How Investor Confidence and Trading Volume Reflect Trends

The market is driven by participants, so “sentiment” and “capital” directly influence price movement. Early bull market signals include:

  • Investor Confidence Index: Sentiment indicators such as the Fear & Greed Index usually reach “extreme fear” levels at the end of a bear market. A slow rebound from extreme fear indicates that the worst may be over.
  • Volume Expansion: “Price rises with volume” is the healthiest pattern of a bull market. In early stages, when the index breaks key resistance (such as long-term downtrend lines or important moving averages) accompanied by significant volume increase, it shows strong fund inflow and higher trend reliability. Conversely, price rises without volume may indicate a temporary rebound.


Policy Support: The Central Bank’s Role and Government Actions

Liquidity fuels the stock market, while the central bank and government control the taps. A loose policy environment fosters bull markets.

  • Monetary Policy: When central banks (such as the US Federal Reserve) halt rate hikes, cut rates, or implement quantitative easing (QE), market liquidity increases, funding costs decrease, and asset prices are strongly stimulated.
  • Fiscal Policy: Government initiatives such as large-scale tax cuts, infrastructure plans, or other fiscal stimuli directly boost the real economy, increase corporate profits, and positively impact the stock market.


Technical Indicator Signals: Why the “Golden Cross” Is an Important Early Bull Market Signal?

Beyond macroeconomics and policy, technical charts offer intuitive early bull market signals. The most widely known is the “Golden Cross”.

A Golden Cross occurs when a short-term moving average (e.g., 50-day MA) crosses above a long-term moving average (e.g., 200-day MA). The interpretation is:

黃金交叉技術指標示意圖,顯示50日移動平均線(短期)由下向上穿越200日移動平均線(長期),預示著牛市的開始。

Technical Indicator Signal: The Golden Cross as an Early Bull Market Signal

  • Short-term trend strength exceeds long-term trend, indicating momentum shift from bearish to bullish.
  • The 200-day MA is often viewed as the boundary between bull and bear markets; prices above it indicate strength.
  • The Golden Cross usually confirms the start of a long-term upward trend and is considered a reliable medium- to long-term buy signal.

Of course, no single indicator is perfect. A reliable signal of an approaching major bull market must be the result of confirmation across all four aspects (macroeconomics, sentiment, policy, and technicals), all pointing in the same direction.


Professional Technical Analysis: How to Interpret Bull Market Divergence?

In the mid to late stages of a bull market, with heightened market sentiment, how can one objectively assess risk and avoid being the last “bag holder”? Understanding “divergence” signals becomes crucial. Divergence occurs when asset prices move inconsistently with technical indicators, often serving as a leading indicator of a trend reversal.


Bearish Divergence: Warning of a Bull Market Top

In a bull market, the most critical divergence is the “top divergence”. It is defined as when an asset price reaches a new high, but the corresponding technical indicator fails to make a new high and instead forms a lower high.


頂背離訊號示意圖,上方顯示股價創出新高點,而下方對應的RSI指標卻形成一個較低的高點,預示上漲動能衰竭。

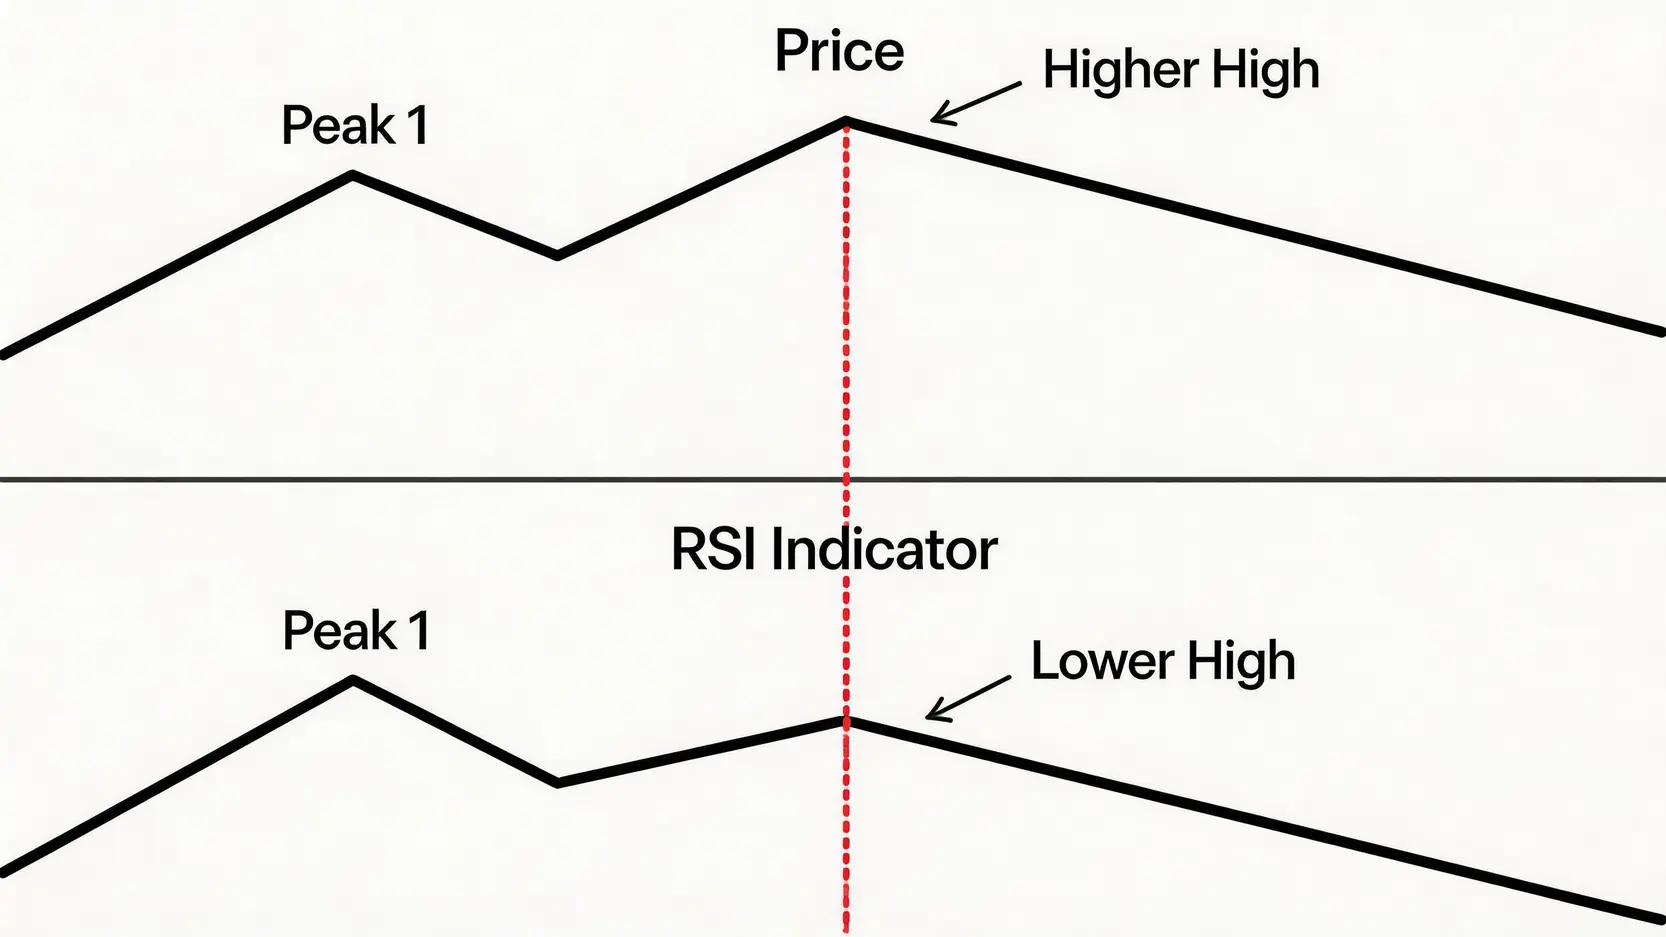
Bearish Divergence: Warning Sign of Price and Indicator Inconsistency

This “price high, indicator low” phenomenon is like a sports car climbing a hill—although the front of the car is still rising, the engine’s RPM (momentum) has already started to decline. It conveys an important message: the internal force driving the price upward is weakening, and the trend could reverse downward at any moment.

How to Use RSI and MACD to Identify Bearish Divergence Signals

In practice, the two most commonly used momentum indicators to identify divergence are RSI (Relative Strength Index) and MACD (Moving Average Convergence Divergence).

  • RSI Bearish Divergence: When the stock price reaches a new high (Price High 2 > Price High 1) but the RSI indicator’s peak declines (RSI High 2 < RSI High 1), this is a typical RSI bearish divergence signal. It indicates that although prices are higher, buying strength has weakened compared to before. For more on RSI applications, refer to the complete RSI Indicator Tutorial.
  • MACD Bearish Divergence: Divergence in MACD can be observed through its histogram or signal lines (DIF/MACD lines). When prices reach a new high but the histogram height or signal line peak is lower than the previous high, it constitutes a MACD bearish divergence. It indicates that bullish momentum is rapidly dissipating. For a deeper understanding of MACD, see the Complete MACD Indicator Guide.


Practical Guide: How to Act When Price Hits New Highs but Indicators Lag?

In the late stage of a bull market, observing a bearish divergence signal does not mean you should panic and liquidate all positions immediately, but it is definitely an alert that requires action. You can take the following steps:

  1. Stop Chasing Highs: Immediately halt any new purchases, especially avoid chasing stocks with extreme gains and overly enthusiastic sentiment.
  2. Gradually Reduce Positions: For holdings that have already generated significant profits, begin to sell in batches to lock in gains. Do not try to sell at the absolute peak, as no one can predict it.
  3. Tighten Stop Losses: Move your stop-loss points upward for protection. For example, set stops below recent key support levels or important moving averages.
  4. Observe Confirmation Signals: Divergence is a warning, but reversal requires confirmation. Wait for prices to break key upward trendlines or neckline levels as confirmation before executing larger-scale sales.

Learning “How to Interpret Bull Market Divergence” allows you to transform from a passive market follower into a smart investor who proactively manages risk and exits positions at high points.


FAQ: Common Questions About Bull Markets

Q: How long does a bull market usually last?

A: Bull markets have no fixed duration. Their length depends on multiple factors, including the economic cycle, policy support, and market sentiment. Historically, bull markets can last as short as one to two years or over ten years, such as the US stock bull market from 2009 to 2020. The key is not to predict the exact duration but to continuously monitor the bull market characteristics and potential divergence warning signs discussed earlier.

Q: What types of stocks or assets should be invested in at the early stage of a bull market?

A: In the early stages of a bull market (Bull One to early Bull Two), it is generally a good time to invest in high-quality growth stocks and cyclical stocks. For example, technology, financials, discretionary consumer, and industrial sectors are closely linked to economic recovery and often outperform the market during the main uptrend. In contrast, defensive stocks (such as utilities or staples) usually underperform in a bull market.

Q: Does a bearish divergence signal mean the market will immediately reverse downward?

A: Not necessarily. Bearish divergence is a leading “warning” signal, not a 100% accurate “execution” signal. After a bearish divergence appears, the market may still continue to rise for a period, creating a so-called repeated divergence “blunting” phenomenon. Therefore, divergence should be treated as a signal to increase caution and begin reducing positions, rather than a reason to immediately reverse and go short. It is best to combine it with price action, such as a break below key support levels, as final confirmation of a trend reversal.

Q: Does the end of a bear market mean a bull market has begun?

A: Not entirely. Between the end of a bear market and the start of a bull market, there is usually a transitional phase called the “bottoming” or “consolidation” period. During this phase, the market oscillates within a range as bullish and bearish forces reach temporary balance, digesting bad news and accumulating upward momentum. The accumulation phase of Bull One occurs during this period. Only when prices successfully break above the consolidation range with increased volume can we confidently say a new bull market may have begun.


Conclusion

In summary, to successfully capture and navigate a major bull market, one cannot rely solely on market rumors or personal intuition. You need to establish a systematic analytical framework, combine a deep understanding of bull market characteristics, closely monitor early signals from macroeconomics, market sentiment, and policy, and leverage professional technical tools such as divergence points to objectively assess market conditions and potential risks. This complete framework aims to help you make wiser and more composed investment decisions in future bull markets. Start observing these signals today and prepare fully for the next golden investment cycle!

If you liked this article, please share it!

Related Articles

  • Volatility Surface Guide: Skew Trading Strategies
    Practical Applications of Volatility Surfaces: From Options Modeling to Advanced Skew Trading Strategies In options markets, implied volatility is never a flat line. Instead, it forms complex "smile" or "skew" surfaces. For advanced traders, mastering the practical applications of volatility surfaces is equivalent to possessing a lens that reveals market...
    2026 年 6 月 3 日
  • Foreign Capital Flow Model: Track Institutional Money
    Building a Foreign Capital Flow Copy Trading Model: A Stock Market Indicator for Accurately Tracking Institutional Positioning In Asia-Pacific stock markets, foreign capital inflows and outflows often determine the direction of the index. However, simply looking at daily net buy and sell data is no longer enough. Only by building...
    2026 年 6 月 3 日
  • Options Buying Strategies for Extreme Market Risks
    Options Buyer Strategies During Extreme Market Conditions: Black Swan Hedging and Cross-Market Arbitrage During Volatility Surges The most terrifying aspect of financial markets is not a gradual decline, but overnight flash crashes and cross-market capital withdrawals accompanied by volatility surges. In the highly unpredictable global macroeconomic environment of 2026, geopolitical...
    2026 年 6 月 3 日
返回顶部