HK Stocks: KD vs MACD vs RSI Strategy Guide

Updated: 2026/03/25  |  CashbackIsland

hk-stock-indicator-combo-strategy

[Hong Kong Stocks Technical Analysis] How to Choose Between KD, MACD, and RSI? The Strongest Technical Indicator Combination Strategy to Improve Short-Term Trading Win Rate!

Do you often encounter difficulties in the Hong Kong stock market: when using the KD indicator alone, signals come too quickly and are easily “false signals”, while relying only on MACD reacts too slowly, causing you to miss the best trading opportunities? In fact, a single technical indicator has inherent limitations, and experienced investors understand how to use “technical indicator combinations”. A good combination strategy can help you filter out noise and more accurately grasp market trends. This article will provide an in-depth comparison of KD and MACD, and teach you how to build the strongest KD and RSI combination strategy, allowing you to effectively filter false signals, accurately capture upward trends in Hong Kong stocks, and find your profit formula in the complex world of Hong Kong stock technical analysis indicators


Why Is a Single Technical Indicator Not Enough? Breaking the Myth of Hong Kong Stock Trading

In the stock market, especially in the more volatile Hong Kong stock market, many beginners like to look for a “holy grail”, believing that relying on a single indicator can guarantee success. However, they soon discover that a single indicator often presents various problems, affecting the accuracy of judgment.


Indicator “Stagnation” and “False Signals”: The Risks of Using One Alone

No technical indicator is perfect. For example, the highly sensitive KD indicator can easily become “stagnant” in strong one-sided markets (whether sharply rising or falling). This means that even when prices continue to rise, the K value may remain above 80 in the overbought zone for a long time, causing you to exit too early and miss further gains, and vice versa. In sideways markets, the KD indicator may frequently generate golden cross and death cross signals due to its sensitivity, many of which are “false signals”. Acting on these can result in repeated losses. These are the risks of relying solely on one Hong Kong stock technical analysis indicator.


The Power of Indicator Combinations: Achieving a Complementary Effect Where 1+1 > 2

A smarter approach is to combine indicators with different characteristics so they can confirm and complement each other. Like a team where each member has a role, a good technical indicator combination can achieve:

  • Filter noise: Combine a fast indicator (such as KD) with a slow indicator (such as MACD). Use the slow indicator to determine the overall trend and the fast indicator to identify precise entry points, effectively filtering many short-term false signals.
  • Improve win rate: When two or more indicators generate signals in the same direction, the reliability of that signal increases significantly.
  • Compensate for weaknesses: For example, when the KD indicator becomes stagnant, the “divergence” signal from RSI can be used to provide early warning of a potential reversal.

Through the complementarity of indicators, a more comprehensive and multidimensional analytical framework can be established, greatly improving decision quality. This is the power of combination strategies.


Further Reading (Highly Recommended)

MACD Indicator Guide: Understand Fast and Slow Lines, Histogram, Golden Cross, and Divergence in One Article!

RSI Indicator Guide: Understand the Relative Strength Index, From Overbought and Oversold to Divergence in 5 Practical Applications …


Winning Technical Indicator Combination (1): KD + MACD Comparison and Practical Application

KD and MACD are two of the most widely used indicators, and their combination is one of the most classic strategies. One represents oscillators, while the other is the king of trend indicators. Together, they form a perfect match. To use them effectively, you must first understand the comparison between KD and MACD.


KD vs. MACD In-Depth Comparison: Sensitivity Versus Trend Strength

We can use a simple table to clearly understand their differences:

Indicator Characteristics KD Indicator (Stochastic Oscillator) MACD Indicator (Moving Average Convergence Divergence)
Type Oscillator Trend Indicator
Core Function Determine whether the stock price is in an “overbought” or “oversold” condition Determine the medium- to long-term trend direction and strength of the stock price
Advantages Fast signal response and high sensitivity, suitable for capturing short-term turning points High stability, less affected by short-term fluctuations, accurate trend identification
Disadvantages Prone to stagnation in one-sided markets and frequent false signals in sideways markets Signals react relatively slowly and may miss optimal entry timing
Best Application Scenarios Range-bound fluctuations and sideways consolidation markets Clearly trending one-sided markets (uptrend or downtrend)


Golden Combination Strategy: Use MACD to Determine the Long-Term Trend and KD to Capture Precise Entry and Exit Points

The core idea of this combination is “combining long and short-term signals while trading with the trend”. Simply put, it consists of two steps:

  1. Step One: Use MACD to determine direction. Open the daily chart and first observe MACD. If the fast and slow lines of MACD (DIF and DEA) are running above the zero line and the histogram (OSC) is red, it indicates a bullish market, and the main strategy should be “buy on dips”. Conversely, if the fast and slow lines are below the zero line and the histogram is green, it indicates a bearish market, and the strategy should be “sell on rallies” or remain on the sidelines.
  2. Step Two: Use KD to find timing. After determining the overall direction, use the more sensitive KD indicator to identify specific entry and exit points. For example, under a bullish trend indicated by MACD, when the KD indicator pulls back to around 20 in the oversold zone and forms a “golden cross” (where the K line crosses above the D line), it becomes a relatively safe and precise buy signal.

The advantage of this approach is that MACD helps you stay aligned with the correct trend direction and avoid trading against the market, while KD helps you find the most efficient entry points within that trend, greatly filtering out false signals during consolidation.

KD 與 MACD 組合策略流程圖,展示如何先用 MACD 判斷多頭趨勢,再利用 KD 指標在超賣區的黃金交叉尋找買入點。

KD + MACD Golden Combination Strategy: Long-Term MACD Determines Direction, Short-Term KD Finds Timing.


Hong Kong Stock Case Study: Tencent Holdings (0700) as an Example to Analyze Combined Signals

(Note: The following is for educational purposes only and does not constitute any investment advice)

Assume we observe the daily chart of Tencent Holdings (0700.HK). At a certain point, the MACD fast and slow lines successfully cross above the zero line, and the red histogram begins to expand, indicating that a medium-term upward trend may be starting. At this stage, instead of panic selling when the price slightly declines, one should patiently wait for a buying opportunity. After a few days, the price undergoes a normal pullback, and the KD indicator drops to around 25. When KD forms a clear golden cross at a low level, this dual signal of “MACD bullish trend + KD low-level golden cross” forms a high-probability entry point. Subsequently, the price indeed resumes its upward movement. This is a classic application of a technical indicator combination.


Winning Technical Indicator Combination (2): KD + RSI Combination Strategy Explained

In addition to MACD, RSI, the Relative Strength Index, is also an excellent companion to KD. Both RSI and KD are oscillators, but RSI has unique advantages in measuring internal market strength. The KD RSI combination strategy is particularly suitable for confirming signals and providing early warnings of trend reversals.


RSI Strength Signals: How to Use It to Confirm Overbought and Oversold Conditions With KD?

Although both KD and RSI have overbought (usually above 80) and oversold (usually below 20) concepts, their movements may differ at times. KD may already enter the overbought zone while prices continue to rise. At this point, RSI can be referenced. If RSI has not yet reached extreme overbought levels such as 70 or 80, and is still steadily rising above the midline of 50, it indicates that internal market momentum remains strong and the upward trend may continue. In such cases, selling solely based on KD being overbought may be premature. Conversely, when both KD and RSI enter overbought or oversold zones simultaneously, the reliability of the signal is significantly enhanced and becomes a more trustworthy warning.


What to Do When KD Becomes Stagnant? Use RSI Divergence as an Early Warning

“Divergence” is a highly useful but often overlooked feature of RSI and an effective way to address KD stagnation. Divergence is divided into “bearish divergence” and “bullish divergence”:

  • Bearish Divergence: The price makes a new high, but the RSI high is lower than the previous high. This indicates that upward momentum is “weakening”. Although prices continue to rise, internal strength is diminishing, signaling a potential top and reversal.
  • Bullish Divergence: The price makes a new low, but the RSI low is higher than the previous low. This indicates that downward momentum is weakening. Although prices continue to fall, the market may be preparing for a rebound, signaling a potential bottom and reversal.

When the KD indicator remains stagnant (above 80) or (below 20) for several days, it is important to immediately check whether RSI shows divergence. If KD is stagnant above 80 while RSI shows a clear bearish divergence, caution is necessary as the trend is highly likely to reverse, and profit-taking in stages should be considered. This method allows you to detect risks earlier than those waiting only for a KD death cross.

RSI 頂背離示意圖,上方圖表顯示股價創出更高的高點,而下方 RSI 指標圖表卻顯示出更低的高點,形成看跌背離。

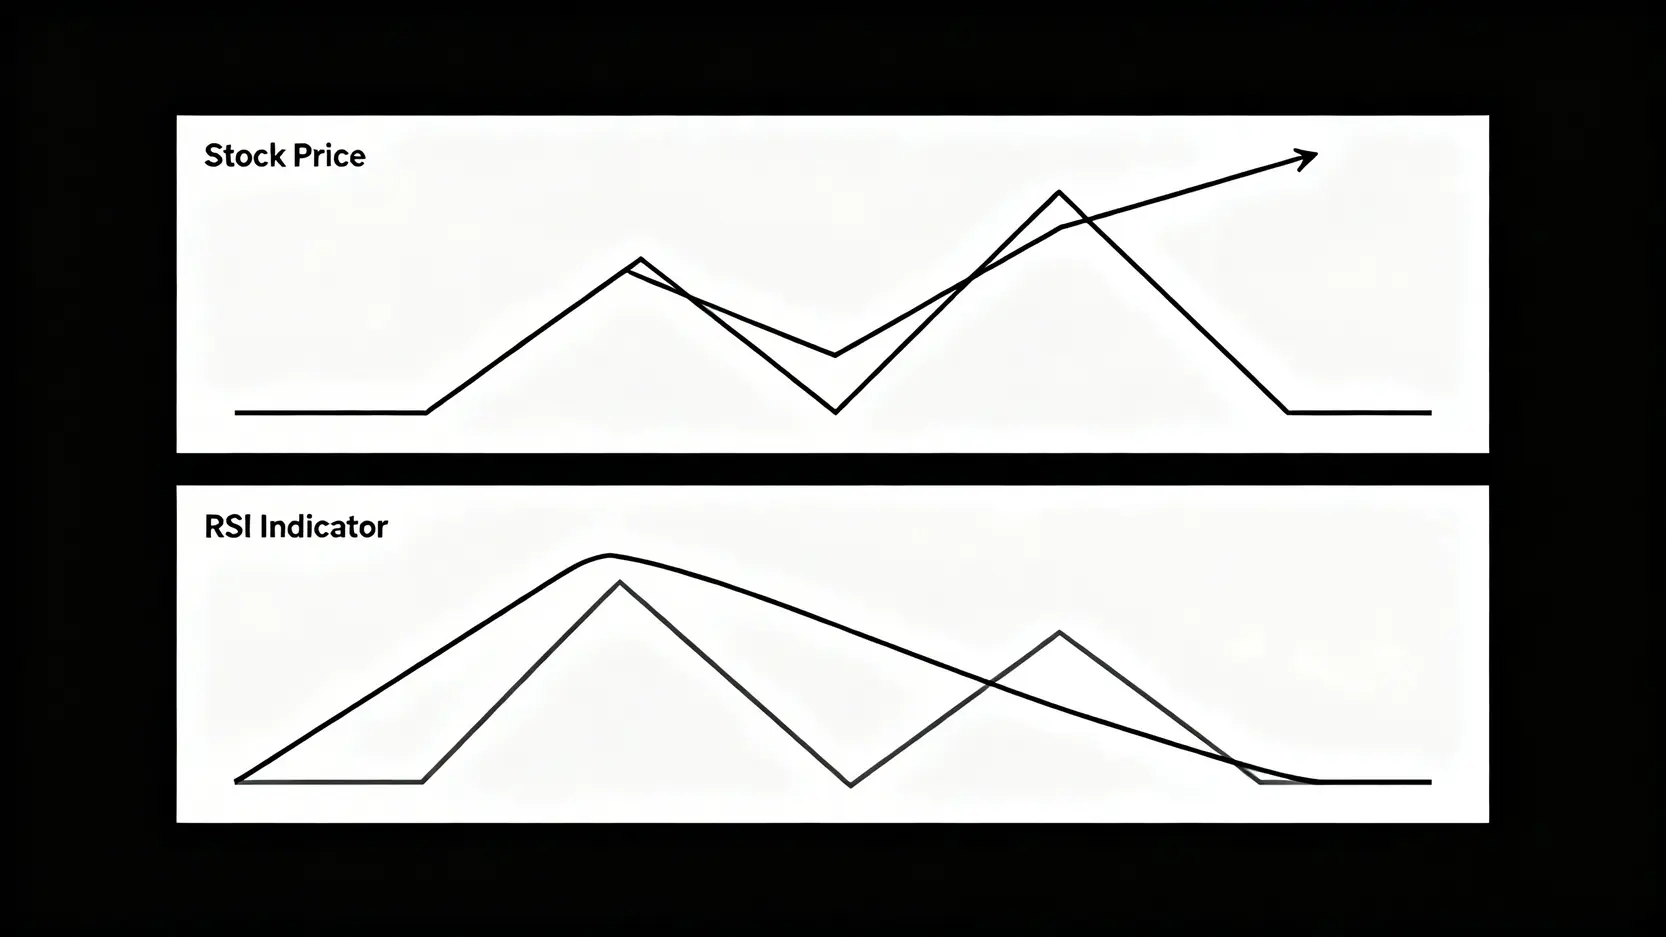
RSI Bearish Divergence: When prices make new highs but momentum weakens, it signals a potential trend reversal.


Hong Kong Stock Case Study: Alibaba (9988) as an Example to Analyze Divergence

(Note: The following is for educational purposes only and does not constitute any investment advice)

Assume that after a decline, Alibaba (9988.HK) makes a new low. At this point, many investors may continue selling out of fear. However, by examining technical indicator charts, it may be observed that although the price makes a new low, the RSI does not form a new low and instead forms a higher low, creating a standard “bullish divergence” pattern. At the same time, the KD indicator may have remained in the oversold zone below 20 for a period, showing stagnation. When both “RSI bullish divergence” and “KD oversold stagnation” appear together, it forms a strong rebound signal. Shortly afterward, the price indeed experienced a strong rebound. This is the essence of the KD RSI combination strategy

How to Customize the Most Suitable Technical Indicator Combination for Yourself?

After learning the KD+MACD and KD+RSI combinations, the next step is to integrate them into your own trading system. Different investors have different trading styles, and indicator settings should be adjusted accordingly.


Parameter Setting Suggestions for Short-Term, Medium-Term, and Long-Term Investors

Technical indicator parameters are not fixed. In general, the chart timeframe and parameter settings should be aligned:

  • Short-term traders (Day Trade / Swing Trade): May use 15-minute or 60-minute charts. In this case, parameters can be set to be more sensitive. For example, KD can use the default (9,3,3), MACD can use (12,26,9), and RSI can use (14).
  • Medium-term investors, holding for several weeks to months, mainly use daily charts. Parameters can be slightly slower to reduce noise. For example, KD can use (18,5,5), MACD remains at (12,26,9), and RSI can use (14) or (20).
  • Long-term investors, holding for months to years, mainly use weekly and monthly charts. Parameters should be set slower to capture long-term trends. For example, MACD can use (24,52,18), RSI can use (20) or longer. KD is relatively less useful in long-term analysis due to its sensitivity.

Remember, there is no standard answer for optimal parameters. You need to test and adjust based on the characteristics of the stock and your trading style.


Create Your Personalized Hong Kong Stock Technical Analysis Checklist

To avoid confusion during trading, you can create a simple checklist. Before each trade, go through it like a pilot’s pre-flight checklist:

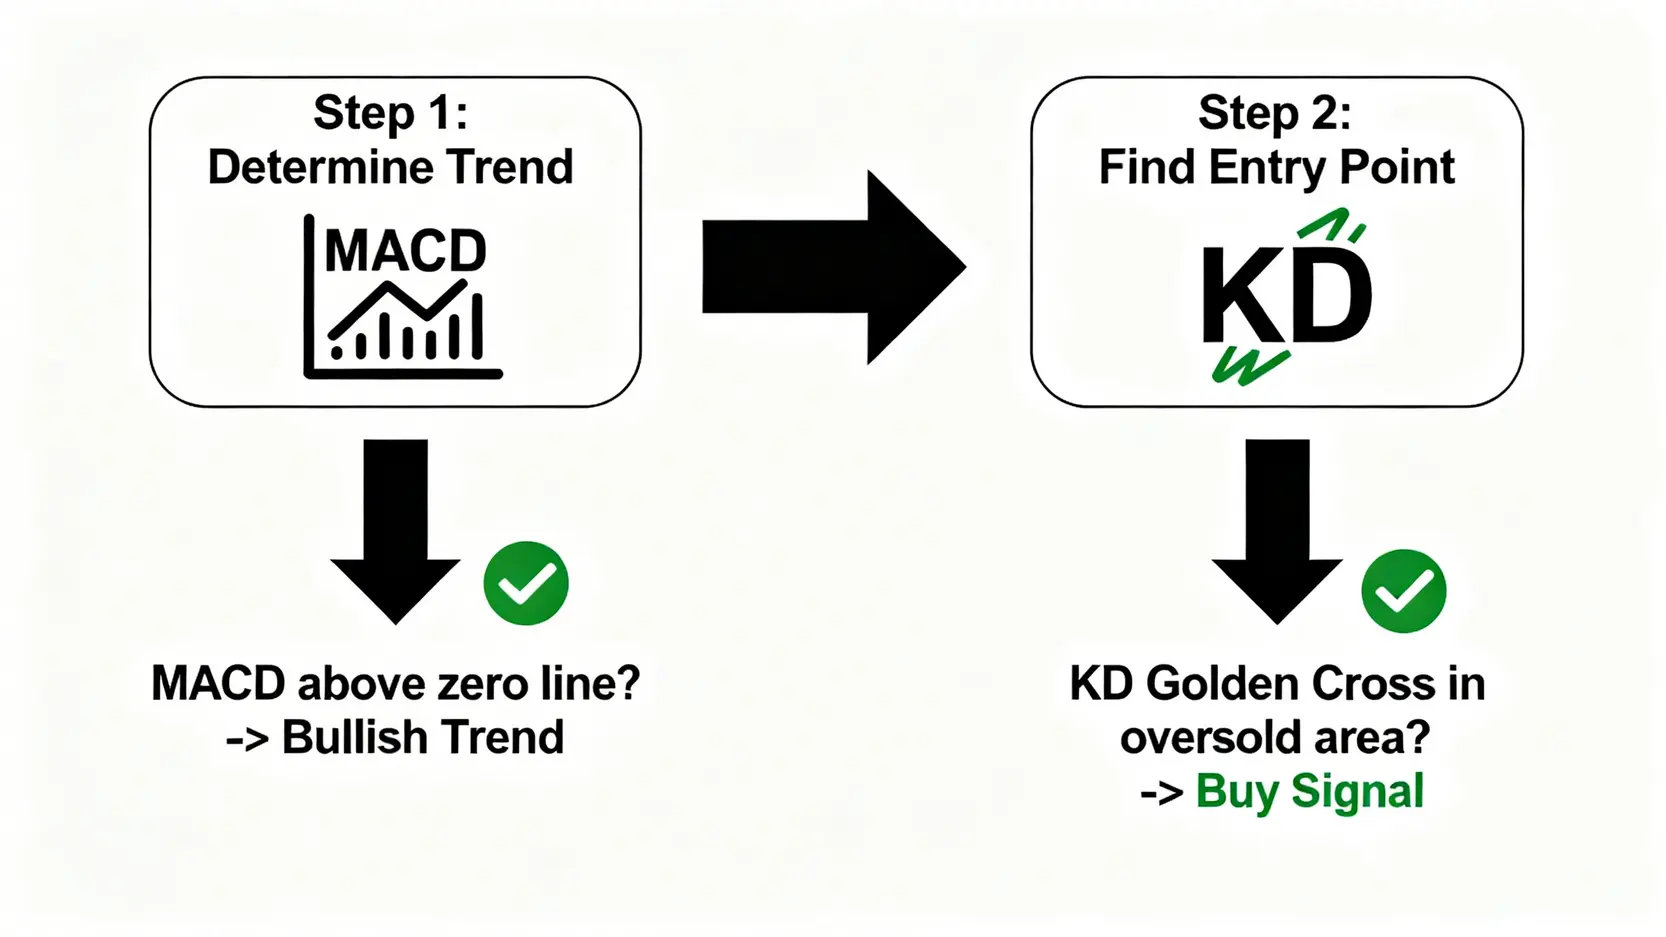
  1. Trend assessment: Is the market in an uptrend, downtrend, or consolidation phase? (which can be determined using MACD or moving averages)
  2. Primary signal: What is the main basis for entry? (For example: KD golden cross under a MACD bullish trend)
  3. Supporting confirmation: Are there other indicators supporting the decision (For example, whether RSI also enters the oversold zone and whether trading volume increases)
  4. Risk evaluation: Where should the stop-loss be placed and whether the risk-reward ratio is reasonable

By establishing a systematic and disciplined analysis process, you can transform technical indicator combination knowledge into consistent trading performance. In addition, gaining a deeper understanding of fundamental indicators such as MACD, RSI, and KD is also essential, and you may refer to more authoritative technical analysis materials to strengthen your knowledge. 

Conclusion

In summary, relying on any single technical indicator in the Hong Kong stock market makes it difficult to achieve consistent and stable returns. By learning KD and MACD comparisons as well as KD and RSI combination strategies, you can build a more comprehensive and robust analytical framework. Integrating these technical indicator combination strategies into your investment decisions not only helps filter market noise effectively, but also significantly improves trading success rates. Remember, there is no holy grail in the market, but through continuous learning and practice, you can develop your own profit formula in the Hong Kong stock market. 

FAQ Frequently Asked Questions

In the Hong Kong stock market, which technical indicator combination is the best?

There is no absolute “best” combination, only the one that is “most suitable for you”. KD + MACD, combining long and short-term signals, is very classic and suitable for most trending markets, while KD + RSI (providing dual confirmation), excels in identifying trend reversals and capturing range-bound markets. Beginners can start with these two combinations, then adjust parameters based on their trading style (short-term or medium to long-term) and risk preference, or even incorporate other indicators such as trading volume and Bollinger Bands to form their own system.

Are these technical indicator combination strategies suitable for all Hong Kong stocks?

The principles of these strategies are universal and applicable to most stocks, especially blue-chip or popular stocks with high trading volume and price movements that align well with technical analysis. However, for stocks with low liquidity and prices (penny stocks) that are easily manipulated, the effectiveness of technical indicators may be significantly reduced, as their price movements may not fully reflect collective market behavior.

How should I set the parameters for KD, MACD, and RSI to be the most accurate?

The default parameters provided by most brokerage platforms (such as KD(9,3,3), MACD(12,26,9), and RSI(14)), have been validated over a long period and are suitable for most short- to medium-term analysis. If you are a beginner, it is recommended to start with the default parameters. As you gain more experience, you can adjust parameters to suit specific stock characteristics or your trading cycle. For short-term trading, parameters can be made more sensitive for faster response, while for long-term trading, parameters can be adjusted to be slower to filter out short-term fluctuations.

What should I do if KD, MACD, and RSI signals contradict each other?

This is a very good question. When indicators contradict each other, for example, MACD signals an uptrend while KD and RSI both show bearish divergence, it usually indicates market disagreement, and the trend may reverse or enter consolidation at any time. In such situations, the most prudent approach is to “observe more and act less”, reduce positions or stay on the sidelines. Remember, the principle of trading is “if you do not understand, do not trade”, and capital preservation should always come first. Wait until the signals of all three indicators align again before entering the market, as this is much safer.

If you liked this article, please share it!

Related Articles

  • Volatility Surface Guide: Skew Trading Strategies
    Practical Applications of Volatility Surfaces: From Options Modeling to Advanced Skew Trading Strategies In options markets, implied volatility is never a flat line. Instead, it forms complex "smile" or "skew" surfaces. For advanced traders, mastering the practical applications of volatility surfaces is equivalent to possessing a lens that reveals market...
    2026 年 6 月 3 日
  • Foreign Capital Flow Model: Track Institutional Money
    Building a Foreign Capital Flow Copy Trading Model: A Stock Market Indicator for Accurately Tracking Institutional Positioning In Asia-Pacific stock markets, foreign capital inflows and outflows often determine the direction of the index. However, simply looking at daily net buy and sell data is no longer enough. Only by building...
    2026 年 6 月 3 日
  • Options Buying Strategies for Extreme Market Risks
    Options Buyer Strategies During Extreme Market Conditions: Black Swan Hedging and Cross-Market Arbitrage During Volatility Surges The most terrifying aspect of financial markets is not a gradual decline, but overnight flash crashes and cross-market capital withdrawals accompanied by volatility surges. In the highly unpredictable global macroeconomic environment of 2026, geopolitical...
    2026 年 6 月 3 日
返回顶部