RSI Bullish Divergence Guide: Spot Buy Signals Fast

Updated: 2026/03/11  |  CashbackIsland

牛市背離意思是什麼?RSI牛市背馳信號教學,5步識別黃金買入點

What Does Bullish Divergence Mean? RSI Bullish Divergence Signal Guide: 5 Steps to Identify the Golden Buy Point

Do you often miss the best buying opportunities when the market reverses, watching prices surge while feeling regret? In fact, by using the powerful technical analysis technique known as “bullish divergence”, especially the “RSI bullish divergence signal” observed through the RSI indicator, you may gain the chance to stay one step ahead of the market and accurately capture potential buy signals. Want to understand the meaning of bullish divergence? This article takes a practical approach, starting from the basics to explain what bullish divergence is and how to use the RSI indicator to identify buying opportunities, helping you truly master this analytical tool widely used by professional investors.


What Is Bullish Divergence?

In the field of technical analysis, “divergence” is a key signal that indicates a possible change in market direction. Bullish divergence, often called “bottom divergence”, is an important basis used by traders to determine that a downward trend may soon end and that prices may rebound.


Basic Definition of Bullish Divergence: When Price Makes a New Low but the Indicator Refuses to Make a New Low

The core concept of bullish divergence is very intuitive: When observing the price chart of an asset, you may find that the price continues to fall and even reaches a new low (Lower Low). At the same time, however, the technical indicator below the chart (such as RSI or MACD) does not follow the price to create a new low. Instead, it forms a higher low (Higher Low).

This phenomenon (where the price and indicator move in different directions) is known as bullish divergence. It suggests that although the price still appears to be falling, the underlying momentum driving the decline has begun to weaken. It is similar to a car moving at high speed that continues rolling forward, but the driver has already released the accelerator and may even be gently applying the brakes.

  • Price Movement: Low → Lower Low
  • Indicator Movement: Low → Higher Low

牛市背離概念圖,顯示價格創下更低低點,而技術指標卻形成更高的低點。

The core feature of bullish divergence (also known as bottom divergence) is that price moves downward while the indicator moves upward, signaling weakening downward momentum.


Why Is Bullish Divergence an Important Potential “Buy Signal”? Understanding the Secret of Market Momentum

Bullish divergence is considered a strong potential buy signal because it reveals what lies behind the apparent price behavior in the market. Price movements are driven by the balance of power between buyers and sellers. When selling pressure dominates, prices fall. When buying pressure takes control, prices rise.

When bullish divergence appears, it usually means:

  1. Selling momentum is weakening: Although the price continues to fall due to market inertia, the indicator shows that the strength of sellers is fading and can no longer push the indicator to lower levels.
  2. Buying pressure is building: The weakening of sellers creates conditions for buyers to enter the market. The rise of the indicator suggests that buyers may be quietly accumulating positions, and the balance of the market is gradually shifting toward the bullish side.

Therefore, bullish divergence is like the first sign of light before a market reversal at the bottom. It allows observant traders to identify the possibility of a trend reversal earlier while the market remains pessimistic, enabling them to capture entry opportunities with more favorable risk to reward potential. Referring to discussions of divergence on authoritative trading analysis platforms such as TradingView can provide a deeper understanding of its importance in market analysis. 

Bullish Divergence vs Bearish Divergence: Understanding the Key Differences at a Glance

To better understand bullish divergence, it can be compared with its opposite concept, bearish divergence. Although the principle is the same, the direction is opposite and the application scenarios are completely different.

Characteristics

Bullish Divergence

Bearish Divergence

Occurrence Location Usually Appears at the End of a Downtrend Usually Appears at the End of an Uptrend
Price Behavior Forms a Lower Low Forms a Higher High
Indicator Behavior Forms a Higher Low Forms a Lower High
Market Signal Potential Bottom Reversal Signal (Bullish) Potential Top Reversal Signal (Bearish)
Trading Strategy Look for Buying Opportunities Look for Selling or Shorting Opportunities

牛市背離與熊市背離的對比圖,左側為牛市背離的底部信號,右側為熊市背離的頂部信號。

Understand at a Glance: Bullish divergence looks for buying opportunities during a downtrend, while bearish divergence looks for selling opportunities during an uptrend.

In simple terms, bullish divergence identifies “buying opportunities” during a “downtrend”, while bearish divergence identifies “selling opportunities” during an “uptrend”.


RSI Indicator Guide: 5 Steps to Identify Accurate Bullish Divergence Signals

The Relative Strength Index (RSI) is one of the most commonly used and effective technical indicators for identifying bullish divergence. It measures the speed and magnitude of price movements to determine whether the market is overbought or oversold. Next, we will explain in five simple steps how to use RSI to identify accurate RSI bullish divergence signals

Step 1: Set Up Your RSI Indicator (Recommended Parameters)

In your trading chart software (such as MT4 or TradingView), you first need to add the RSI indicator. Most platforms already include this indicator.

  • Parameter Setting: The standard parameter for RSI is a 14 period setting. This configuration was proposed by the indicator’s creator Welles Wilder and is widely used on daily charts, hourly charts, and even minute charts. For beginners, simply using the default 14 period setting is sufficient.
  • Horizontal Line Setting: Two horizontal lines are usually set at 70 and 30. A reading above 70 is considered the overbought zone, while a reading below 30 is considered the oversold zone. Bullish divergence often occurs when RSI enters or approaches the oversold zone near 30.

If you want to learn more about MT4 indicator settings, you can refer to this MT4 Ultimate Setup Guide: From Chart Tutorials to Technical Indicator Parameter Settings

Step 2: Identify Two Consecutive Declining Lows on the Price Chart

Focus on the price movement in the main chart. Within a clear downtrend, identify two significant consecutive lows. The key point is that the second low must be lower than the first low, forming a “Lower Low”.


Step 3: Identify the Corresponding Two Lows on the RSI Chart

Next, in the RSI indicator window below the price chart, locate the two RSI lows that correspond exactly to the two lows on the price chart. Make sure the timing matches precisely.


Step 4: Determine Whether “Bottom Divergence” Exists (Price Makes a New Low While RSI Does Not)

This is the most critical step. Compare the two sets of lows:

  • If the price forms a new low and the RSI indicator also forms a new low, this is not divergence and the downtrend may continue.
  • If the price forms a new low but the second RSI low is clearly higher than the first RSI low, congratulations, this is a standard RSI bullish divergence signal! This indicates that downward momentum is weakening.


Step 5: Confirm with Additional Signals to Improve the Accuracy of Buy Decisions

After identifying a bullish divergence signal, do not rush to enter the market immediately. A disciplined trader looks for additional confirmation signals to increase the probability of success. You may combine the following methods:

  • Wait for price confirmation: Wait for signs of a reversal in price action, such as a breakout above the descending trendline or the formation of a strong bullish candlestick pattern (such as a hammer or bullish engulfing pattern).
  • Volume analysis: If the price rebounds while trading volume increases, it is a very positive signal indicating that buying pressure is beginning to dominate the market.
  • Reference other indicators: Check whether other indicators are producing similar signals to increase confidence in your analysis.

使用RSI指標找出牛市背馳信號的四個步驟圖解,包含找出價格低點、對應RSI低點、判斷背離並等待確認。

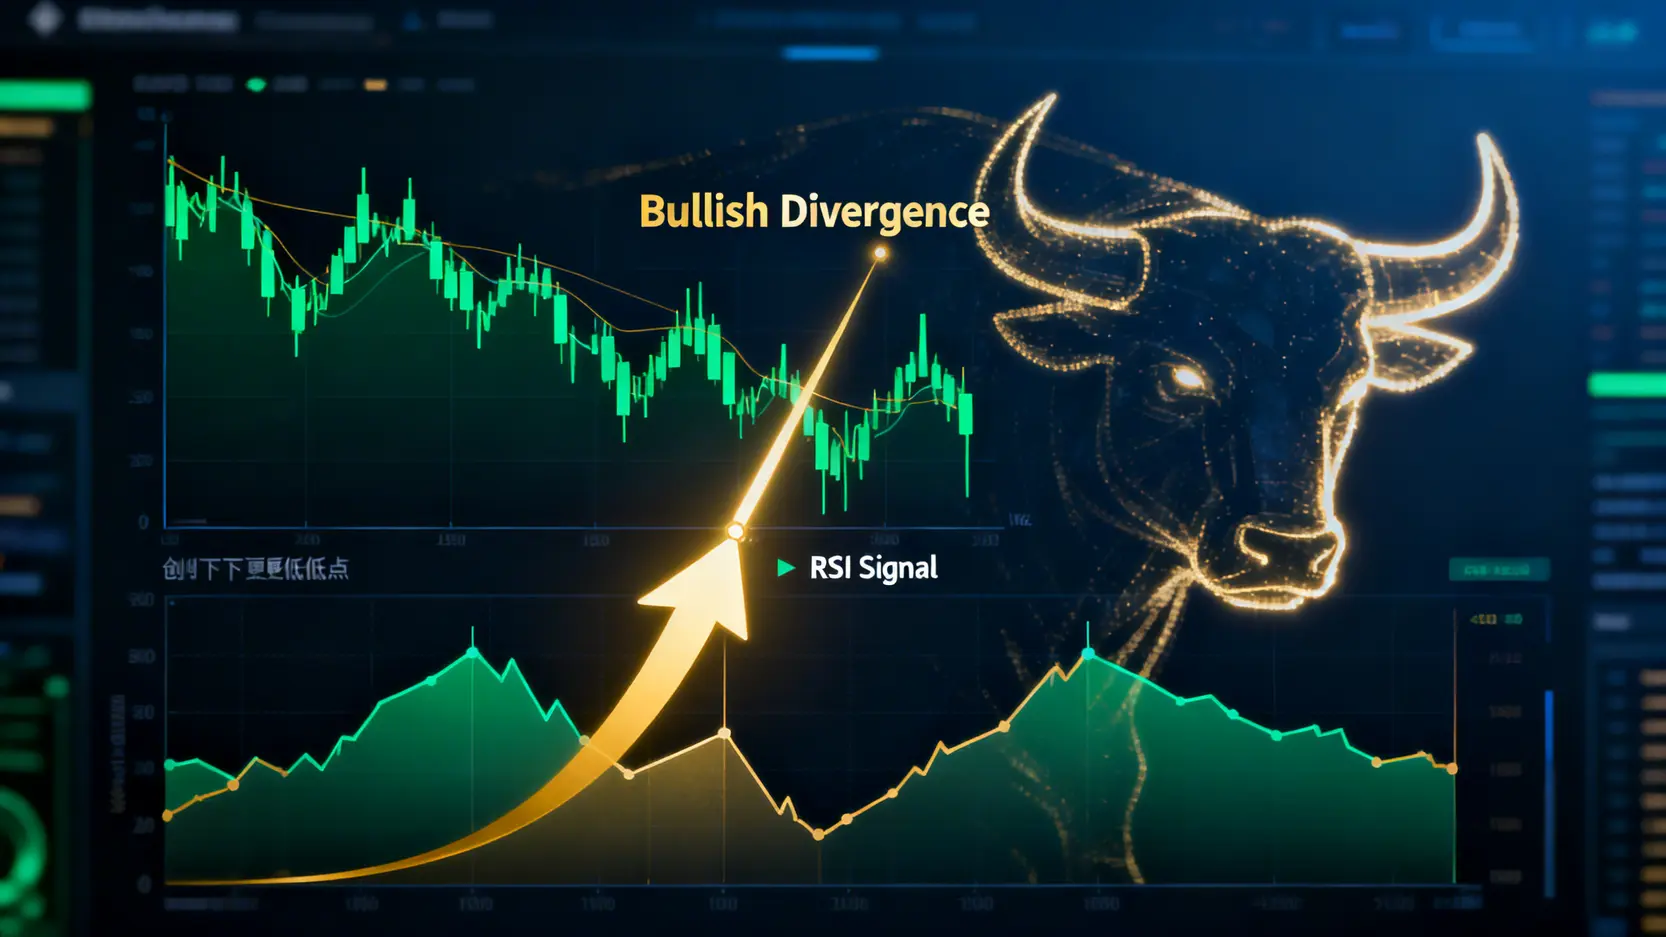
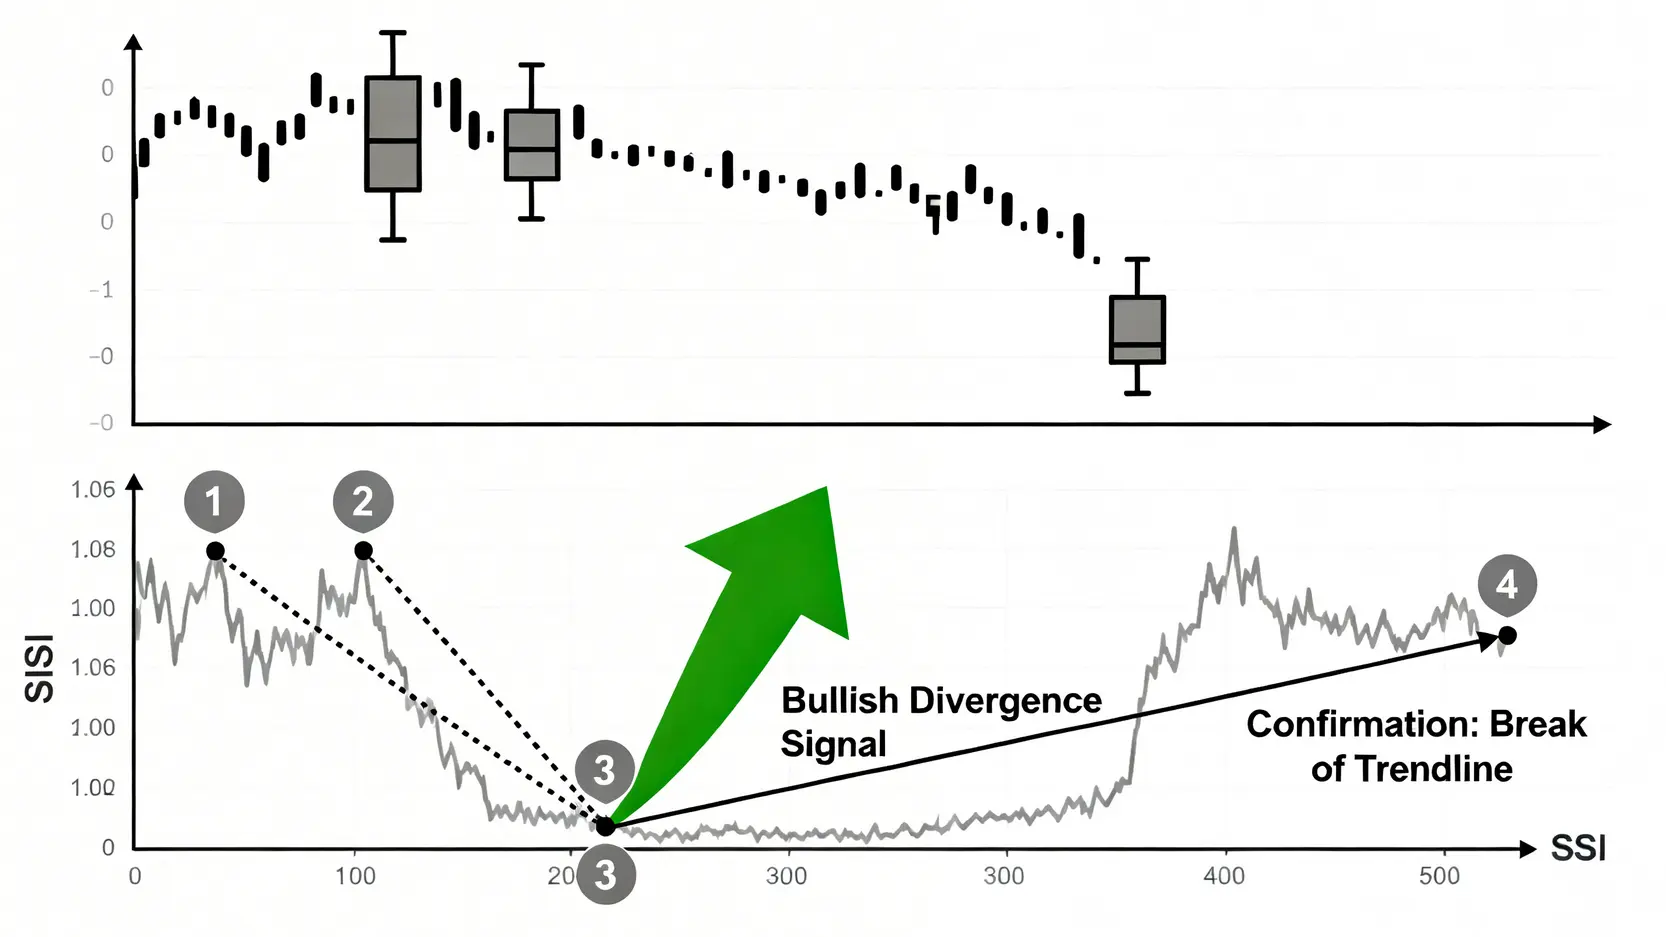
RSI Bullish Divergence Practical Illustration: From identifying divergence to confirming a breakout of the trendline.


Further Reading (Highly Recommended)

MACD Indicator Guide: Understand Fast and Slow Lines, Histogram, Golden Cross, and Divergence in One Article

How to Draw Trendlines? Learn the Four Steps to Identify Uptrends and Downtrends from the Beginning


Technical Analysis in Practice: Besides RSI, Which Indicators Can Be Used to Observe Bullish Divergence?

Although RSI is an excellent tool for observing bullish divergence, it is not the only option. Many momentum based oscillators can also be used to identify divergence. Combining multiple indicators for comprehensive analysis can effectively filter out some false signals and improve the reliability of buy signals. This forms a complete technical analysis indicator guide

Application of Bullish Divergence Signals with the MACD Indicator

The Moving Average Convergence Divergence (MACD) is another highly popular trend and momentum indicator. Bullish divergence in MACD can mainly be observed in two ways:

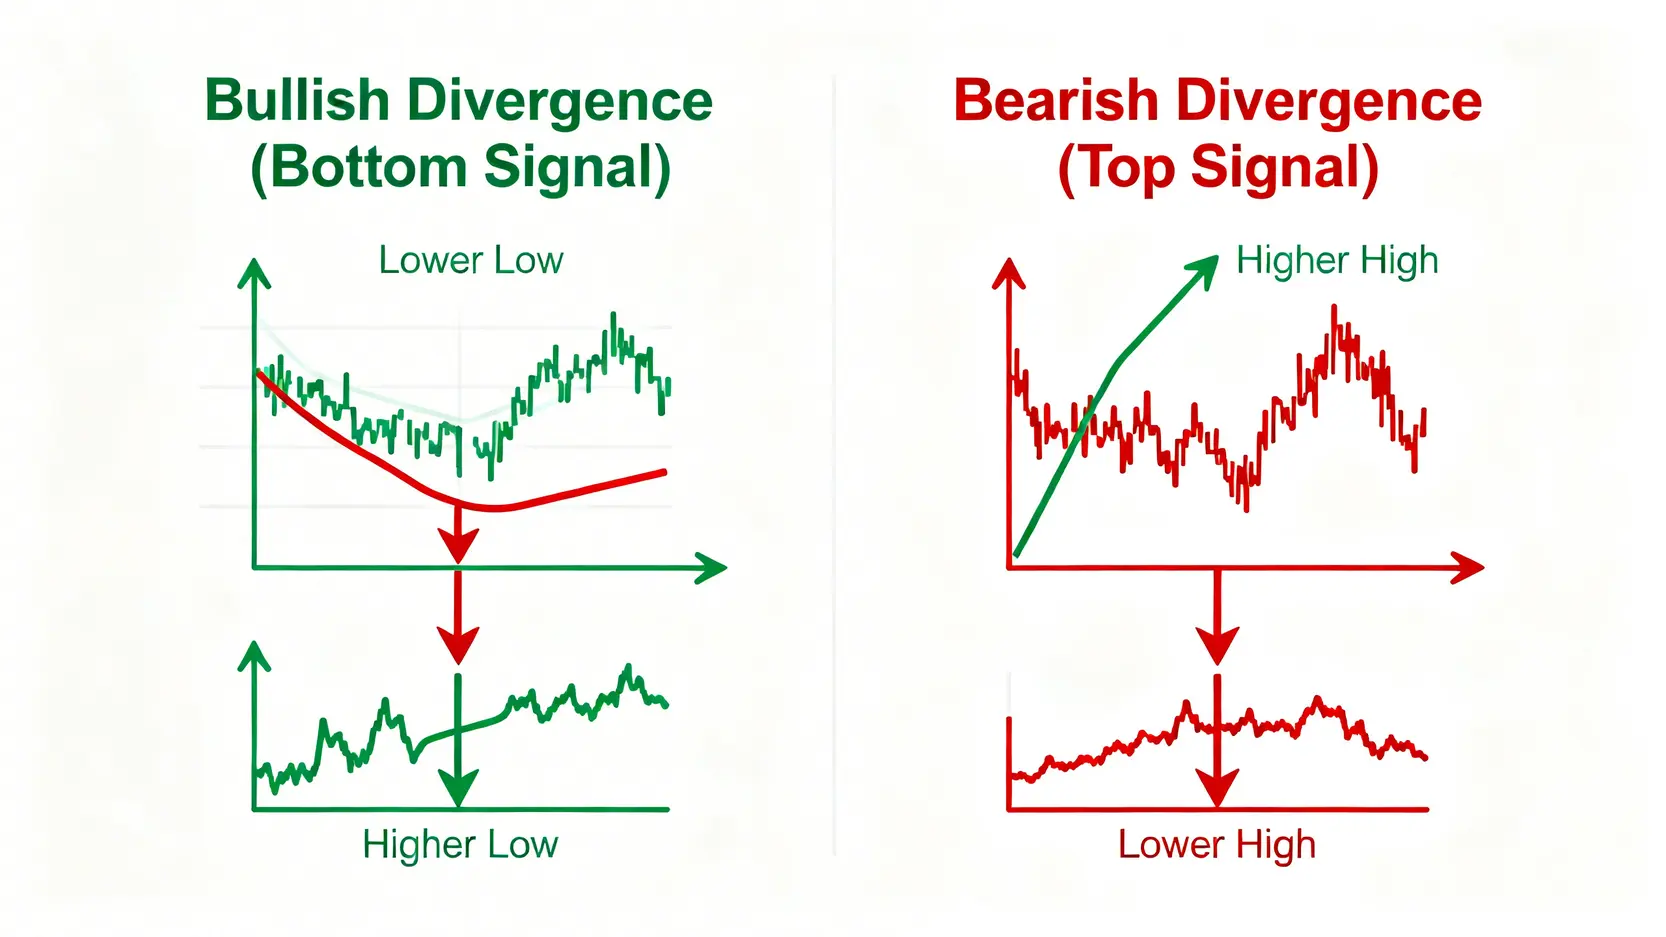
  1. Observe the MACD line (fast line) and signal line (slow line): When the price forms a new low, the corresponding low point of the MACD lines rises instead.
  2. Observe the MACD histogram: When the price forms a new low, the corresponding “trough” of the histogram below the zero line becomes shallower. This is a more common and intuitive method because the histogram directly reflects the change in the gap between the fast and slow lines, making it more sensitive in capturing changes in momentum.

To gain a deeper understanding of how to use MACD, you can read this detailed MACD indicator guide

Application of Bullish Divergence Signals with the KD Indicator (Stochastic Oscillator)

The Stochastic Oscillator (KD) measures the relative position of the closing price within its recent price range. Because it is very sensitive to price movements, it is also often used to identify divergence signals.

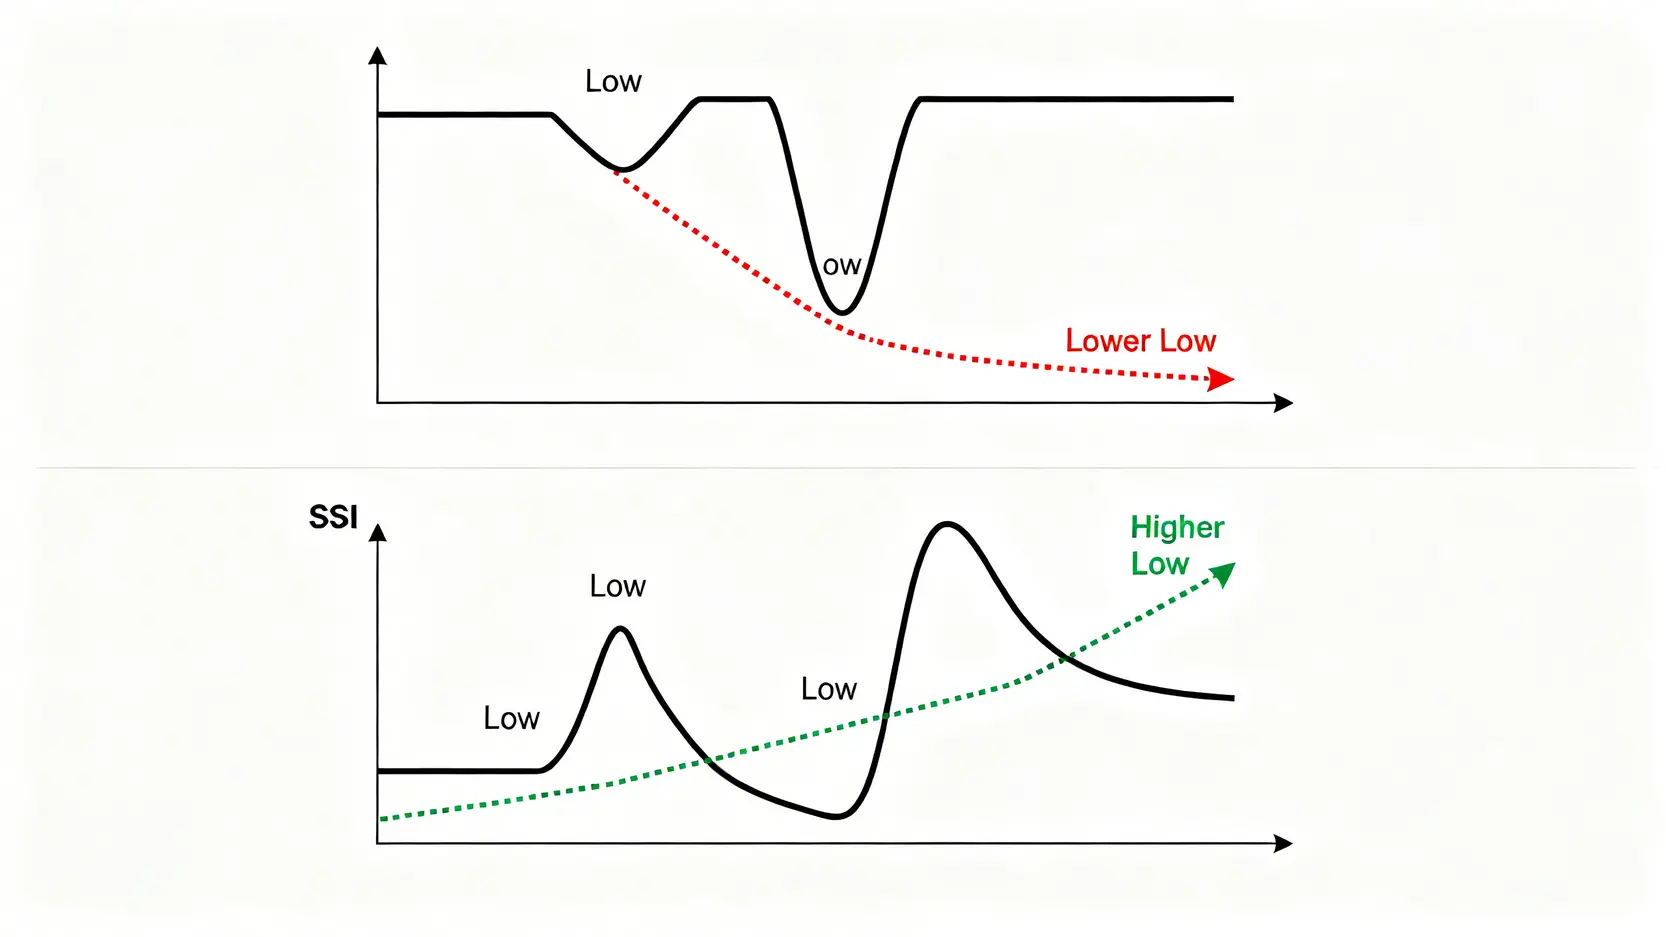
  • Observation method: When the price forms a new low while the KD indicator (usually the %K line) forms a higher low, a bullish divergence in KD is formed. This type of divergence often occurs when the KD indicator falls below the oversold zone of 20, which strengthens the signal.
  • Important note: As the KD indicator is highly sensitive, it may generate many short term divergence signals, especially in ranging markets. Therefore, when using KD to observe divergence, it is best to combine it with longer time frame charts or other trend indicators for confirmation.


Combined Application: How to Use Multiple Indicators to Improve the Reliability of Buy Signals?

Signals from a single indicator may be coincidental, but when multiple indicators produce the same warning at the same time, the reliability of the signal increases significantly. This is known in technical analysis as the principle of “confluence”.

An ideal bullish divergence buying scenario may include:

  • RSI shows bullish divergence and the indicator value rises from the oversold zone.
  • The MACD histogram also shows bottom divergence and is about to form or has already formed a golden cross below the zero line.
  • The KD indicator forms a golden cross in the oversold zone and also shows divergence.

When these signals appear simultaneously or within a similar time frame, they form a potential high probability buy signal. At that point, combining them with price action confirmation (such as a breakout above a descending trendline) provides stronger support for your trading decision.


Important Considerations and Risks When Using Bullish Divergence Signals

Bullish divergence is a powerful tool, but it is not a perfect strategy that always succeeds. In practical application, traders must clearly understand its limitations and potential traps to avoid unnecessary losses.


Trap One: Divergence May Occur Again After Divergence

This is the most common trap. When you identify a bullish divergence and prepare to enter the market, the price may pause briefly and then continue to decline, forming an even lower low. Meanwhile, the indicator may create a third or even fourth higher low. This situation is known as “divergence can diverge again”.

Response strategy: Do not treat the first divergence signal as the final entry signal. Instead, consider it a “warning” that the downward trend may be weakening. Remain patient and wait for clearer price reversal signals rather than trying to “guess the bottom”.


Trap Two: How to Distinguish Real and False Signals? The Importance of Waiting for Price Confirmation

Not all divergences lead to a trend reversal. In strong downtrends, temporary corrective divergences may appear, after which the price continues moving along the original trend. These can be considered “false signals”.

Response strategy: “Price is king”. Indicators are only tools for assistance, and the final decision should be based on price behavior. A reliable confirmation method is to draw a descending trendline and wait patiently for the price to break above it with strong volume. A breakout of the trendline is a clear signal that market structure has changed, and entering the market at this stage has a higher probability of success than buying immediately when divergence appears. 

Always Combine with Other Analytical Tools Such as Trendlines and Volume

Using bullish divergence in isolation can be very risky. A complete trading system should be multidimensional, combining divergence signals with other analytical tools to form a logical decision chain.

  • Trend analysis: Determine the overall trend on higher time frame charts. If the daily chart shows a clear uptrend, looking for bullish divergence on the hourly chart as an entry point during pullbacks can increase the probability of success.
  • Volume analysis: Volume is a direct reflection of momentum. A price rebound without volume support is weak. An ideal divergence reversal should be accompanied by a significant increase in trading volume.
  • Support and resistance: If bullish divergence occurs near an important historical support level, the reliability of the signal increases significantly.


Common Questions About Bullish Divergence (FAQ)

Q: Will the price definitely rise after bullish divergence appears?

A: Not necessarily. Bullish divergence is a high probability “potential” reversal signal, not a guaranteed prediction. It indicates that downward momentum is weakening and the probability of a market reversal is increasing, but it cannot guarantee that the price will rise. As mentioned above, divergence may occur again or may only trigger a short period of consolidation rather than a full trend reversal. Therefore, it is important to wait for price action confirmation before making a decision.

Q: What RSI parameter setting is the most accurate?

A: The standard RSI parameter is 14 periods. This setting works for most markets and time frames and is the most commonly used configuration. Some short term traders may use smaller parameters (such as 7 or 9) to obtain more sensitive signals, while long term investors may use larger parameters (such as 21 or 30) to smooth fluctuations. For beginners, it is recommended to start with the standard 14 period setting and adjust it according to personal trading style after becoming familiar with it.

Q: Is this technical analysis indicator guide applicable to all markets (such as cryptocurrency and foreign exchange)?

A: Yes. Bullish divergence reflects changes in collective market psychology and momentum, and its basic principles apply to all freely traded markets, including stocks, indices, foreign exchange, commodity futures, and cryptocurrencies. As long as the market has sufficient liquidity and participants, divergence between price and indicators holds important analytical value.

Q: Which time frame is most effective for observing bullish divergence?

A: The larger the time frame, the more reliable the divergence signal generally becomes. For example, bullish divergence appearing on a daily or weekly chart often leads to stronger and longer lasting trend reversals than divergence appearing on a 15 minute chart. Shorter time frames (such as 5 minute or 15 minute) charts generate more signals but also more false signals, making them more suitable for short term or intraday traders. For most investors, starting with a 4 hour chart or daily chart is a good choice.


Conclusion

In summary, RSI bullish divergence is a very practical technical analysis tool. It helps identify potential reversal opportunities when the market is filled with panic and prices continue to form new lows by analyzing the subtle relationship between price and indicators, allowing traders to capture ideal buy signals. Through this article, from the definition of bullish divergence meaning and the five step method to identify RSI bullish divergence signals, to the practical application and risk considerations involving MACD and KD indicators, you have learned the complete knowledge from theory to practice. Now open your trading charts and start practicing how to identify the next bullish divergence signal, allowing technical analysis to become a powerful assistant on your investment journey.

If you liked this article, please share it!

Related Articles

  • Volatility Surface Guide: Skew Trading Strategies
    Practical Applications of Volatility Surfaces: From Options Modeling to Advanced Skew Trading Strategies In options markets, implied volatility is never a flat line. Instead, it forms complex "smile" or "skew" surfaces. For advanced traders, mastering the practical applications of volatility surfaces is equivalent to possessing a lens that reveals market...
    2026 年 6 月 3 日
  • Foreign Capital Flow Model: Track Institutional Money
    Building a Foreign Capital Flow Copy Trading Model: A Stock Market Indicator for Accurately Tracking Institutional Positioning In Asia-Pacific stock markets, foreign capital inflows and outflows often determine the direction of the index. However, simply looking at daily net buy and sell data is no longer enough. Only by building...
    2026 年 6 月 3 日
  • Options Buying Strategies for Extreme Market Risks
    Options Buyer Strategies During Extreme Market Conditions: Black Swan Hedging and Cross-Market Arbitrage During Volatility Surges The most terrifying aspect of financial markets is not a gradual decline, but overnight flash crashes and cross-market capital withdrawals accompanied by volatility surges. In the highly unpredictable global macroeconomic environment of 2026, geopolitical...
    2026 年 6 月 3 日
返回顶部