Python Quant Trading Tutorial: Build a Trading Bot

Updated: 2026/04/07  |  CashbackIsland

python-quantitative-trading-guide

Python Quantitative Trading Tutorial: From Zero to One, Build Your Automated Trading Robot in 5 Steps

Are you tired of trading based on intuition, constantly chasing highs and selling lows, and being swayed by market emotions? Looking for a more scientific and disciplined investment approach? A Python quantitative trading tutorial is the powerful tool that addresses these pain points. It allows you to replace emotions with data and logic, and build an objective investment system. This beginner-focused guide to quantitative trading programs will take you from zero, step by step, to explore how to get started with quantitative trading. Even without any programming background, you can easily get started and build your first automated trading program.


What Is Quantitative Trading? Why Mastering Python Is Your First Step

Before diving into practical operations, it is essential to understand the core concepts. Quantitative trading is not some mysterious high-tech concept, but rather an investment methodology based on data and models, and Python is the best language to implement this methodology.


The Core Concept of Quantitative Trading: Say Goodbye to Subjective Judgment and Let Data Speak

Simply put, quantitative trading is the process of “programming” your investment logic and trading strategies.量化交易與主觀交易的對比圖,左邊是情緒化的人類看著混亂的圖表,右邊是冷靜的機器人根據清晰的訊號進行交易。

Quantitative Trading vs. Subjective Trading: Data Replaces Intuition

It includes the following core elements:

  • Strategy Development: By analyzing historical data, identify potentially profitable patterns, such as “buy when indicator A breaks above indicator B”.
  • Strategy Backtesting: Apply the developed strategy to a longer set of historical data for simulated trading to evaluate its performance and risk.
  • Automated Execution: Once the strategy passes validation, deploy it to live trading, allowing the computer to monitor the market 24 hours a day and automatically execute trades, completely eliminating human weaknesses.

量化交易的三大核心流程圖,包含策略開發、策略回測與自動執行三個循環步驟。

The Core Cycle of Quantitative Trading: Development, Backtesting, Execution

The essence of this approach is to transform investment decisions from “I feel it will rise” into “data shows that under the same conditions in the past 100 instances, the probability of rising is 70%”. What it pursues is long-term, stable statistical advantages, rather than one-time opportunities for sudden wealth.


Three Irreplaceable Advantages of Python in Quantitative Trading

There are many programming languages available on the market, so why has Python become dominant in the field of quantitative trading? The reason lies in its irreplaceable ecosystem and characteristics, which is also why this Python quantitative trading tutorial chooses it as the entry-level tool.

  1. Rich and powerful third-party libraries: Python has a vast number of open-source libraries specifically built for data science and financial analysis. For example:
    • Pandas: A powerful tool for processing and analyzing time series data, (such as stock prices).
    • NumPy: An efficient numerical computation tool and the foundation of many scientific calculations.
    • Matplotlib / Seaborn: Powerful data visualization tools that present complex data in chart form.
    • Scikit-learn: A machine learning library that can be used to build more advanced predictive models.
  2. Active community and open-source resources: No matter what problems you encounter, you can almost always find solutions online. From code examples and strategy sharing to troubleshooting, the large developer community is your best support throughout the learning process.
  3. Simple and easy-to-learn syntax: Compared to C++ or Java, Python syntax is closer to natural language, with a gentler learning curve, allowing beginners to focus more on trading logic rather than complex programming syntax.


Getting Started in 5 Steps: Begin Your Python Quantitative Trading Journey

No matter how much theory you learn, it is better to take action. Next, we will move into the core of this tutorial and guide you step by step through the complete process, from environment setup to strategy backtesting, helping you gain a clearer understanding of getting started with quantitative trading programs.


Step 1: Set Up the Development Environment (Install Python and Required Libraries)

Getting started is often the hardest part, but setting up the environment is simpler than you think. Beginners are recommended to install Anaconda, a distribution that integrates the Python core program with many commonly used scientific computing libraries, helping you avoid tedious installation and configuration.

  1. Go to the official Anaconda website to download the installer suitable for your operating system and complete the installation.
  2. Open Anaconda Navigator and launch Jupyter Notebook or Spyder, which will be the integrated development environment (IDE) where we will write code later.
  3. To obtain stock price data, we need to install an additional library. Enter the following command in the terminal (Terminal/CMD):
    pip install yfinance

After completing these three steps, your quantitative trading development environment is ready!


Step 2: Obtain Market Data (How to Connect to a Free Stock Price API)

Data is the lifeblood of quantitative trading. Fortunately, there are many free resources available for obtaining historical stock prices. We will use the yfinance library we just installed to fetch stock price data for TSMC (2330.TW) as an example.

In your Jupyter Notebook or Spyder, enter the following code:

import yfinance as yf

import pandas as pd

# Download TSMC stock price data from 2020-01-01 to today

df = yf.download(‘2330.TW’, start=’2020-01-01′)

# Display the first five rows of data

print(df.head())

After running it, you should see a table containing information such as the opening price (Open), highest price (High), lowest price (Low), and closing price (Close). This is the foundation of our strategy analysis. 

Further Reading (Highly Recommended)

The Ultimate Guide to SMA vs EMA vs WMA: A Complete Breakdown of Moving Average Types and Which One Is Best Suited for…

What Is an MT4 EA? Beginner’s Guide: From Automated Trading to Installation and Backtesting Tutorials

Step 3: Design Your First Trading Strategy (Using a Moving Average Crossover as an Example)

Now that we have the data, let’s design one of the most classic beginner strategies: the Moving Average (MA) crossover strategy. The logic of this strategy is very simple:

  • Golden Cross (Buy Signal): When the short-term moving average (such as the 10-day line), crosses above the long-term moving average (such as the 30-day line), it indicates that the short-term trend is strengthening and may be a buying opportunity.
  • Death Cross (Sell Signal): When the short-term moving average crosses below the long-term moving average, it indicates that the short-term trend is weakening and may be a selling opportunity.

移動平均線交叉策略示意圖,展示了黃金交叉(買入訊號)和死亡交叉(賣出訊號)在股價K線圖上的表現。

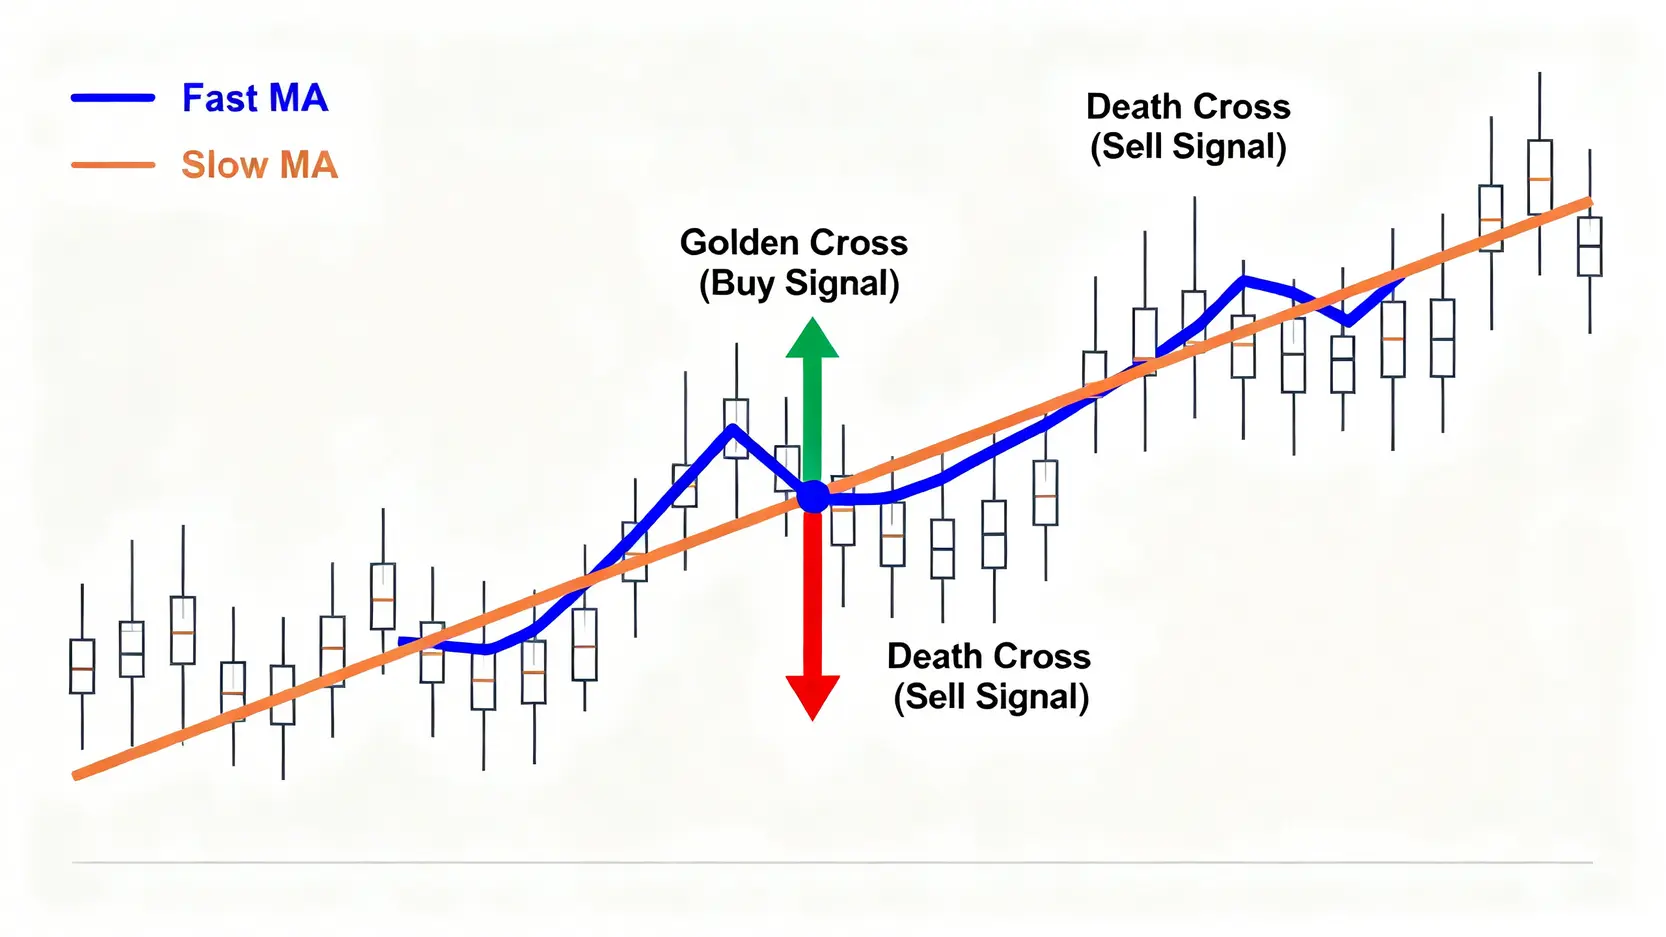
Moving Average Strategy: Golden Cross and Death Cross

We use Python to calculate these two moving averages:

# Calculate the 10-day and 30-day moving averages

df[‘MA10’] = df[‘Close’].rolling(window=10).mean()

df[‘MA30’] = df[‘Close’].rolling(window=30).mean()

# Display the most recent rows of data to observe the calculation results

print(df.tail())


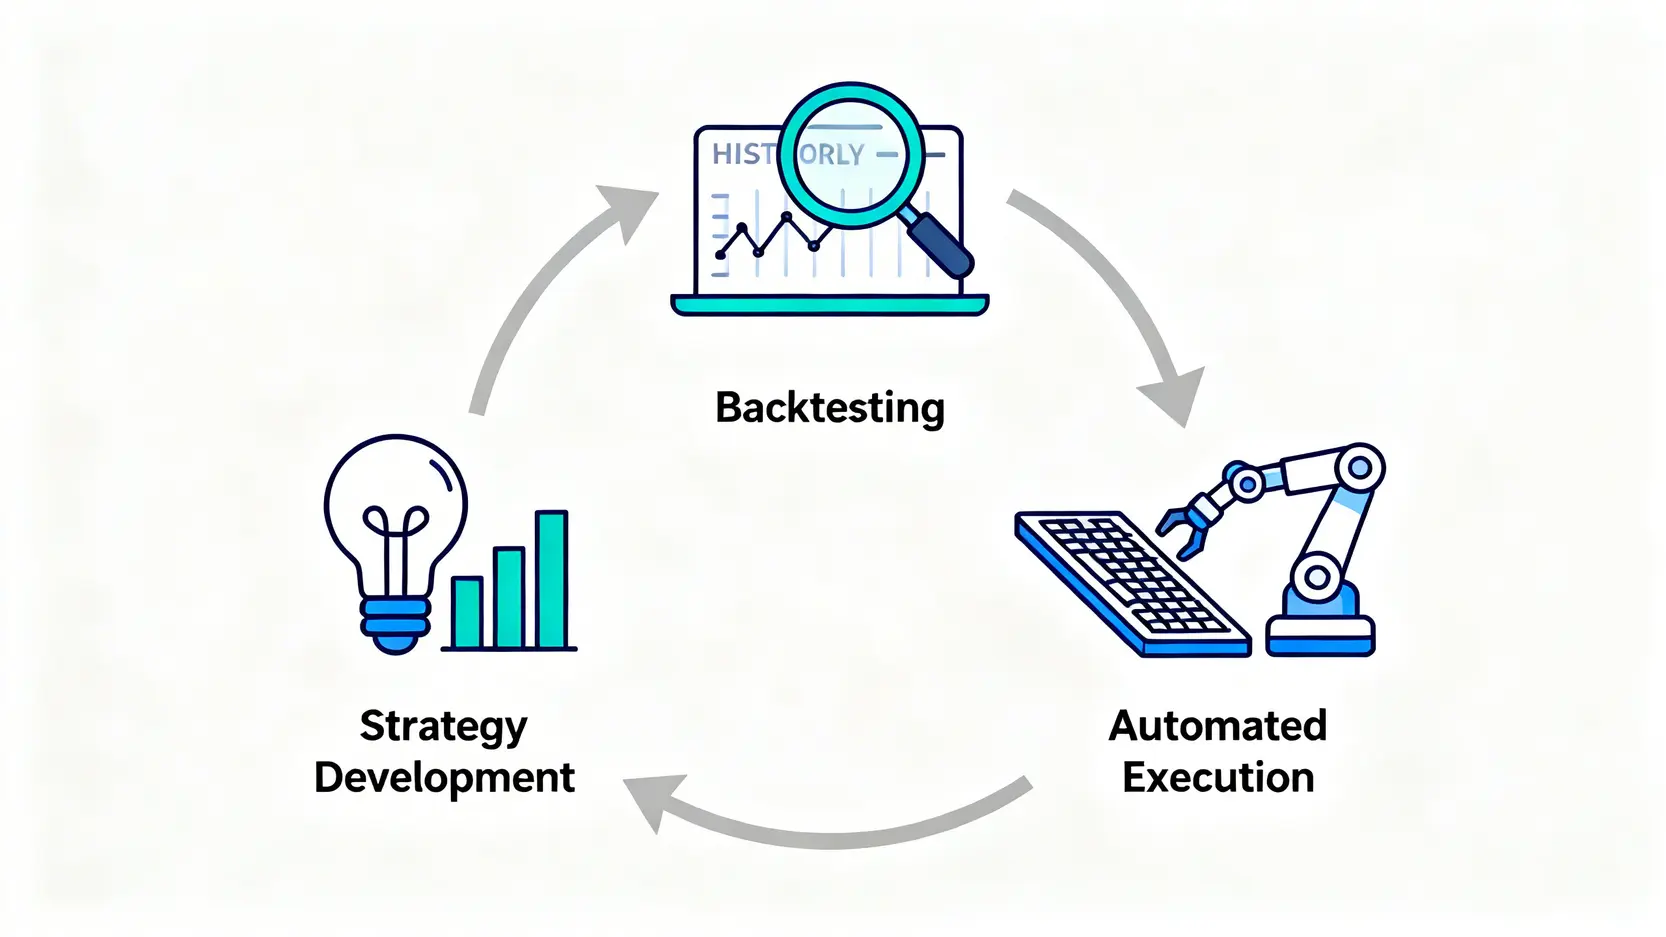
Step 4: Run a Strategy Backtest (Validate Your Idea with Historical Data)

No matter how good a strategy may seem, it must be tested against historical data. Backtesting is the process of simulating trades using past data to see how the strategy would have performed. A simple backtesting process is as follows:

  1. Generate signals: Go through the data and record a buy signal when a golden cross occurs, and a sell signal when a death cross occurs.
  2. Simulate trading: Carry out simulated buys and sells based on the signals, and calculate the profit or loss of each trade.
  3. Evaluate performance: Measure key indicators such as total return, win rate, and maximum drawdown (MDD).

Although a complete backtesting program is relatively complex, its core principle is to objectively evaluate the feasibility of a strategy. Through backtesting, you may find that your original idea is not actually viable in the real market, which can help you avoid paying expensive tuition in live trading.


Step 5: Connect Automated Trading (How to Connect to a Broker API for Live Execution)

When your strategy performs well in backtesting, the final step is to automate it. This is done through a “broker API (Application Programming Interface)”.

An API acts as the bridge between your program and the broker’s order execution system. Your program can send instructions through the API, such as “buy one lot of TSMC at market price”, and the broker’s system will execute the order once it receives the instruction. Many overseas futures and forex brokers, as well as local securities brokers, provide API services, allowing investors to connect their own trading systems to the market and achieve true 24-hour automated trading.


Further Reading (Highly Recommended)

What Is an MT4 EA? Beginner’s Guide: From Automated Trading to Installation and Backtesting Tutorials


Python Quantitative Trading FAQ

I have no programming experience at all. Can I learn Python quantitative trading?

Absolutely. Python is widely recognized as one of the most beginner-friendly programming languages. At the beginning, you can start by imitating and modifying open-source strategy examples available online, focusing on understanding the underlying trading logic. Once you become familiar with the basic syntax, you can gradually try writing your own strategies. The process of learning quantitative trading is also the process of improving your programming skills.

Can quantitative trading guarantee profits? What common risks should I be aware of?

Quantitative trading does not guarantee profits. Its biggest risk comes from “strategy failure”. Common risks include:

  • Overfitting: The strategy performs exceptionally well during backtesting, but it is merely overfitting the noise in historical data and performs poorly in live trading.
  • Changes in market structure: Previously effective patterns may become invalid due to regulatory changes, black swan events, or other factors.
  • Technical risks: Program bugs, network interruptions, API failures, and similar issues may lead to unexpected losses.

Therefore, continuously monitoring strategy performance and establishing a comprehensive risk management framework is crucial.

What financial knowledge is required before learning Python quantitative trading?

Having basic financial knowledge will make your learning process more efficient. It is recommended to understand at least:

  • Basic market operations: Understand the trading rules of different instruments such as stocks, futures, and forex.
  • Technical analysis indicators: Be familiar with commonly used indicators such as Moving Average (MA), Relative Strength Index (RSI), and Bollinger Bands, including their meaning and applications.
  • Risk management concepts: Understand basic risk control principles such as stop-loss, capital management, and position sizing.

Programming is a tool, but financial knowledge is the core factor that determines the effectiveness of a strategy.


Conclusion

Congratulations! By following this Python quantitative trading tutorial, you have mastered the complete beginner workflow, from concepts and environment setup to strategy backtesting. Quantitative trading is not an unreachable technology, but a powerful methodology that helps you conduct scientific and disciplined investing. Its greatest value lies in forcing you to transform vague market “feelings” into clear and verifiable “rules”. Now is the time to put it into practice, begin your journey into quantitative trading programs, and take the first step toward rational investing!

If you liked this article, please share it!

Related Articles

  • Volatility Surface Guide: Skew Trading Strategies
    Practical Applications of Volatility Surfaces: From Options Modeling to Advanced Skew Trading Strategies In options markets, implied volatility is never a flat line. Instead, it forms complex "smile" or "skew" surfaces. For advanced traders, mastering the practical applications of volatility surfaces is equivalent to possessing a lens that reveals market...
    2026 年 6 月 3 日
  • Foreign Capital Flow Model: Track Institutional Money
    Building a Foreign Capital Flow Copy Trading Model: A Stock Market Indicator for Accurately Tracking Institutional Positioning In Asia-Pacific stock markets, foreign capital inflows and outflows often determine the direction of the index. However, simply looking at daily net buy and sell data is no longer enough. Only by building...
    2026 年 6 月 3 日
  • Options Buying Strategies for Extreme Market Risks
    Options Buyer Strategies During Extreme Market Conditions: Black Swan Hedging and Cross-Market Arbitrage During Volatility Surges The most terrifying aspect of financial markets is not a gradual decline, but overnight flash crashes and cross-market capital withdrawals accompanied by volatility surges. In the highly unpredictable global macroeconomic environment of 2026, geopolitical...
    2026 年 6 月 3 日
返回顶部