The Ultimate Guide to SMA vs EMA vs WMA: A Complete Breakdown of Moving Average Types, Which One Is Right for You?
Have you ever felt confused when looking at technical analysis charts, unsure which line to use to judge market trends? Moving averages (MA) are among the most widely used technical indicators, yet there are many types available. What exactly are the differences between the most common ones including the SMA moving average, EMA exponential moving average and WMA weighted moving average? How should traders choose? This article will take you deep into these three mainstream moving averages, from calculation principles to practical application, helping you find the perfect moving average that best suits your trading style.
What Is a Moving Average (Moving Average, MA)? Why It Is the First Step in Technical Analysis
Before comparing SMA, EMA, and WMA in depth, we must first understand the core value of moving averages. Simply put, they represent the market price “average”, but this average continuously “moves”.
The Core Concept of MA: Smoothing Price Fluctuations to Identify Market Trends
Daily prices in financial markets (whether stocks, forex, or cryptocurrencies), are filled with noise and short term volatility. These random price movements can easily lead to incorrect judgments. The function of a moving average is to average prices over a specific time period, forming a relatively smooth curve.
This curve helps traders to:
Filter noise: Ignore short term price volatility and focus on the underlying direction.
Identify trends: When the MA curve slopes upward, it indicates an uptrend. Conversely, when it slopes downward, it indicates a downtrend.
Assess strength: The steeper the slope, the stronger the trend.
It can be said that mastering moving averages is the first and most important step in learning technical analysis.
Why Is It Crucial to Understand Different Types of Moving Averages?
If MA is so useful, why do we need to distinguish between SMA, EMA, and WMA? The key lies in the different methods of “averaging”, which cause them to react to price changes at different speeds.
Some moving averages are particularly sensitive to recent prices and are suitable for short term traders seeking to capture rapid market movements.
Other moving averages respond more smoothly and are better suited for long term investors to confirm the stability of long term trends.
Choosing the wrong moving average may cause you to miss optimal entry opportunities or be misled by frequent false signals during market consolidation. Therefore, understanding the characteristics and calculation differences of various moving averages is an essential step in improving trading decision quality.
In Depth Analysis of Three Mainstream Moving Averages
Next, we will break down the calculation principles and characteristics of SMA, EMA, and WMA one by one, allowing you to fully understand their underlying logic.
Simple Moving Average (SMA): The Purest Representation of Average Market Cost
SMA (Simple Moving Average) is the most basic and widely known type of moving average. Its calculation method is very straightforward: add together the closing prices over a specific past period (such as 20 days) and divide by the number of periods to obtain an arithmetic average.
SMA = (P1 + P2 + … + Pn) / n
Where P represents the daily closing price and n represents the period. The defining feature of SMA is that each day’s price within the period carries equal weight. For example, in a 20 day SMA, the price on day 1 and the price on day 20 have exactly the same influence. This makes the SMA line the smoothest, but also causes it to respond the slowest to price changes.
Exponential Moving Average (EMA): Closer to Recent Price Movements
EMA (Exponential Moving Average) was designed to address the slow responsiveness of SMA. The calculation of EMA is more complex. It introduces a “smoothing factor” that assigns greater weight to more recent prices.
Simply put, today’s EMA value not only considers today’s closing price, but also includes part of “yesterday’s EMA value”. This means EMA continuously retains memory of past price data, but the influence of older data decays exponentially over time.
This design makes EMA respond faster and more sensitively to price changes than SMA, allowing it to reflect trend shifts earlier. Therefore, EMA is widely favored by short term and swing traders.
Weighted Moving Average (WMA): Assigning the Highest Weight to Recent Prices
WMA (Weighted Moving Average) is a type of moving average that is conceptually positioned between SMA and EMA. Its goal is also to give more importance to recent prices, but its weighting method is “linear”.
When calculating a 10 day WMA, the price on day 10 (the most recent day), is multiplied by a weight of 10, the price on day 9 is multiplied by 9, and so on, until the price on day 1 is multiplied by 1. The total is then divided by the sum of the weights.
WMA = (P11 + P22 + … + Pn*n) / (1 + 2 + … + n)
WMA is more responsive than SMA, but its weight distribution is not as smooth as EMA. Among the three, WMA places the greatest emphasis on recent prices, so it is typically the fastest to respond. However, it may also produce more whipsaws and false signals.
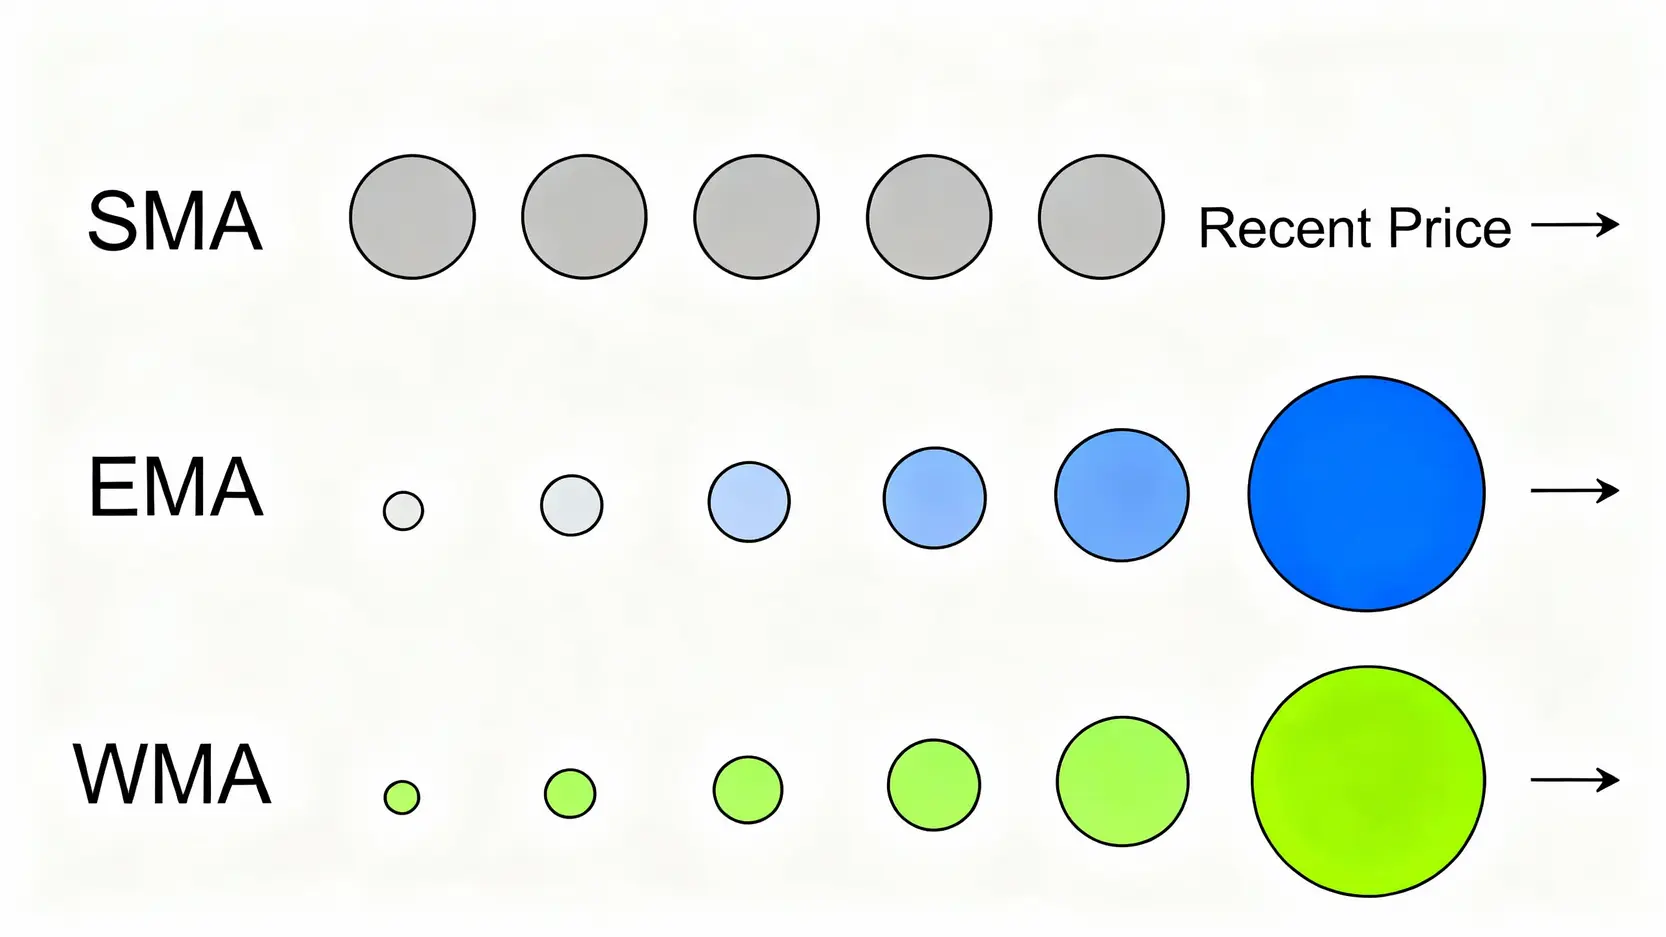
Illustration: How SMA, EMA, and WMA assign different “weights” to price. The closer the price data is to the present, the greater the influence assigned by EMA and WMA.
[Chart Showdown] SMA vs EMA vs WMA: A Complete Comparison of Key Differences
After covering so much theory, let us compare these three moving averages in a more intuitive way by examining their practical differences on charts and analyzing their respective strengths and weaknesses, helping you determine which moving average to use in different market conditions.
Core Differences: Sensitivity vs Smoothness
When SMA, EMA, and WMA with the same period are plotted on the same chart, their differences become very clear:
Sensitivity (reaction speed): WMA > EMA > SMA
Smoothness (noise resistance): SMA > EMA > WMA
WMA and EMA are like sports cars. They accelerate quickly and can rapidly keep up with the latest price changes, but they are also more likely to shake sharply due to small stones on the road (which represent market noise).
On the other hand, SMA is like an ocean going cargo ship. It starts slowly and turns slowly, but once its course is set, it is not easily disturbed by small waves (meaning short term fluctuations) and therefore moves in the most stable manner.
Comparison Table of Strengths and Weaknesses of the Three Moving Averages
To give you a clear overview at a glance, we have summarized the characteristics of the three moving averages in the table below:
Indicator Type
Calculation Method
Advantages
Disadvantages
Applicable Scenarios
SMA (Simple)
Arithmetic average, equal weighting
Highest smoothness, less noise, stable trend signals
Lagging signals, slow response, may miss optimal entry and exit points
Long term trend identification, finding long term support and resistance
EMA (Exponential Smoothing)
Exponentially weighted, higher weight on recent prices
Highly responsive, able to capture trend reversals earlier
Prone to false signals (whipsaws) in ranging markets
Short term trading, swing trading, momentum capture
WMA (Weighted)
Linearly weighted, highest weight on recent prices
Fastest response speed, extremely close to recent price movements
Most susceptible to noise, unstable signals
Intraday trading, rebound trading, strategies that are extremely sensitive to price
Trading Strategy Selection: Use SMA for Long Term Trends, EMA for Short Term Swings
Based on the comparison above, choosing which moving average to use depends entirely on your trading style and timeframe:
Long term investors (from several months to several years): You are more concerned with whether the overall trend has changed, rather than daily fluctuations. The smoothness of SMA helps you filter out insignificant market noise and focus on the primary bull and bear trends. Common long period SMAs, such as the 100 day or 200 day lines, are often regarded as the market’s lifeline.
Swing and short term traders (from several days to several weeks): Your goal is to capture the beginning and end of a trend. The responsiveness of EMA allows you to identify trend initiation or reversal signals earlier than those using SMA, enabling better entry prices. Commonly used medium and short period EMAs include the 12, 26, or 50 day lines.
How to Effectively Use Moving Averages? Two Golden Trading Rules
After understanding the characteristics of different moving averages, the next step is to apply them in actual trading. Below are two of the most classic and effective moving average trading rules.
Rule One: Practical Application of the Golden Cross and Death Cross
This is a classic strategy that uses two moving averages of different periods (one short term and one long term), to identify bullish and bearish trend transitions.
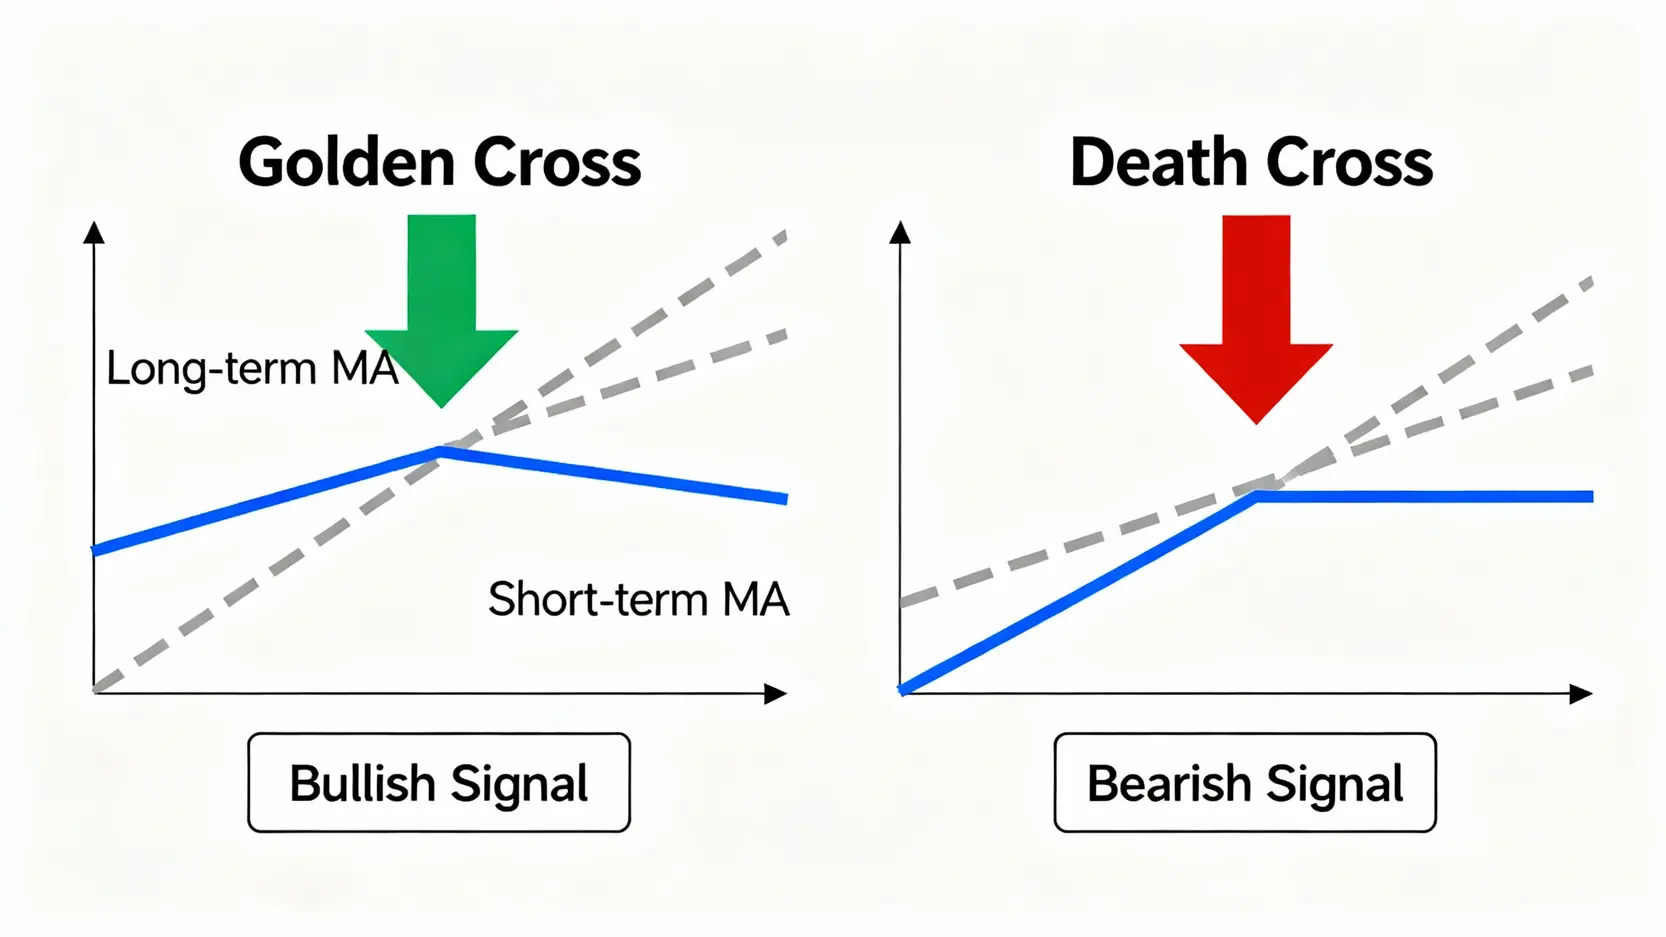
Golden Cross: When a short period moving average (such as the 50 day EMA) crosses above a long period moving average (such as the 200 day SMA) from below, it is regarded as a strong bullish signal, suggesting that a long term uptrend may be about to begin.
Death Cross: When a short period moving average crosses below a long period moving average from above, it is a strong bearish signal, indicating that the market may be entering a long term bear phase.
The golden cross (on the left) signals an uptrend, while the death cross (on the right) signals a downtrend.
This rule combines short term momentum with long term trend direction and serves as an important entry and exit reference for many trend traders.
Rule Two: Using Moving Averages to Identify Dynamic Support and Resistance Levels
In addition to determining trend direction, moving averages themselves can also serve as dynamic references for “support” and “resistance”.
In an uptrend: When price pulls back, it often finds support near a moving average and rebounds upward. This moving average becomes a dynamic support level, providing potential buying opportunities for traders.
In a downtrend: When price rebounds, it is more likely to encounter resistance at a moving average and then decline again. In this case, the moving average acts as a dynamic resistance level and represents a potential sell or short opportunity.
Traders can observe which moving average (such as the 20 EMA or 50 SMA), a particular instrument reacts to most consistently, and incorporate it into their own trading system.
Common Questions (FAQ)
Q: Which indicator is better, SMA or EMA?
A: There is no absolute “better”, only what is “more suitable”. If you prefer long term holding and do not want to be disturbed by short term fluctuations, the smoothness of SMA is more suitable for you. If you pursue efficiency and want to capture trend changes as early as possible as a short term or swing trader, the responsiveness of EMA will be a strong ally.
Q: How should the period (number of days) of a moving average be set?
A: The period setting depends on your trading timeframe. Generally: – Short period (5 to 20): Suitable for intraday traders or short term rebound trades, such as 10 or 20 EMA. – Medium period (20 to 60): Suitable for swing traders to capture a complete trend, such as 50 or 60 SMA or EMA. – Long period (100 to 200): Suitable for long term investors to judge major bull and bear market transitions, such as 100 or 200 SMA.
Q: Do moving averages become ineffective in ranging markets?
A: Yes. This is the biggest limitation of moving averages. MA is a “trend following indicator”. In consolidation (or sideways) markets without a clear trend, moving averages tend to flatten and repeatedly intertwine with price, causing signals such as golden crosses and death crosses to appear frequently but fail, leading to losses for traders. Therefore, when using moving averages, it is best to combine them with other indicators (such as RSI or Bollinger Bands) to determine whether the market is in a trending environment.
Q: Can multiple moving averages be used at the same time?
A: Absolutely, and this is a very common strategy. Many traders place multiple moving averages with different periods on the same chart (such as 10, 20, 50, and 200), forming a “moving average cluster”. When all moving averages align upward or downward in the same direction (known as bullish or bearish alignment), it indicates a very strong trend and a high probability trading opportunity.
Conclusion
In summary, the three mainstream types of moving averages, SMA moving average, EMA exponential moving average and WMA weighted moving average do not have absolute superiority or inferiority. The key is whether they fit your trading philosophy. SMA, with its smoothness and stability, serves as the foundation for long term investors to confirm major trends. EMA and WMA, with their higher responsiveness, are favored by short term traders for capturing fleeting market momentum. Developing a deep understanding of the fundamental differences and calculation logic of these three moving averages is the critical first step toward improving trading decision accuracy and building a personal trading system. Open your charting platform now and start reviewing and testing to see which moving average best matches your trading rhythm!
How to Get Started with Bitcoin? The Complete 2026 Bitcoin Buying Guide for Beginners After watching Bitcoin repeatedly reach new highs in recent years and successfully pass spot ETF reviews in the US and Hong Kong in 2024, officially entering mainstream financial markets, many investors have turned their attention to...
Is Gold’s V-Shaped Rebound a Bottom-Fishing Signal? A Complete Guide to Trading Strategies Amid “$100 Price Swings” What Is a Gold V-Shaped Rebound? More Than Just a Technical Pattern The gold market has recently experienced sharp rises and falls, with prices frequently displaying dramatic “gold V-shaped rebounds”. Single-day “$100 price...
What Is PPI Data? 2026 Latest Analysis: Understand the Differences from CPI and How It Affects Stock Market Trends With market information constantly changing, do you always hold your breath while waiting for CPI data to be released? But did you know that a more forward-looking inflation indicator, PPI data...