KD Divergence Guide: 3 Steps for Buy & Sell Signals

Updated: 2026/03/25  |  CashbackIsland

kd-indicator-divergence-guide

KD Indicator Divergence Tutorial: 3 Steps to Identify High and Low Divergence and Capture Key Buy and Sell Signals!

Many investors understand the golden cross and death cross of the KD indicator but often overlook a stronger reversal signal: “KD Indicator Divergence”. When the price trend and the indicator move out of sync, for example, when the price reaches a new high or low while the KD indicator’s peaks or troughs do not follow, this is a typical “divergence”. This usually signals that the strength of the current trend is weakening, and a potential major market movement may be imminent. This article uses detailed illustrations to guide you through identifying KD high-level divergence and the opportunities implied by KD low-level divergence, ensuring you no longer miss critical market reversal buy and sell points.


What Is KD Indicator Divergence? Understand the Core Concept in One Article

Before diving into divergence, let’s quickly clarify the basic components of the KD indicator and the root cause of divergence. Understanding these two points is the foundation for mastering KD divergence analysis.


Quick Review: The Basic Principle of the KD Indicator (Stochastic Oscillator)

The KD indicator, also known as the “Stochastic Oscillator”, is a momentum indicator widely used in technical analysis. It mainly consists of two lines: the fast line (%K) and the slow line (%D).

  • %K Value (Fast Line): Measures the current closing price’s position within the high-low range of a “recent period” (usually 9 days). It reacts quickly and is more sensitive.
  • %D Value (Slow Line): The moving average of the %K value (usually 3 days), smoother in reaction, serving as the main trend confirmation line.

The core logic of the KD indicator is: when the price rises, the closing price tends to approach recent highs; when the price falls, the closing price tends to approach recent lows. The indicator ranges from 0 to 100, typically considered “overbought” above 80 and “oversold” below 20. For a more detailed KD indicator tutorial, refer to this article: MACD Indicator Tutorial|Understand Fast and Slow Lines, Histogram, Golden Cross, and Divergence in One Article!.


Definition of Divergence: Why Price and Indicator Can Move “Out of Sync”?

“Divergence” is an important concept in technical analysis, referring to a conflict or inconsistency between the direction of price movement and the indicator. In terms of KD indicator divergence, it reflects changes in price momentum. In simple terms:

  • Price makes a new high, but momentum does not: This means that although the price is rising, the underlying buying strength is weakening, and the upward momentum is insufficient, possibly leading to a downward trend reversal.
  • Price makes a new low, but momentum does not: This indicates that although the price is being pushed lower, the underlying selling pressure is easing, downward momentum is slowing, and a trend reversal upward may occur.

KD 指標背馳核心概念示意圖,左側顯示價格與指標同步上升,右側顯示價格創新高而指標未創新高的不同步狀態。

Illustration: When price movement and indicator momentum are “out of sync”, this is the core concept of divergence.

This “out of sync” serves as a warning, indicating that the market’s real strength may not match the apparent price trend. Authoritative financial sites like Investopedia also explain technical divergence in depth, considering it a key signal of potential trend changes.


Further Reading (Highly Recommended)

MACD Indicator Tutorial|Understand Fast and Slow Lines, Histogram, Golden Cross, and Divergence in One Article!

RSI Indicator Tutorial: Understand the Relative Strength Index, From Overbought/Oversold to Divergence in 5 Practical Steps


KD High-Level Divergence (Bearish Divergence): Warning of Downside Risk

KD high-level divergence, also called “bearish divergence”, is an important signal that a trend may shift from bullish to bearish. When you notice this pattern in your holdings, it is time to be cautious, consider reducing positions, or set tighter profit-taking points


How to Identify KD High-Level Divergence? (With Illustrations)

To accurately identify KD high-level divergence, follow these three main steps:

  1. Confirm Price Trend: Observe the price candlestick chart to ensure that during an upward trend, the “later high” is higher than the “previous high” (Higher High).
  2. Confirm KD Indicator Trend: Simultaneously observe the KD indicator below; the D value (or K value) shows the “later peak” lower than the “previous peak” (Lower High).
  3. Compare Both: Overlay the price trend line and KD indicator trend line. You will see the price trend sloping upward while the KD indicator peaks slope downward. These two lines form a clear “8” shaped divergence, constituting a standard KD high-level divergence.

KD 高檔背馳(頂背馳)圖解,顯示股價創下更高的高點,而下方的 KD 指標卻形成較低的高點。

KD High-Level Divergence Illustration: Price reaches new highs while momentum declines, signaling a potential downward warning.


Practical Sell Strategies and Case Analysis When High-Level Divergence Appears

Confirming KD high-level divergence does not mean blindly selling immediately; strategies should be combined with other signals. A practical approach includes:

  • Strategy 1: Wait for Death Cross Confirmation
    After high-level divergence appears, the possibility of trend reversal increases. Wait for a “death cross” in the KD indicator near the 80 overbought area (K crosses below D) as an initial sell signal.
  • Strategy 2: Break Key Support Levels
    A more conservative approach is to draw the price’s upward trendline or identify a recent key support (e.g., previous low). When the price breaks below this trendline or support, it serves as confirmation of trend reversal, executing the sell.
  • Strategy 3: Reduce Positions in Stages
    For investors not wanting to fully exit, sell a portion of positions after divergence signals to lock in profits, and if the price later breaks key support, sell the remaining positions.

Case Analysis: Suppose a stock rises from 50 to 80, then retraces to 70 before climbing to 85, creating a new high. When the price reaches 85, the KD indicator’s D value peak is lower than the previous peak at 80. This forms KD high-level divergence. Smart investors would start to be cautious. If the price later breaks the upward trendline or the 70 support level, accompanied by a KD death cross, it is a clear exit signal.


KD Low-Level Divergence (Bullish Divergence): Capture Potential Buy Opportunities

Opposite to high-level divergence, KD low-level divergence, also called “bullish divergence”, signals a potential reversal at the end of a downtrend. It acts like a light in the dark, alerting investors to upcoming opportunities


How to Identify KD Low-Level Divergence (With Illustrations)

The steps to identify KD low-level divergence are similar to high-level divergence but in reverse:

  1. Confirm Price Trend: Observe the price candlestick chart to ensure that during a downward trend, the “later low” is lower than the “previous low” (Lower Low).
  2. Confirm KD Indicator Trend: Meanwhile, the KD indicator below (mainly D value) shows the “later trough” higher than the “previous trough” (Higher Low).
  3. Compare Both: The price lows trend line slopes downward while the KD indicator troughs line slopes upward. The two form a “V” shaped convergence, constituting a standard KD low-level divergence.

KD 低檔背馳(底背馳)圖解,顯示股價創下更低的低點,而下方的 KD 指標卻形成更高的低點。

KD Low-Level Divergence Illustration: Price reaches new lows while momentum rebounds, indicating a potential rebound opportunity


Practical Buy Strategies and Case Analysis When Low-Level Divergence Appears

Identifying KD low-level divergence is the first step; the key is how to enter the market precisely. Practical buy strategies include:

  • Strategy 1: Wait for Golden Cross
    After forming a low-level divergence, patiently wait for a “golden cross” in the KD indicator near the 20 oversold area (K crosses above D), representing a relatively aggressive left-side entry point.
  • Strategy 2: Break Downtrend Line
    A more reliable right-side strategy is to draw the price downtrend line. When the price rises with volume and breaks this line, it indicates bulls are taking control, a more dependable buying opportunity.
  • Strategy 3: Combine With Candlestick Reversal Patterns
    If a low-level divergence coincides with reversal candlestick patterns near the low, such as “morning star” or “hammer”, the reliability of the buy signal is greatly enhanced.

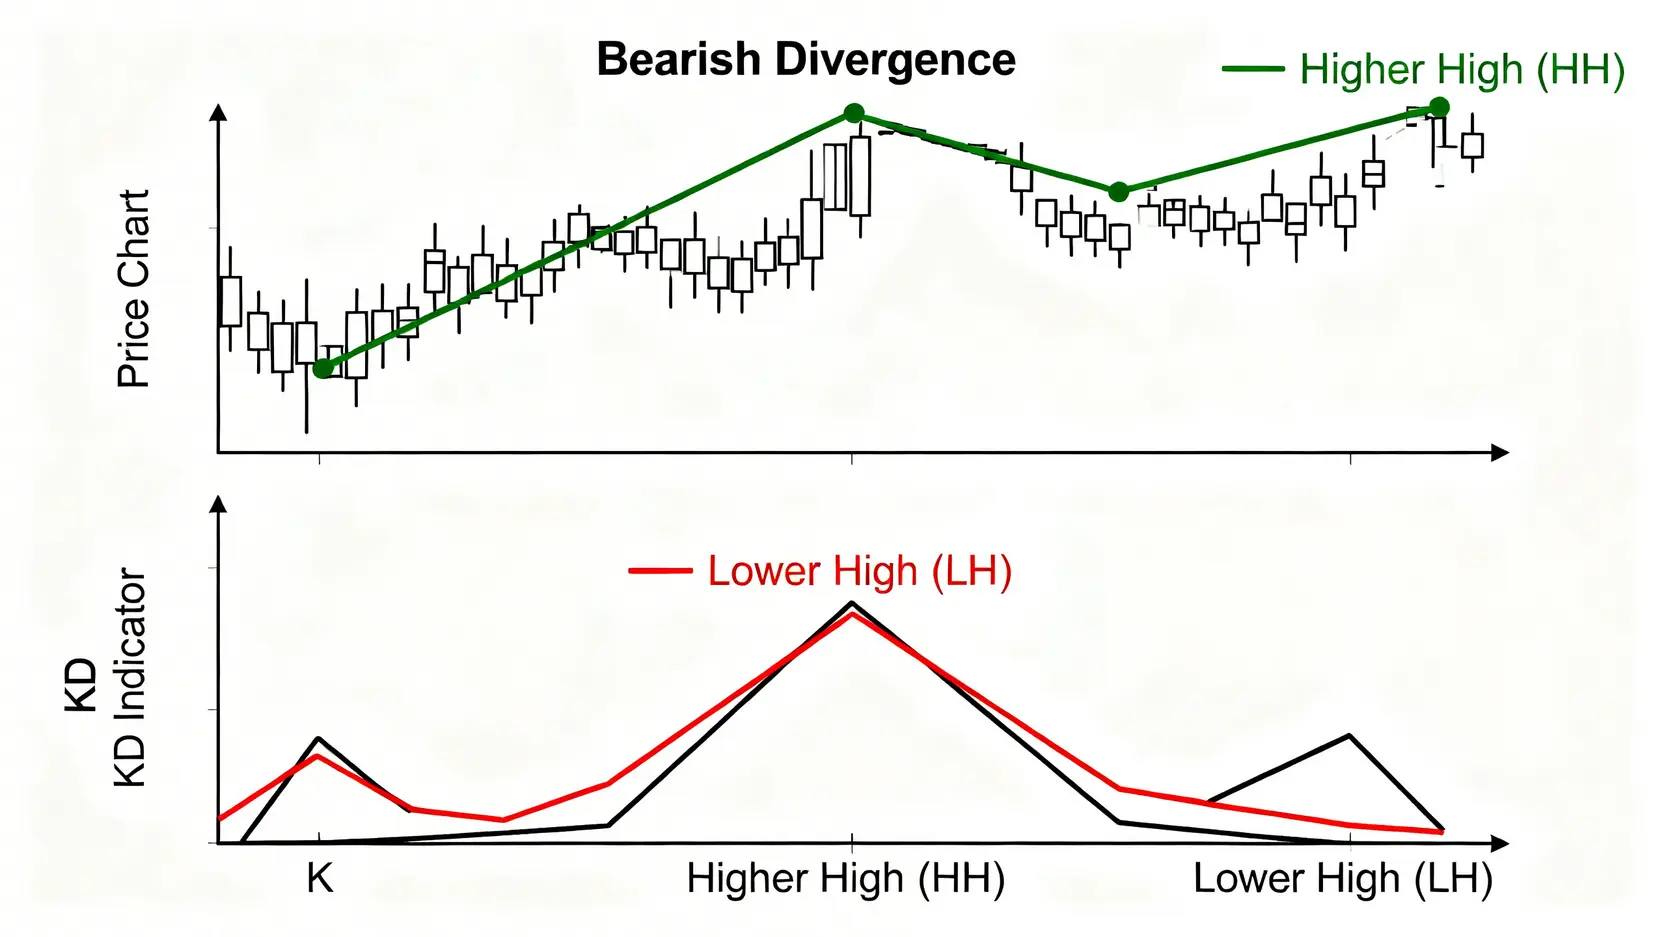
Case Analysis: Suppose an asset falls from 100 to 60, rebounds, then drops to 55, creating a new low. When the price reaches 55, the KD indicator’s D trough is noticeably higher than the previous trough at 60, forming KD low-level divergence. This indicates downward momentum has weakened. If the price later breaks the downtrend line and the KD indicator forms a golden cross at low levels, it is an excellent entry opportunity.


Further Reading (Highly Recommended)

MACD Indicator Tutorial|Understand Fast and Slow Lines, Histogram, Golden Cross, and Divergence in One Article

RSI Indicator Tutorial: Understand the Relative Strength Index, From Overbought/Oversold to Divergence in 5 Practical Steps


Three Key Techniques and Precautions for KD Divergence Analysis

After learning the basic method for identifying high and low divergence, it is also necessary to master some advanced techniques and risk-avoidance knowledge to truly improve success rates in practice. Every technical indicator has its limitations, and KD divergence is no exception.


Technique 1: Combine Trendlines and Price Patterns to Improve Accuracy

Relying solely on KD divergence signals for trading carries higher risk. A smart trader treats it as a “warning” or “confirmation” tool rather than the sole basis for decisions. Combining KD divergence analysis with trendlines, support and resistance levels, and classic price patterns (such as Head and Shoulders, W bottom, M top) can significantly filter out false signals.

  • High-Level Divergence + M Top/Head and Shoulders: When KD high-level divergence appears at the right shoulder of a potential M top or Head and Shoulders, the likelihood of trend reversal is very high.
  • Low-Level Divergence + W Bottom/Head and Shoulders: When KD low-level divergence appears at the right leg of a potential W bottom or Head and Shoulders, it is a strong signal of bottoming.


Technique 2: Pay Attention to Volume Changes to Confirm Signal Strength

Volume directly reflects market sentiment and is an important tool to validate the authenticity of price action.

  • In KD high-level divergence, if the price makes a new high while volume shrinks (price-volume divergence), it further confirms insufficient upward momentum, increasing the reliability of the divergence signal.
  • In KD low-level divergence, if the price breaks a low without increased volume (or even decreased volume), it indicates weak selling pressure. If a rebound occurs afterward and breaks the downtrend line with significant volume expansion, this provides strong evidence for bullish entry.


Pitfall Guide: How to Identify KD Indicator Passivation and False Divergence Signals?

A common criticism of the KD indicator is “passivation”. In extreme strong one-sided trends (such as primary uptrends or downtrends), the KD indicator may remain in the overbought zone (above 80) or oversold zone (below 20) for a long time, losing reference value. In such cases, “false divergence” can easily appear.

How to Handle Passivation and False Signals?

  • Identify Market Stage: First, determine whether the market is in a consolidation phase or a strong trend. KD divergence is most effective at tops and bottoms within consolidation zones. In strong trending markets, follow the trend and reduce the use of counter-trend divergence signals.
  • Multiple Divergence Confirmation: Sometimes the market exhibits “double or triple divergence,” with two or even three consecutive divergences. Usually, the second or third divergence signals are stronger than the first. Be patient and wait for more confirmed patterns.
  • Extend Observation Period: If passivation occurs on a daily chart, switch to a weekly chart. Longer-period KD divergence signals are generally more reliable and indicate higher-level trend reversals.


Frequently Asked Questions (FAQ) About KD Divergence

Q: How accurate are KD divergence signals?

A: No technical indicator is 100% accurate. KD divergence, as a leading potential reversal signal, is highly effective, especially at market tops and bottoms in consolidation phases. However, in strong one-sided trends, accuracy decreases, and passivation or false signals can occur. Therefore, its reliability depends on market conditions and whether it is combined with other analytical tools (such as trendlines, volume, or price patterns). Using a combination maximizes its reference value.

Q: What is the difference between KD divergence and MACD divergence? Which should I use?

A: Both are excellent tools for divergence analysis, but their characteristics differ. The KD indicator is an oscillator and reacts more sensitively, suitable for capturing short- to medium-term, frequent reversal points. The MACD indicator is a trend indicator, smoother in reaction, and better suited for assessing medium- to long-term trend reversals. Neither is absolutely better; experts often combine both: after KD divergence appears, wait for MACD divergence confirmation, which increases signal reliability.

Q: What KD indicator parameters should be set to identify divergence?

A: The most common parameter setting is (9, 3, 3), which is also the default in most charting software and suitable for most markets and instruments. Short-term traders may shorten parameters (e.g., 5, 3, 3) for higher sensitivity. Long-term investors may extend parameters (e.g., 14, 3, 3 or longer) for more stable signals. When judging divergence, it is recommended to first use the default (9, 3, 3), as it is viewed by the majority of market participants and has a “self-fulfilling” effect.

Q: What should I do if there is consecutive divergence “double or triple divergence”?

A: Consecutive divergence indicates strong trend strength but also suggests reversal energy is accumulating. The approach is to remain patient and not commit all funds at the first divergence. Treat consecutive divergences as a “zone” rather than a “single point” signal. Wait for clearer reversal evidence, such as breaking a key trendline or forming a significant candlestick reversal pattern, before taking action.


Conclusion

In summary, KD divergence is a powerful tool for identifying potential market trend reversals, helping investors detect risks and opportunities ahead of the market. Through this tutorial, you have learned KD high-level divergence sell warnings and KD low-level divergence buy opportunities, as well as how to combine tools like trendlines and volume to improve KD divergence analysis accuracy. Remember, no technical indicator is omnipotent; it is only an auxiliary decision-making tool. Integrate KD divergence techniques into your trading system to build a complete analytical logic, effectively enhancing your investment decision success rate in complex financial markets.

If you liked this article, please share it!

Related Articles

  • Volatility Surface Guide: Skew Trading Strategies
    Practical Applications of Volatility Surfaces: From Options Modeling to Advanced Skew Trading Strategies In options markets, implied volatility is never a flat line. Instead, it forms complex "smile" or "skew" surfaces. For advanced traders, mastering the practical applications of volatility surfaces is equivalent to possessing a lens that reveals market...
    2026 年 6 月 3 日
  • Foreign Capital Flow Model: Track Institutional Money
    Building a Foreign Capital Flow Copy Trading Model: A Stock Market Indicator for Accurately Tracking Institutional Positioning In Asia-Pacific stock markets, foreign capital inflows and outflows often determine the direction of the index. However, simply looking at daily net buy and sell data is no longer enough. Only by building...
    2026 年 6 月 3 日
  • Options Buying Strategies for Extreme Market Risks
    Options Buyer Strategies During Extreme Market Conditions: Black Swan Hedging and Cross-Market Arbitrage During Volatility Surges The most terrifying aspect of financial markets is not a gradual decline, but overnight flash crashes and cross-market capital withdrawals accompanied by volatility surges. In the highly unpredictable global macroeconomic environment of 2026, geopolitical...
    2026 年 6 月 3 日
返回顶部