In the ever-changing financial markets, every trader yearns to gain foresight and understand the deeper meanings behind price fluctuations.K-lines, also known as candlestick charts, are a time-honored and widely used technical analysis tool. They are the key to unlocking these insights, visually revealing the supply-demand relationship and the battle between bulls and bears within a specific period. This article will guide you through the mysteries of K-lines in a simple, profound way, from their basic components to preliminary applications, helping you build a solid foundation in chart analysis. Let’s explore together how to listen more clearly to the market’s voice through K-lines.
What Exactly Are K-Lines?
To master the essence of K-lines, we must first trace their origins and understand the historical context of their creation. This not only deepens our respect for this tool but also helps us grasp the market philosophy behind its design.
The Origin of K-Lines
K-line charts, also known as Japanese Candlestick Charts, date back to 18th-century Japan. At that time, a rice merchant named Honma Munehisa invented this unique charting method to predict price fluctuations in the rice market. By observing market price changes and plotting them graphically, Honma sought to identify patterns to gain an edge in rice trading.
The initial purpose of this chart design was to visually represent price movements and underlying market sentiment within a specific period. It ingeniously condenses four key data points—the open price, high price, low price, and close price—into a single “candlestick” shape, making price trends, volatility, and the balance of power between buyers and sellers clear at a glance. After centuries of market testing, candlestick charts have not only survived but have become a widely relied-upon analytical tool for traders in global stock, futures, and foreign exchange markets due to their ability to profoundly reflect market psychology and the fundamentals of supply and demand. Its origin in the trading of rice, a basic commodity, illustrates the fundamental applicability of candlestick analysis for capturing market dynamics driven by supply-demand relationships and mass psychology, not just limited to modern complex financial derivatives.
Candlestick charts were later introduced to the Western world and popularized by figures like Steve Nison, gradually becoming an indispensable core component of modern technical analysis. They maintain their strong vitality even in today’s highly technological and information-driven financial markets.
How to Interpret a Single Candlestick?
Each individual candlestick is a concise summary of price action over a specific trading period. To read a candlestick chart, one must first understand the four core price points that make up a single candlestick:
Open Price (Open): The first transaction price at the beginning of the trading period.
Close Price (Close): The last transaction price at the end of the trading period.
High Price (High): The highest transaction price that occurred during the trading period.
Low Price (Low): The lowest transaction price that occurred during the trading period.
These four price points together outline the complete price fluctuation range within a trading period and provide a preliminary indication of the market’s main trend direction during that period. Among them, the position of the close price relative to the open price is particularly crucial, as it directly determines whether the candlestick is bullish (representing a price increase) or bearish (representing a price decrease). If the close price is higher than the open price, it is a bullish candle; conversely, if the close price is lower than the open price, it is a bearish candle.
These four price points are not just isolated data; together, they tell the “story” of the power struggle between buyers and sellers during that specific period. The range between the high and low prices shows the market’s activity or volatility, representing the limits reached by both buying and selling forces. The relationship between the open and close prices, and the body it forms, reveals the periodic outcome of this struggle—which side dominated during that period.
When a trader can extend the interpretation of a single candlestick to understanding the relationships between consecutive candlesticks, they can move from static data points to dynamic market analysis, which is the starting point of candlestick pattern analysis.
What Market Power Struggles Do the “Body” and “Wicks” of a Candlestick Reveal?
A single candlestick is mainly composed of two parts: the rectangular area in the middle is called the body, and the thin lines extending above and below the body are called the wicks (or shadows).
The candlestick body is the rectangular area formed by the open price and close price of the period. The color and length of the body are important indicators for judging the market’s direction and strength. Typically, if the close price is higher than the open price, the candlestick is bullish, often displayed as green or white, representing a price increase. If the close price is lower than the open price, the candlestick is bearish, often displayed as red or black, representing a price decrease.
The length of the body directly reflects the strength of the market’s upward or downward momentum: a long body usually signifies a strong trend, with buyers or sellers holding a clear advantage; whereas a short body may indicate weakening momentum or a state of hesitation with balanced forces between bulls and bears.
The wicks represent the price’s trajectory beyond the open and close prices during the period. The thin line above the body is called the upper wick, with its tip being the period’s high price; the thin line below the body is called the lower wick, with its bottom being the period’s low price. The length of the wicks reveals the counter-pressure the price encountered after reaching extreme levels. For example, a candlestick with a long upper wick may suggest that during a price surge, selling pressure emerged at higher levels and successfully pushed the price back down, indicating selling pressure from above. Conversely, a candlestick with a long lower wick may indicate that during a price decline, buying forces actively stepped in at lower levels, providing support and causing the price to rebound.
Different combinations of bodies and wicks can form various candlestick patterns with specific preliminary meanings. For example, when the open and close prices are very close, resulting in a very short or non-existent body, possibly with upper and lower wicks, the resulting “Doji” pattern is often interpreted as a sign of market indecision and a temporary balance of power. A pattern like a “Hammer,” which appears in a downtrend with a long lower wick and a small body, may suggest a potential bottom reversal. These are merely initial descriptions of patterns; their true meaning must be judged in the context of the market.
Why Have Candlestick Charts Become an Indispensable Tool for Traders?
The primary reason for the popularity of candlestick charts is their unparalleled visual intuitiveness. Compared to other chart types, candlestick charts convey market information with extreme efficiency.
How Do Candlestick Charts Make Market Dynamics Clear at a Glance?
One of the most significant advantages of candlestick charts is their ability to cleverly integrate four key price data points—open, high, low, and close—into a single, concise, and intuitive graphical symbol. Compared to traditional line charts or bar charts, which also contain these four price points, candlesticks provide richer and more easily interpretable real-time market information due to their visual ease in distinguishing up/down movements and body size.
The color and shape of the candlestick body allow traders to quickly identify whether the market is in an uptrend, downtrend, or consolidation phase during a specific period, and to make a preliminary judgment on the relative strength of the trend. For instance, a series of long bullish candles may indicate a strong uptrend, while a series of long bearish candles may signal a downtrend. This “at-a-glance” feature significantly reduces the cognitive load for traders processing and interpreting price information in a fast-moving market. In a trading environment where every second counts, the ability to quickly assess price action and market sentiment is undoubtedly helpful for making faster responses.
Furthermore, the learning curve for candlestick charts is relatively gentle. Even novice traders can master the basic interpretation skills, understand the meaning of single candlesticks, and recognize some common patterns in a short amount of time. This ease of learning and universal applicability have made it a cornerstone of technical analysis. On a deeper level, the widespread adoption of candlestick charts and the standardization of their visual elements have formed a common “chart language” within the global trading community.
When a large number of traders are watching the same candlestick patterns and may act based on similar interpretations, this collective behavior can itself sometimes influence market prices, creating a degree of a “self-fulfilling prophecy.” For example, after a well-known bullish candlestick pattern appears, if many traders buy simultaneously, their combined force may push the price in the expected direction. This also partly explains the effectiveness of candlestick charts, which may stem from market interactions triggered by this shared perception.
What Are Some Common Candlestick Patterns?
When multiple candlesticks are arranged in a specific order and shape, they can form candlestick combinations with particular market significance, known as candlestick patterns. Many traders view these patterns as references for judging changes in market sentiment and potential trend reversals or continuations. It must be emphasized that the following descriptions are merely objective accounts of the patterns and the general market sentiment they have historically indicated, and they do not provide any trading strategies or guarantee future results.
Some common and representative candlestick patterns include:
Bullish Engulfing and Bearish Engulfing: Both patterns consist of two adjacent candlesticks. In a Bullish Engulfing pattern, the second candle is bullish, and its body completely envelops (engulfs) the body of the preceding bearish candle. This is often interpreted as a sudden surge in buying power after a period of decline or consolidation, reversing the previous downtrend and potentially signaling the beginning or continuation of an uptrend. Conversely, a Bearish Engulfing pattern features a second, bearish candle whose body completely envelops the body of the preceding bullish candle, often seen as a significant increase in selling pressure, potentially heralding the start or continuation of a downtrend. In essence, the engulfing pattern visually demonstrates a decisive shift in market control from one side to the other over two trading periods.
Doji: A Doji’s defining characteristic is its extremely close open and close prices, resulting in a very short or nearly non-existent candlestick body, almost like a horizontal line. It can have upper and/or lower wicks of varying lengths. A Doji typically represents market indecision and a balance of power between bulls and bears, where the existing trend may have paused. By itself, it does not indicate a future direction, but if it appears after a significant trend, it may suggest that the trend’s momentum is weakening and the market is searching for a new direction.
Hammer and Hanging Man: These two patterns look very similar visually, both featuring a small body at the upper end of the candlestick, a long lower wick (usually at least twice the length of the body), and a very short or non-existent upper wick. Their main difference lies in their market context and the meaning they imply. A Hammer typically appears after a downtrend. The long lower wick indicates that the price fell significantly during the session but was then pushed back up by buyers to close near the open, which is seen as a potential bottom reversal signal. The Hanging Man pattern looks identical to a Hammer but appears at the top of an uptrend. In this context, the long lower wick suggests that after hitting new highs, the market encountered selling pressure, and buyers failed to maintain the high ground, serving as a potential top reversal warning.
It must be reiterated that the appearance of any single candlestick pattern or combination merely provides a suggestion of possibility, not a definitive trading signal. Their interpretation must be closely integrated with the current overall market trend, price levels, trading volume, and signals from other technical analysis tools for a comprehensive judgment. The true value of learning these patterns is not in finding a perfect prediction tool, but rather in training traders to recognize recurring psychological battles in the market. By familiarizing themselves with these patterns, traders can gradually develop an intuition for how market participants react to specific pressures or opportunities, which is a fundamental step toward more refined and mature chart reading skills.
How Should One Initially Apply K-Line Knowledge in Actual Trading?
The shape and meaning of candlesticks are influenced by the time period they represent. Therefore, choosing the appropriate trading period to observe the candlestick chart is a crucial aspect of practical application.
What Do K-Lines Reveal in Different Time Frames?
A key feature of candlestick charts is their applicability to price data analysis across any time frame. Whether you are tracking intraday short-term fluctuations on minute charts (e.g., 1-minute, 5-minute, 15-minute charts), focusing on medium-to-short-term trends with hourly or daily charts, or grasping long-term trends with weekly or monthly charts, candlesticks can be used to present and analyze the data.
Candlestick charts on different time frames reflect trend evolution at different levels and the behavioral characteristics of different types of market participants. For instance, long-term investors or institutional traders may focus more on weekly and monthly charts to identify macroeconomic market directions and significant turning points. In contrast, day traders or short-term swing traders might concentrate on shorter time frames like hourly or minute charts to capture intraday or multi-day price fluctuation opportunities.
Generally, candlestick patterns on longer time frames are considered to have higher reliability. This is because they incorporate trading data over a longer span, gathering the actions of more market participants, thereby filtering out some short-term market noise and random fluctuations. The formation of a daily candlestick encapsulates the collective wisdom and power balance of all traders throughout an entire day; a weekly candlestick summarizes a full week of trading. Therefore, key candlestick patterns appearing on longer-term charts often better represent the market’s mainstream opinion and the solidity of the trend. Choosing which time frame to analyze fundamentally changes the “resolution” of market observation. Shorter time frame charts display more market “noise” and rapid price swings, while longer time frames smooth out these short-term fluctuations to reveal more significant and lasting trends.
Many experienced traders combine multiple time frames for analysis, attempting to gain a more comprehensive and three-dimensional perspective of the market. For example, they might first determine the primary trend direction on a long-term chart and then look for specific candlestick entry signals that align with the major trend on a shorter-term chart. However, beginners should be cautious not to overcomplicate their analysis and can initially focus on one or two main time frames.
Market price fluctuations often exhibit similar patterns across different time scales, a concept known as the “fractal nature” of markets. This means that similar candlestick patterns can appear on all time frames, but their impact on holding periods, risk management, and profit targets can vary dramatically. For instance, a day trader and a swing trader might see the exact same “Hammer” pattern on a chart. But if the former sees it on a 5-minute chart and the latter on a daily chart, their resulting trading decisions, stop-loss/take-profit levels, and expected holding times will be vastly different. Therefore, the interpretation of a candlestick signal must be placed within the context of the chosen time frame and aligned with the trader’s own trading style, risk tolerance, and objectives.
The Potential Limitations of Candlestick Analysis: How to Objectively View Its Reference Value?
While candlestick charts provide traders with a powerful perspective for gaining insights into market dynamics, it is crucial to recognize that they are not a flawless crystal ball for predictions. Every technical analysis tool has its inherent limitations, and candlestick analysis is no exception. Objectively viewing its reference value helps to more rationally integrate it into the trading decision-making process.
First, candlestick patterns are a record and reflection of historical price behavior, and past performance does not guarantee future results. The market environment is dynamic; patterns that were effective in the past may fail in the future or perform differently under varying market conditions.
Second, the interpretation of candlestick patterns can be subjective to some extent. Although there are widely accepted definitions for patterns, in actual charts, the perfection of a pattern, its specific location, and the surrounding market context can all influence how different traders interpret its meaning. Experience and personal bias can lead to different readings of the same set of candlesticks.
Furthermore, in markets with low liquidity or where prices are easily affected by non-market factors (such as breaking news, policy interventions, or even market manipulation), the reliability of candlestick patterns can be significantly reduced. In such cases, price fluctuations may reflect special events rather than normal market supply and demand or psychological battles, thus diminishing the effectiveness of pattern-based candlestick analysis.
Additionally, candlestick analysis itself primarily focuses on price action and does not directly incorporate all factors that affect market prices, especially fundamental factors such as the release of macroeconomic data, corporate earnings reports, industry trends, and geopolitical events. These fundamental factors are often the underlying drivers of long-term market trends, while candlestick analysis is more about capturing the short- or medium-term manifestation of these factors in prices.
Therefore, the most prudent approach is to treat candlestick analysis as one component of a comprehensive decision-making process, rather than the sole basis for it. It is advisable to combine candlestick patterns with other technical indicators (such as moving averages, Relative Strength Index (RSI), Bollinger Bands, etc.) to seek multi-angled confirmation, thereby improving the comprehensiveness and reliability of the analysis.
These limitations highlight a key point: candlesticks are tools for probabilistic thinking, not deterministic prediction. They provide clues intended to improve the assessment of the likelihood of certain market outcomes, but they never offer 100% certainty. For traders, developing this probability-based mindset is crucial.
Conclusion
As a classic and powerful technical analysis tool, candlestick charts offer traders a window into market psychology and price momentum. From understanding the four basic price points of a single candlestick to recognizing the meaning of its body and wicks, and then to a preliminary acquaintance with common candlestick patterns, each step is about accumulating the vocabulary to interpret the market’s “secret language.”
However, as discussed in this article, candlestick analysis is not a panacea. The interpretation of its patterns requires objectivity, and the confirmation of its signals demands caution. Any candlestick pattern should be placed in a broader market context and combined with other analytical tools and risk management principles to realize its proper reference value. Learning about candlesticks is a continuous process of refinement. Readers are encouraged to continue exploring more complex candlestick combination theories, multi-time frame analysis techniques, and how to integrate candlestick analysis into a personalized trading system after mastering the foundational knowledge presented here.
As you begin to practice candlestick analysis and embark on or continue your trading journey, Cashback Island is pleased to be your reliable partner in saving on trading costs, and accessing professional information and practical tools, witnessing your growth and progress in the financial markets together.
Cashback Island continuously updates its trading educational resources. Traders can visit the “Cashback Island Learning Hub” section to master more forex knowledge and investment skills.
Frequently Asked Questions
Q1. What are the basic components of a K-line?
Each K-line (candlestick) consists of an open price, close price, high price, and low price. The body reflects the difference between the open and close prices, while the wicks (shadows) show the extreme price range during the trading period.
Q2. What market signal does a Doji pattern represent?
A Doji often appears at trend turning points. Its upper and lower wicks indicate an intense struggle between bulls and bears, potentially signaling consolidation or a reversal. It needs to be interpreted in the context of preceding candlesticks and the overall trend.
“Trading in financial derivatives carries a high level of risk and may result in the loss of funds. The content of this article is for informational purposes only and does not constitute any investment advice. Please make decisions carefully based on your personal financial situation. Cashback Island assumes no responsibility for any trading derivatives.”
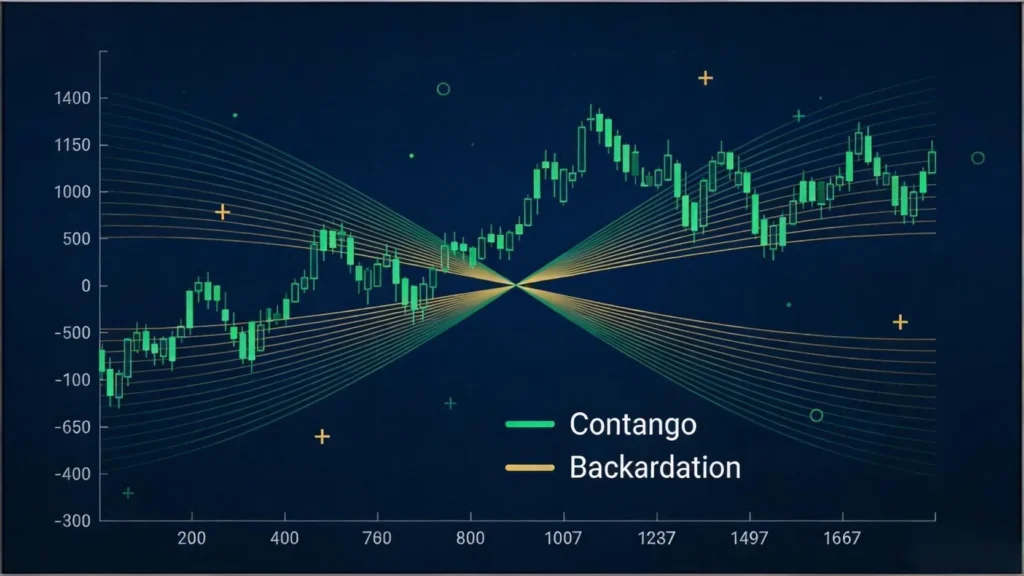
What Experts Are Watching! A Guide to Using Contango and Backwardation to Judge Taiwan Stock Market Trends and Futures-Spot Spread Arbitrage Contango and backwardation are not only tools used to execute arbitrage trades, but also important leading indicators that reflect the sentiment of major market players and institutional investors. When...
How to Trade Gold During Volatility: 4081 to 4100 Guide As gold prices surge to a historic high of USD 4,000, market sentiment has become as volatile as a roller coaster. One moment, gold has just broken strongly above the 4081 level, and the next, it encounters short selling pressure...
Practical Guide After a Gold Plunge: 5 Gold Investment Strategies and Safe-Haven Asset Allocation Fully Revealed Facing the uncertainty of the global economy in 2026, as well as a market environment where gold prices frequently plunge and remain under pressure, blindly following the crowd often only leads to unnecessary losses....