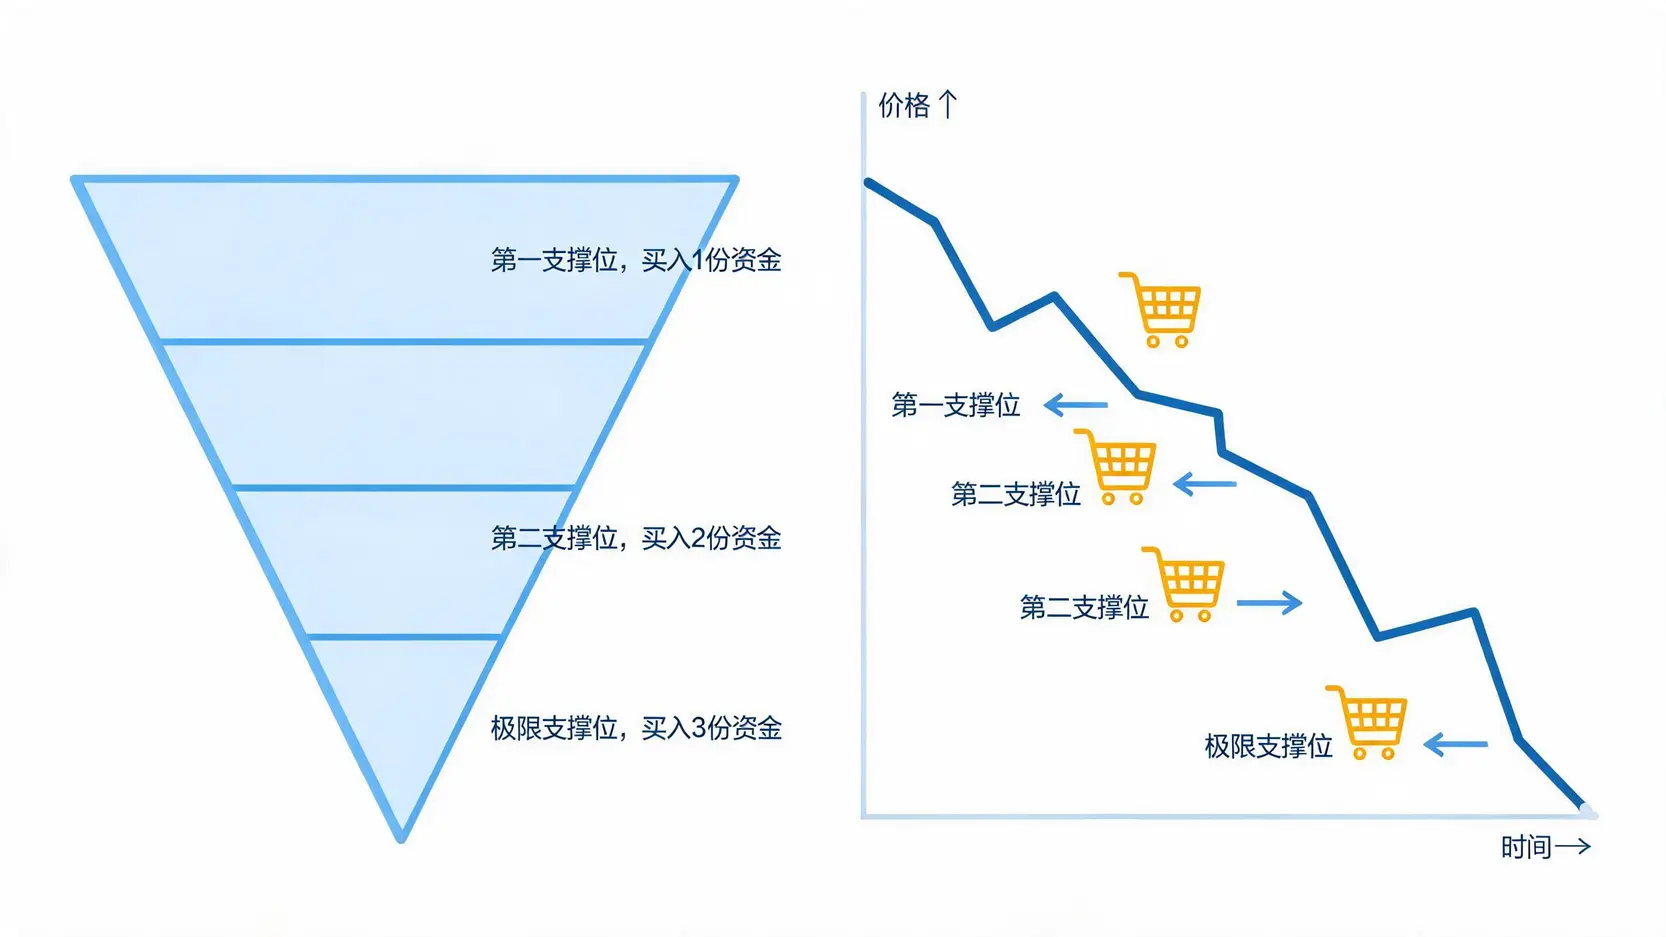
The core of this strategy is “buying more as prices fall”, provided that you have confidence in gold’s long-term trend.
Strategy Two: Set Key Support Levels and Strictly Execute Stop-Losses
For investors with extremely high risk-control requirements, or those conducting short- to medium-term trades, setting stop-losses is essential. Even if you believe this is only a pullback, uncertainty always exists in the market.
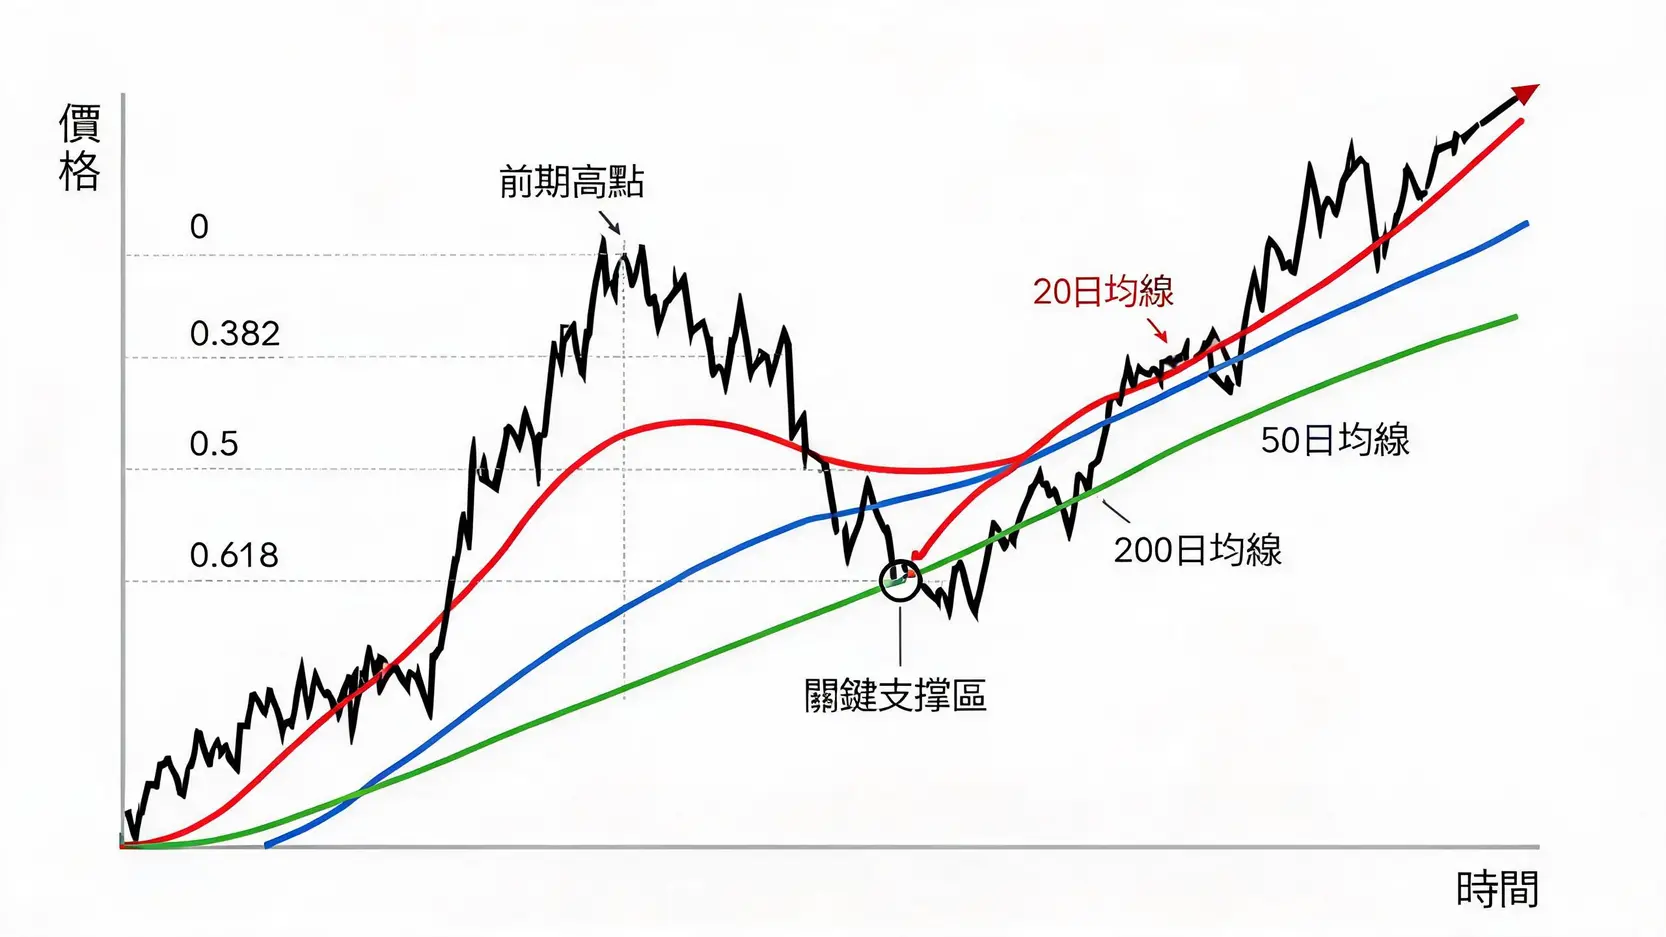
- Set a stop-loss point: Set a clear stop-loss price below the key support level where you buy. For example, if you buy near the 200-day moving average, you can set the stop-loss at 3%-5% below the 200-day moving average.
- Avoid emotional decisions: Once the price touches the stop-loss point, you must strictly execute it. Do not hold on to the wishful thinking that “it will rise back immediately”. This can help you avoid huge losses during a real trend reversal.
- Error-tolerance mechanism: Exiting with a stop-loss does not mean you judged the trend incorrectly. It is only a mechanism to protect your principal. If the price later regains firm support, you can enter the market again at any time.
Remember, the first rule for staying in the market is “survive”, and a stop-loss is your “lifeline”.
Strategy Three: Reassess Asset Allocation and Confirm Gold’s Safe-Haven Role
A market pullback is also an excellent time to review your investment portfolio. You should ask yourself: what was my original purpose in allocating gold?
- Safe-haven function: If your purpose is to hedge stock market risk or currency depreciation, is gold still playing this role during the pullback? For example, when the stock market falls sharply, does the gold price show relatively stronger downside resistance?
- Allocation ratio: Is gold’s current proportion of your total assets appropriate? If the proportion is too low, a pullback may be a good opportunity to increase allocation. If the proportion is already too high, you can consider delaying additional buying, or even reducing part of your position when prices rebound, to maintain portfolio balance. You can refer to asset allocation teaching to build a more stable investment portfolio.
Rational investors use market volatility to optimize their asset structure, instead of passively being led by prices.
Major Gold Pullback Events in History and Subsequent Trends
History does not simply repeat itself, but it is always strikingly similar. Reviewing several major gold pullback events in the past can provide us with valuable experience and confidence.
Case Analysis: Gold’s Trend During the 2008 Global Financial Crisis
When the global financial crisis broke out in 2008, gold, which was regarded as the ultimate safe-haven asset, also experienced a sharp pullback in the early stage. From its high of around USD 1,032 in March 2008, it once pulled back nearly 30% to a low of around USD 700 in October. At that time, the market was extremely panicked, and investors were forced to sell gold for liquidity in order to offset losses in other assets such as stocks. However, after the Federal Reserve launched large-scale monetary easing (QE), gold’s monetary attributes and inflation-hedging value became prominent. It then soared all the way from its low and reached a historical high of USD 1,920 in 2011.
Case Analysis: The Pullback and Rebound in the Early Stage of the COVID-19 Outbreak in 2020
A similar script played out again in March 2020. The COVID-19 pandemic triggered panic across global markets, and gold also fell rapidly from around USD 1,700 to near USD 1,450 due to a liquidity crisis, a decline of more than 14%. Similarly, after global central banks introduced unlimited easing policies, gold prices quickly rebounded and broke above USD 2,075 in August of the same year, setting a new historical high.
Historical Lessons: How Long-Term Holders Should View Short-Term Price Volatility
These two cases tell us:
- In the early stage of extreme systemic risk, gold may be sold off due to liquidity needs, resulting in a simultaneous decline with risk assets.
- After a crisis truly develops, rescue measures by governments and central banks (usually money printing) instead become the strongest fuel driving long-term gold price increases.
- For long-term investors, these deep pullbacks caused by panic, in hindsight, were all extremely rare “golden pits”.
Therefore, when facing a pullback, having a long-term perspective and firm holding confidence is crucial.
Frequently Asked Questions (FAQ)
Q: How long does a gold pullback usually last?
A: There is no fixed answer, as the duration depends on the cause that triggered the pullback. A pullback caused by short-term profit-taking may only last a few days to one or two weeks. If it is due to a strong rebound in the US dollar or a shift in market expectations for monetary policy, the pullback may extend to several weeks or even one or two months. The key is to observe whether prices can find effective support at key long-term support levels (such as the quarterly line or annual line).
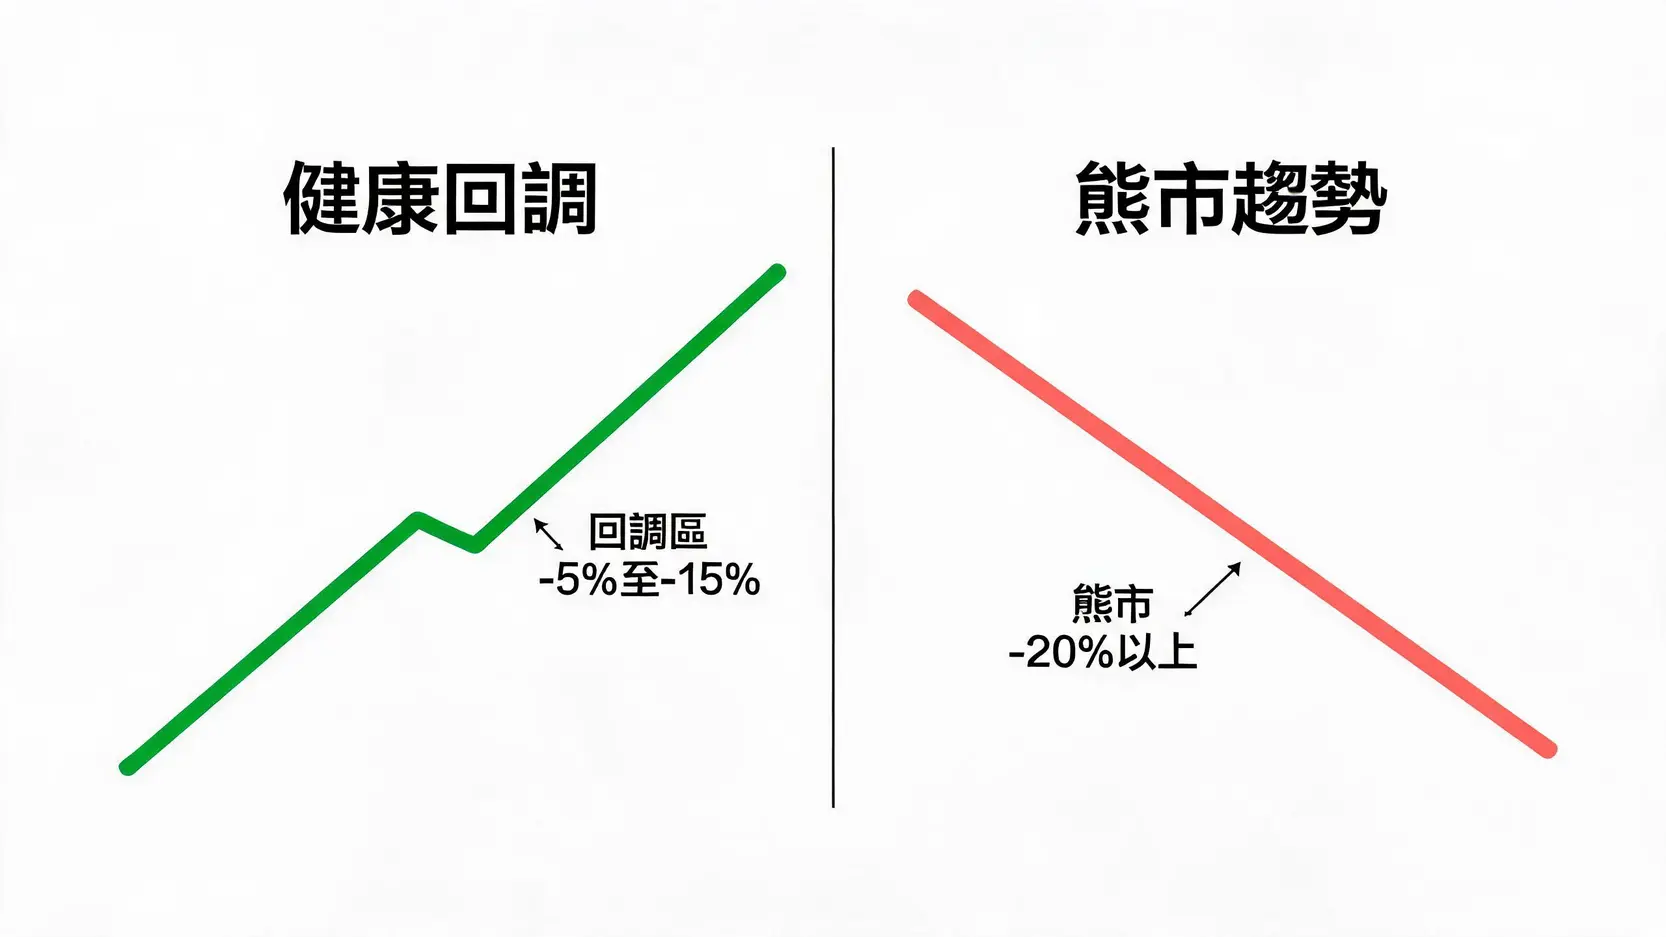
Q: What should I do if gold pulls back by more than 20%?
A: From a technical definition perspective, a decline of more than 20% enters the “bear market” category. At this point, you should be more cautious. You need to: 1. Strictly review whether your original stop-loss setting has been triggered. 2. Reassess in depth whether gold’s long-term fundamentals have undergone fundamental deterioration. 3. If a trend reversal is confirmed, you should consider significantly reducing your position or exiting the market to wait and observe, rather than blindly “buying more as prices fall”. It is not too late to wait for clear bottom signals to appear before repositioning.
Q: Besides gold spot (XAUUSD), do these strategies also apply when physical gold pulls back?
A: Yes, the basic principles are the same, but the operational details are different. Physical gold (such as gold bars and gold coins) has wider bid-ask spreads and lower liquidity, making it unsuitable for frequent trading. Therefore, for physical gold investors, the strategies of “buying in batches” and “long-term holding” are more applicable. When gold prices experience a significant pullback (such as a decline of more than 10%), you can purchase part of your physical gold as a long-term asset allocation, instead of trying to catch short-term support rebounds.
Q: When gold prices pull back, what reference value does the US dollar trend have?
A: The US Dollar Index (DXY) is an important reference indicator for observing gold price pullbacks. Since gold is priced in US dollars, the two usually have an inverse relationship. If a gold price pullback is accompanied by a strong rise in the US Dollar Index, you need to closely watch whether the US dollar’s upward momentum can continue. Once the US Dollar Index is blocked at a key resistance level and pulls back, it is often a signal that gold prices have ended their pullback and restarted their upward trend.
Conclusion
In summary, a gold pullback is a normal market occurrence. It is both a test of investor psychology and a test of investment strategy. When facing falling gold prices, the key is to remain rational and avoid panic. Learning to use tools such as moving averages and Fibonacci retracement to judge the potential support of a pullback, combined with analysis of long-term fundamentals, can help you see through the short-term market fog more clearly. Whether you choose to buy in batches, set strict stop-losses, or reassess asset allocation, the core lies in establishing a response script that suits you and executing it strictly. Please remember that any investment decision should be based on your own risk tolerance. Only by viewing every market fluctuation as an opportunity to learn and optimize your strategy can you go further and more steadily on the path of gold investment.