US Federal Reserve Interest Rate Decision Cheat Sheet: Latest Schedule, Impact of Rate Hikes and Cuts, and Dot Plot Interpretation
Every Federal Open Market Committee (FOMC) meeting captures global market attention, as even minor changes in interest rates can trigger significant volatility across financial markets. How exactly do Federal Reserve rate hikes and cuts affect stock investing, real estate mortgages, and personal savings? And how should we properly interpret the mysterious “Federal Reserve dot plot” to gain insight into future interest rate trends? This article provides a comprehensive US Federal Reserve interest rate decision cheat sheet, from basic concepts to in-depth analysis, helping you clearly understand policy direction and better prepare your investment strategy.
Core Explanation: What Is the US Federal Reserve Interest Rate Decision (FOMC Meeting)?
The Federal Open Market Committee (FOMC) is the core decision-making body of the US Federal Reserve System (The Fed). The “interest rate decision meeting” refers to the eight scheduled meetings held each year by the FOMC to assess current economic conditions and decide whether to adjust the target range of the federal funds rate. This rate is the interest rate at which banks in the US lend to each other overnight and serves as the foundation of the entire financial system. Its changes directly influence global capital flows and financing costs.
Why Is the Federal Reserve Interest Rate Decision a Global Focus?
The Federal Reserve’s interest rate decisions attract global attention for several key reasons:
- Dominance of the US dollar: The US dollar is the world’s primary reserve currency and medium of exchange. Commodities (such as oil and gold) are largely priced in US dollars. The Fed’s decisions directly affect the strength of the dollar, thereby impacting exchange rates and trade costs worldwide.
- Global capital flow indicator: When the US raises interest rates, US dollar assets become more attractive, drawing international capital into the US and potentially causing outflows from emerging markets. Conversely, rate cuts may push capital toward higher-yielding markets elsewhere.
- Influence on global central banks: Because many economies are closely linked to the US, central banks in other countries often take cues from Fed policy when shaping their own monetary policies to maintain financial stability.
2026 Latest Federal Reserve Interest Rate Meeting Schedule
Understanding the meeting calendar is the first step in investment positioning. Below is the scheduled 2026 FOMC meeting timeline. After each meeting, a policy statement is released, while the quarterly meetings held (in March, June, September, and December) also include economic projections and the “dot plot”, providing forward-looking guidance.
| Meeting Month |
Meeting Date |
Whether Economic Projections and Dot Plot Are Released
|
| January |
January 28–29 |
No |
| March |
March 17–18 |
Yes |
| April |
April 28–29 |
No |
| June |
June 9–10 |
Yes |
| July |
July 28–29 |
No |
| September |
September 15–16 |
Yes |
| November |
November 4–5 |
No |
| December |
December 15–16 |
Yes |
Note: The above dates are estimated schedules. Please refer to the official Federal Reserve official website for the actual confirmed dates.
Rate Hikes vs Rate Cuts: The Most Direct Impact on You
Changes in interest rates act like a double-edged sword, with very different impacts on the economy and personal finances. Understanding the mechanism helps us position ourselves to avoid risks and capture opportunities. Investors who want to go deeper can refer to our article: 【Stock Market Beginner Guide】Understanding “Bull vs Bear Market” and “Long vs Short Positions” in 5 Minutes.
When the Federal Reserve Raises Interest Rates: 4 Major Impacts on Stocks, Real Estate, Savings, and Loans
A rate hike means higher borrowing costs. This is typically used to cool an overheated economy and control inflation, but it triggers the following chain reactions:
- Stock market pressure increases: Corporate borrowing costs rise, reducing profitability, especially for growth stocks such as technology companies. At the same time, higher yields from low-risk instruments such as fixed deposits may attract capital out of the stock market, putting downward pressure on indices.
- Real estate cooling: Mortgage rates rise, increasing repayment burdens and reducing affordability, which may slow property transactions and even lead to price corrections.
- Good news for savers: Banks tend to increase deposit rates, especially USD fixed deposits, boosting interest income and offering higher “risk-free” returns.
- Higher loan burden: Credit card debt, personal loans, and business loans all become more expensive, increasing monthly repayment amounts.
When the Federal Reserve Cuts Interest Rates: How It Stimulates the Economy? Which Assets Benefit?
Rate cuts are the opposite policy tool, aimed at lowering borrowing costs to stimulate consumption and investment. They are typically used when the economy faces recession risks:
- Stock market boost: Lower corporate financing costs help improve profitability and support business expansion. Increased market liquidity also makes investors more willing to allocate capital into higher-risk equities in search of higher returns.
- Real estate recovery potential: Lower mortgage rates reduce repayment pressure for homebuyers, which may stimulate housing demand.
- Lower savings interest: Bank deposit rates decline accordingly, which is unfavorable for retirees or conservative investors who rely on interest income.
- Lower borrowing costs: Encourages both businesses and individuals to borrow for investment or consumption, injecting liquidity into the economy.
Hong Kong Market Must-Read: Differences Under the Linked Exchange Rate System
Hong Kong operates under a Linked Exchange Rate System, pegging the Hong Kong dollar to the US dollar. This means Hong Kong’s monetary policy must largely follow US policy. When the US raises interest rates, the Hong Kong Monetary Authority (HKMA) generally raises its base rate to prevent capital outflows caused by widening interest rate differentials. This transmission flows directly into the Hong Kong banking system, where both the Prime Rate (P mortgage) and the Hong Kong Interbank Offered Rate (HIBOR, H mortgage) may rise accordingly, with a particularly direct and rapid impact on Hong Kong’s property and stock markets.
Further Reading (Strongly Recommended)
[Stock Market Beginner Guide] Understand the Differences Between “Bull and Bear” and “Long and Short” in One Article! Learn How to Go Long and Short in 5 Minutes
2025 Forex Fundamental Analysis Ultimate Guide: From Economic Data to Central Bank Decisions in Practice
Forecasting Future Interest Rates: A Guide to the Federal Reserve Dot Plot
To forecast the Federal Reserve’s future direction, the “dot plot” is one of the most important tools used by the market.
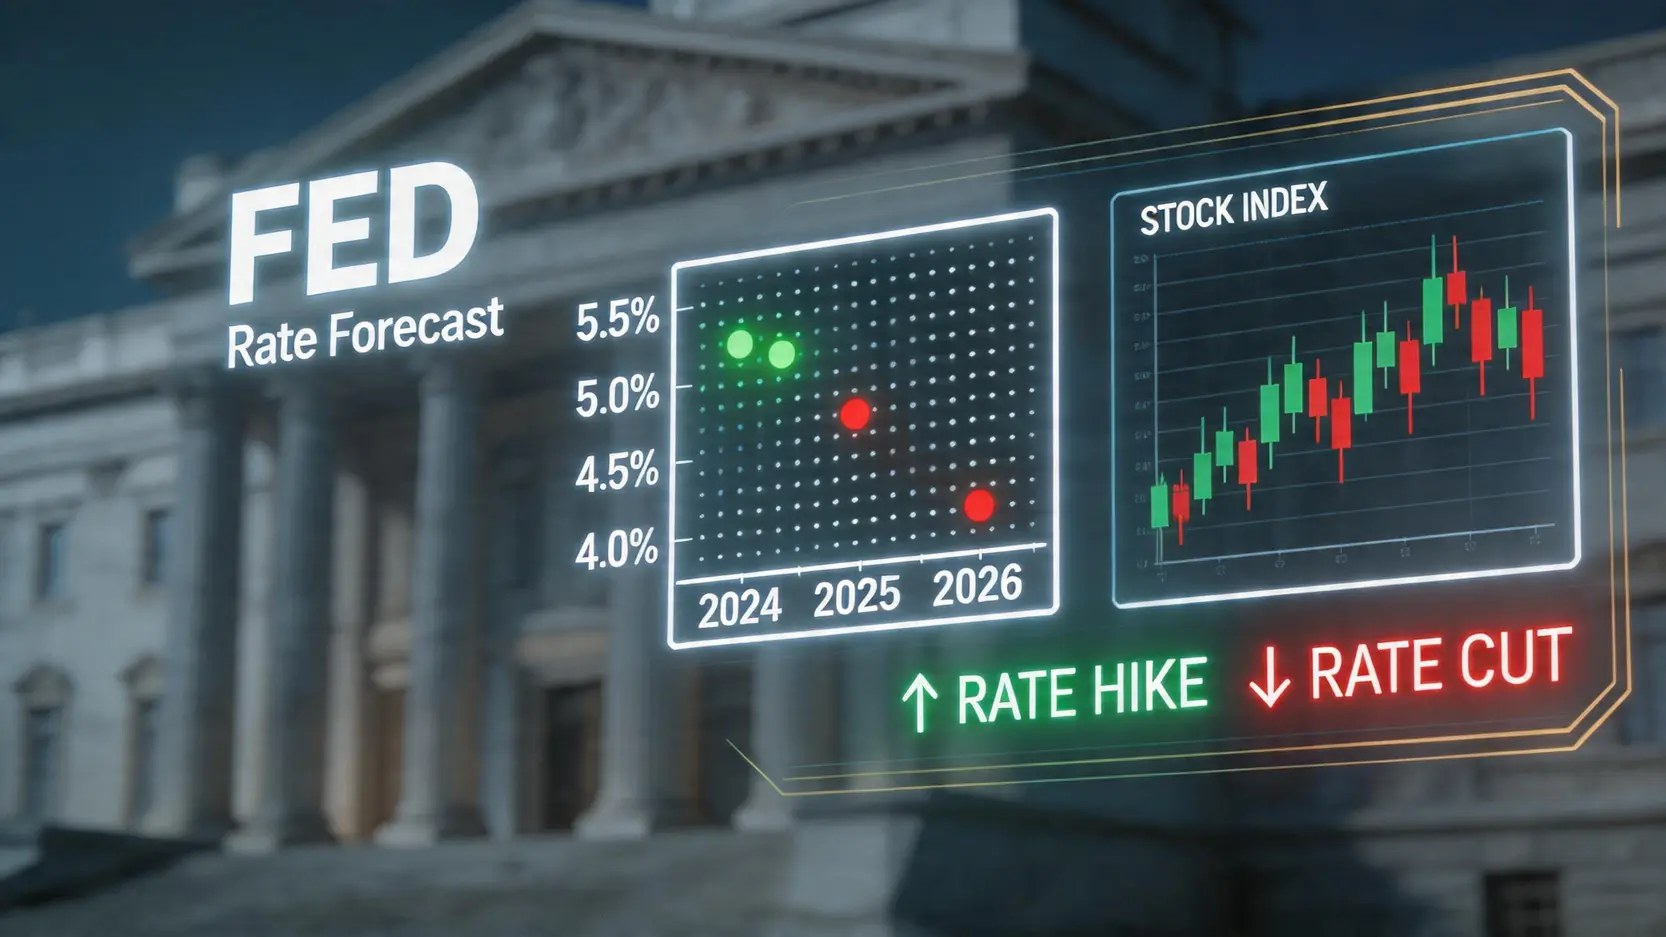
What Is the Dot Plot? Understanding Officials’ Stance at a Glance
The dot plot is not a complex chart. It is an anonymous chart where each dot represents one FOMC official (including governors and regional Federal Reserve Bank presidents) and their projected federal funds rate at the end of each year (including the current year). This chart is published every March, June, September, and December alongside economic projections, visually presenting policymakers’ collective expectations for the future interest rate path.
Three Steps to Understand Hawkish and Dovish Signals in the Dot Plot
Interpreting the dot plot is straightforward and can be done in three steps:
- Identify the median: Observe the distribution of dots for a specific year and locate the middle value. This median is often viewed by markets as the most likely FOMC projection for that year’s interest rate level.
- Compare trend changes: Compare the latest median with the version from three months earlier. If the median moves higher, it signals a more “hawkish” stance (tightening monetary policy, i.e., rate hikes). If it moves lower, it signals a “dovish” stance (looser policy, i.e., rate cuts).
- Observe dispersion: If the dots are tightly clustered, it indicates strong consensus among officials. If they are widely dispersed, it suggests significant internal disagreement and higher policy uncertainty.
Limitations of the Dot Plot: Why It Is a Forecast, Not a Commitment?
Although the dot plot is highly informative, investors must understand its limitations:
- Not an official commitment: It reflects individual officials’ expectations at a specific point “at the time”, not an official policy promise from the committee.
- Changes with economic data: Forecasts are continuously updated based on new inflation and employment data, meaning views may shift significantly within a few months.
- Anonymous and untraceable: It is impossible to know which dot belongs to which official, or the reasoning behind each projection.
Therefore, the dot plot should be regarded as an important sentiment indicator and trend reference rather than a precise roadmap. When making investment decisions, it is still necessary to combine comprehensive fundamental analysis to more fully evaluate the market.
Conclusion
In summary, closely monitoring US Federal Reserve interest rate decisions and learning to analyze the potential impacts of rate hikes and cuts, as well as interpreting the Federal Reserve dot plot, are essential skills for every savvy investor in today’s rapidly changing market. Interest rate movements profoundly affect all asset classes, from stocks and bonds to real estate. Through the systematic analysis provided in this article, we hope to help you gain a clearer understanding of macroeconomic conditions and make more informed financial decisions. Start positioning your investment strategy now to better navigate future interest rate changes.
FAQ: Common Questions About US Federal Reserve Interest Rate Decisions
Q: How many rate cuts is the Fed expected to make this year?
A: Forecasting the number of rate cuts mainly depends on the latest Federal Reserve dot plot median and post-meeting statements from Chair Jerome Powell. For example, if the dot plot median shows that the year-end rate is 0.75 percentage points lower than the current level, the market will typically interpret this as room for three 0.25 percentage point cuts within the year. However, this is only a forecast, and the actual number depends on subsequent inflation and employment data.
Q: When the US raises interest rates, will Hong Kong banks definitely follow?
A: Not necessarily “immediately” or in “full”. Although under the Linked Exchange Rate System the HKMA adjusts the base rate, whether commercial banks adjust their Prime Rate (P-rate) also depends on their own funding costs, Hong Kong dollar liquidity, market competition, and macroeconomic conditions. At times, even after multiple US rate hikes, Hong Kong banks may delay passing them on if liquidity remains abundant.
Q: How accurate is the Federal Reserve dot plot historically?
A: The historical accuracy of the dot plot is only moderate. It is more effective at forecasting short-term (within one year) interest rate direction, but its long-term projections often deviate significantly due to the large number of economic variables involved. Unexpected events such as the 2020 COVID-19 pandemic or geopolitical conflicts can quickly render forecasts obsolete. Therefore, it is better used to observe shifts in policymakers’ sentiment rather than as a precise crystal ball.
Q: What do “hawkish” and “dovish” mean?
A: These are terms used to describe the monetary policy stance of central bank officials. Hawkish refers to a tightening bias, such as supporting rate hikes to combat inflation, reflecting a more aggressive stance. Dovish refers to an easing bias, such as supporting rate cuts to stimulate employment and economic growth, reflecting a more accommodative stance.