EUR/USD Trading Guide: 5 Beginner Strategy Tips

Updated: 2026/07/02  |  CashbackIsland

eur-usd-trading-strategy

Euro Trading Strategy | 5 Essential EUR/USD Practical Tips and Timing Analysis for Beginners

As the most traded currency pair in the global forex market, euro/US dollar (EUR/USD) is undoubtedly the first choice for many traders. But do you really know how to navigate this vast market steadily and profitably? Many beginners often enter the market based on feeling, not only frequently missing the best entry timing, but also overlooking the key economic data behind exchange rate movements, ultimately leading to unnecessary losses. A good euro trading strategy must combine an understanding of macroeconomics, precise timing judgment, and rigorous risk control. This article will systematically break down the core trading logic of EUR/USD for you, from the factors affecting the euro exchange rate to different styles of EUR/USD trading strategies, helping you build a solid and effective personal trading framework. 


Master the Pulse of EUR/USD: 3 Key Factors Affecting the Euro Exchange Rate

To gain an edge in euro trading, you must understand the fundamental reasons driving its price fluctuations. The EUR/USD exchange rate is like a tug-of-war, with the economic strength of the eurozone and the US at opposite ends of the rope. The following three major factors are the key focuses that all traders must closely monitor.


Interest Rate Policy Differences Between the European Central Bank (ECB) and the US Federal Reserve (Fed)

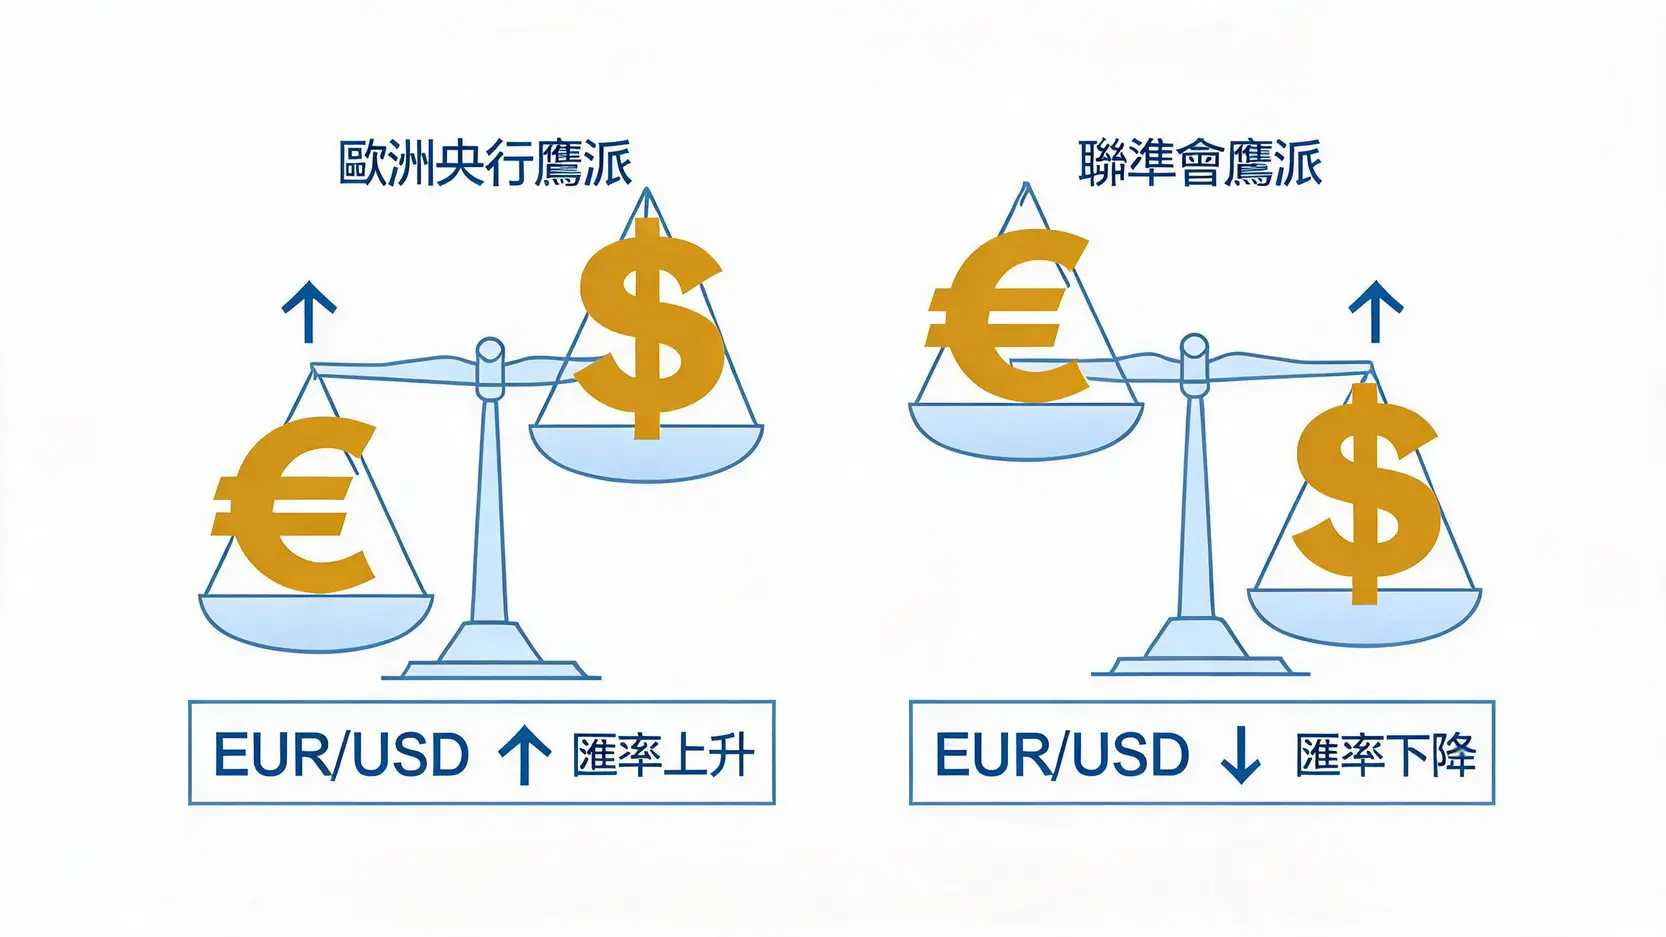
The monetary policies of the two major central banks are the core engine affecting the movement of EUR/USD. When the Federal Reserve (Fed) adopts tightening policies (such as raising interest rates) to fight inflation, the attractiveness of the US dollar increases because holding US dollars can generate higher interest, which usually causes EUR/USD to fall. Conversely, if the European Central Bank (ECB) takes a more “hawkish” stance (meaning a tendency to raise rates) while the Fed releases “dovish” signals (meaning a tendency to cut rates), the euro will strengthen relative to the US dollar, pushing EUR/USD higher.

一個天平圖解,展示歐洲央行與聯準會的鷹派政策如何分別影響歐元與美元的強弱,進而導致EUR/USD匯率的漲跌。

Diagram Showing the Impact of Central Bank Policy on the EUR/USD Exchange Rate

Traders should focus on:

  • Interest rate decision meetings: These are key market events. Any adjustment to interest rates or hints about the future path can trigger intense volatility.
  • Central bank officials’ speeches: Public remarks by central bank governors (such as ECB President Lagarde and Fed Chair Powell) often imply the direction of future policy.
  • Release of meeting minutes: The content of the minutes reveals the detailed discussions behind decisions, helping the market gain a deeper understanding of the central bank’s thinking.

Gaining an in-depth understanding of the central bank decision-making process is the cornerstone of formulating a macro euro trading strategy. You can refer to the European Central Bank’s official website to obtain the most direct monetary policy information. 

Key Economic Indicators in the Eurozone and the US

Economic data is the thermometer for measuring economic health and directly affects market confidence in a country’s currency. For EUR/USD traders, it is necessary to pay attention to data from both sides of the Atlantic.

Key Economic Indicators Meaning

Potential Impact on EUR/USD

Consumer Price Index (CPI) A core indicator for measuring inflation. If eurozone CPI is higher than expected, it may prompt the ECB to adopt tightening policies, which is positive for the euro; conversely, if US CPI is higher than expected, it is positive for the US dollar.
Gross Domestic Product (GDP) Measures the total amount of overall economic activity in a country. Strong GDP growth represents a healthy economy and is favorable for that country’s currency.
Purchasing Managers’ Index (PMI) A leading indicator reflecting the health of the manufacturing and services sectors. Above 50 indicates industry expansion, which is positive for the currency; below 50 indicates contraction, which is negative for the currency.
Unemployment Rate / Nonfarm Payrolls (NFP) Key data for measuring labor market conditions. US Nonfarm Payrolls (NFP) are especially important, as a strong labor market usually boosts the US dollar.


How Geopolitics and Market Sentiment Affect the Euro’s Movement

In addition to cold data, market “sentiment” is also a force that cannot be ignored. Geopolitical events, such as elections in Europe, energy crises, or international conflicts, all increase uncertainty and thereby affect the euro. Usually, when market safe-haven sentiment rises, demand for the US dollar, as the world’s primary safe-haven currency, increases, causing EUR/USD to come under pressure and fall. Conversely, when the global economic outlook is optimistic and investors are willing to take on more risk, non-USD currencies such as the euro may benefit.


Which Session Is Best for Trading the Euro? The Golden Overlap Between the London and New York Sessions

Choosing the right trading session can make your trading much more effective. EUR/USD activity is not evenly distributed throughout the 24-hour day, but is concentrated in specific trading time zones. Understanding the characteristics of these time zones is crucial.


Characteristics and Opportunities of the European Trading Session (London Session)

As the world’s largest forex trading center, London’s market opening (around 3 p.m. GMT+8), marks the official start of the trading day. This session is characterized by huge trading volume and excellent liquidity. All important economic data related to the eurozone and the UK are released during this session, providing traders with abundant trading opportunities.


Volatility Analysis of the US Trading Session (New York Session)

When New York opens (around 8 p.m. GMT+8), the market enters another peak. US economic data, such as the Nonfarm Payrolls report and CPI, can trigger intense market volatility during this session. The dominant position of the US dollar means that any movement during this session will be directly reflected in the trend of EUR/USD.


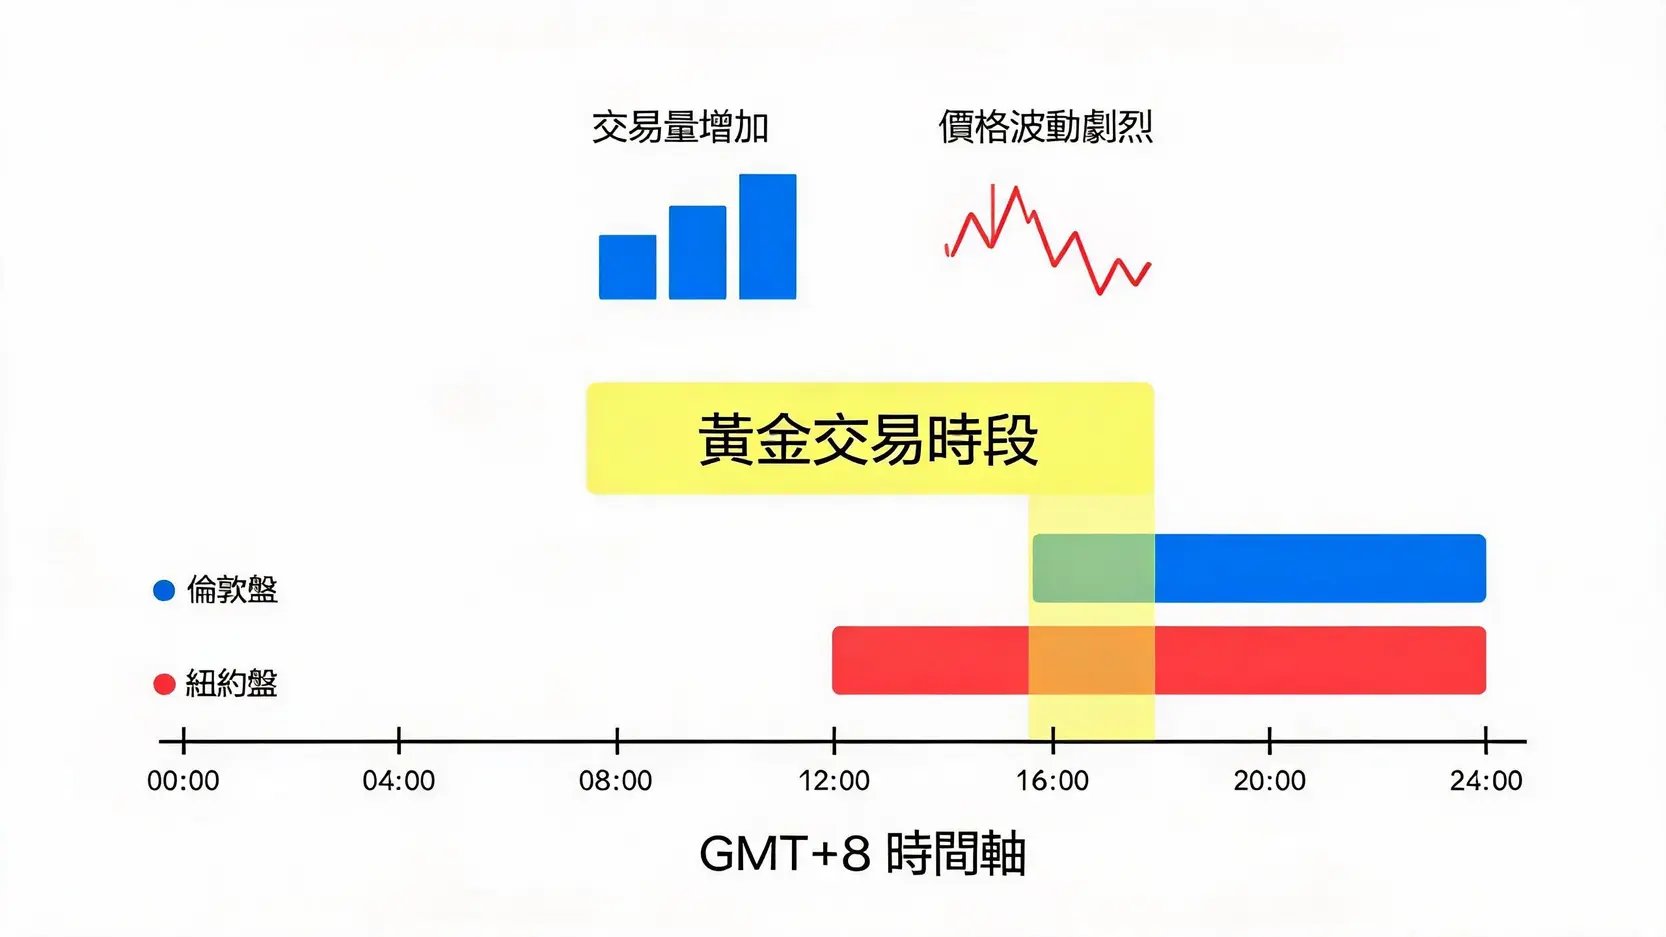
Why Is the Overlap Session (8 p.m. to 12 a.m. GMT+8) the Golden Trading Period?

一個時間軸圖表,顯示倫敦和紐約交易時段的重疊部分,即晚上8點至12點,是交易EUR/USD的黃金時段,此時段交易量和波動性最大。

EUR/USD Golden Trading Session (GMT+8 Time Zone)

The true “magic moment” occurs during the 4-hour overlap between the second half of the London session and the first half of the New York session (around 8 p.m. to 12 a.m. GMT+8). This session is known as the golden trading period for three reasons:

  1. Peak liquidity: Participants from both major markets are present at the same time, providing unmatched market depth, and trading costs (spreads) are usually at their lowest.
  2. Increased volatility: Important economic data releases and news events converge during this session, often triggering clear trending movements and providing excellent entry opportunities.
  3. Most trading opportunities: Whether for short-term scalpers or traders looking for intraday swings, this session offers the most suitable trading rhythm.


Further Reading (Strongly Recommended)

The Ultimate Guide to Trading XAUUSD Trends: From Candlestick Tutorials to Practical Strategies

RSI Indicator Tutorial 2026: From Beginner to Master, Master RSI Divergence in One Article


3 Practical Trading Strategies Best Suited for EUR/USD

After understanding the market’s macro background and active sessions, the next step is to turn knowledge into concrete strategies for action. Below are three practical EUR/USD strategies suitable for different risk preferences and trading styles.


Short-Term Trading: Scalping and Intraday Trading Strategies

Scalping and day trading focus on capturing small intraday fluctuations, with holding periods ranging from a few seconds to several hours, aiming to accumulate small gains. This strategy requires extremely strong execution.

  • Suitable session: The overlap between London and New York, because volatility and liquidity are at their best.
  • Common tools: Short-timeframe technical indicators, such as Bollinger Bands and the Stochastic Oscillator on 5-minute or 15-minute candlestick charts.
  • Core logic: Buy near support levels and sell near resistance levels, or quickly follow through when price breaks key levels. The profit target for each trade is not large, but strict stop-losses are key to survival.


Medium-Term Positioning: Swing Trading and Trend-Following Strategies

Swing trading aims to capture a “swing” that lasts for several days or even weeks. Traders do not focus too much on small intraday noise, but instead look at the larger trend direction. This is also a very common strategy type in trend trading tutorials.

  • Suitable session: Any session, but entry and exit decisions are usually based on the 4-hour or daily chart.
  • Common tools: Moving Averages, trend lines, and the MACD indicator.
  • Core logic: In an uptrend, wait for price to pull back to key support (such as the 50-day moving average), before buying. In a downtrend, wait for price to rebound to key resistance before selling. The goal is to capture the main part of the trend.


Technical Analysis: How to Use Moving Averages (MA) and Relative Strength Index (RSI)

No matter which trading style you choose, using technical indicators flexibly can greatly improve decision-making accuracy. MA and RSI are among the most classic and effective combinations.

  • Moving Average (MA): MA can smooth price data and help us identify the trend direction.

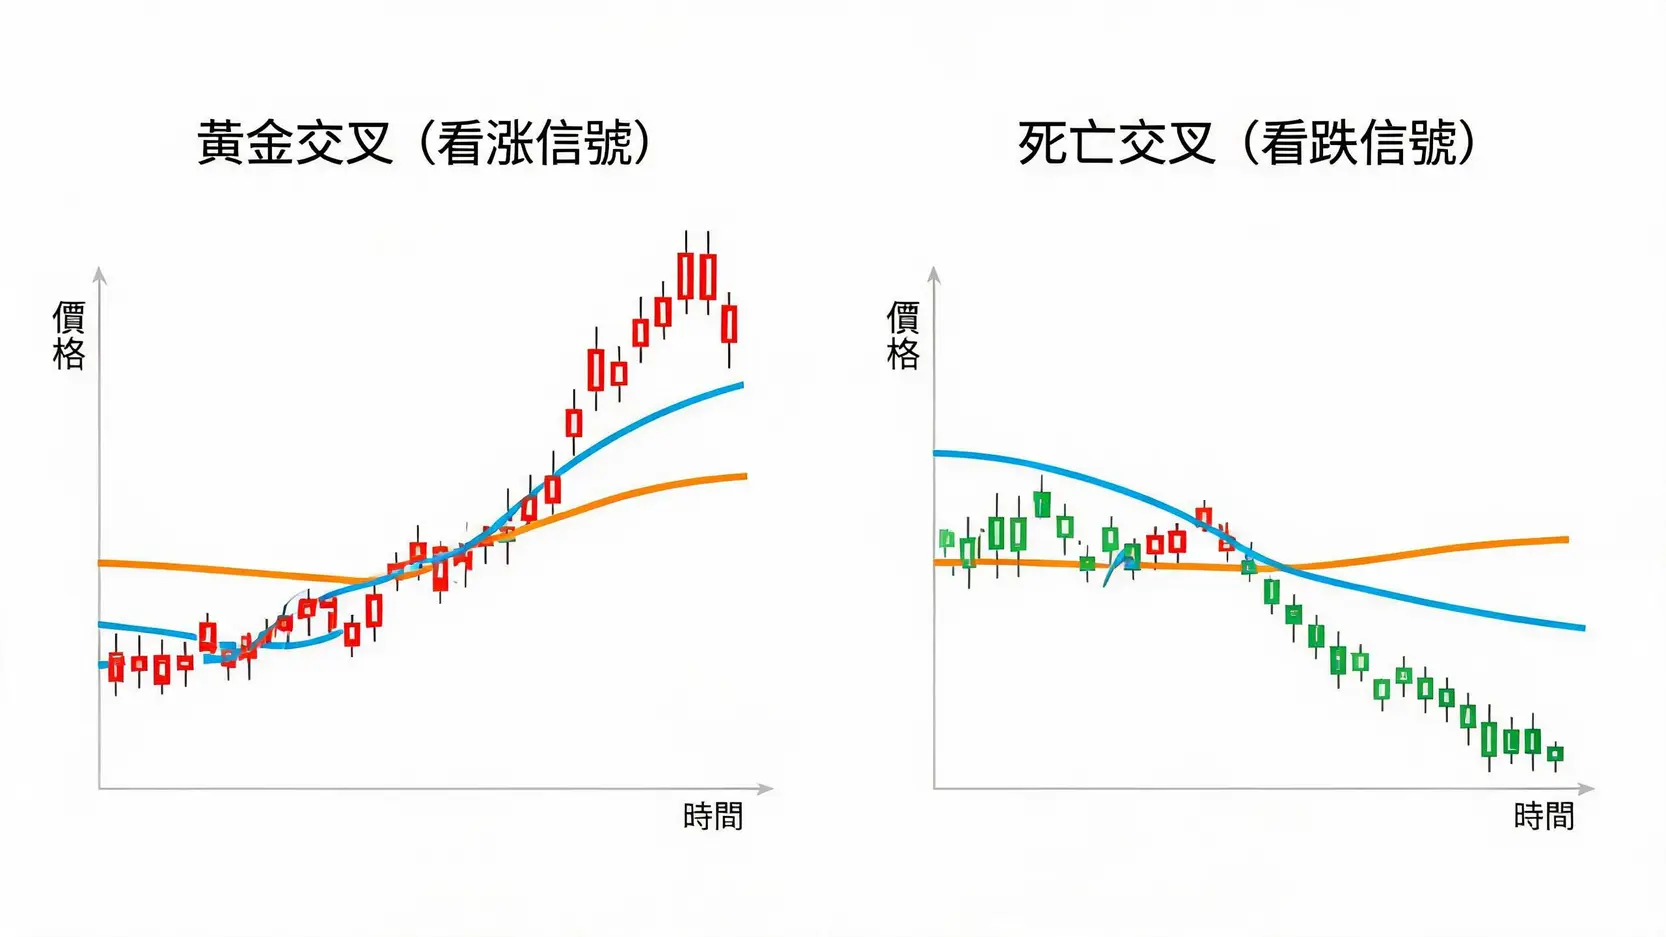
    對比圖展示了移動平均線中的黃金交叉(看漲信號)與死亡交叉(看跌信號)的K線圖形態。
    • Golden Cross and Death Cross of Moving Averages
      • Golden cross: When a short-period MA (such as the 20MA), crosses above a long-period MA (such as the 50MA), it is regarded as a bullish signal.
      • Death cross: When a short-period MA crosses below a long-period MA, it is regarded as a bearish signal.
    • Relative Strength Index (RSI): RSI is a momentum indicator used to determine whether the market is in an “overbought” or “oversold” state. To learn more in depth, you can refer to this complete RSI indicator tutorial.

      • Overbought zone (>70): The market may be overheated and at risk of a pullback, making it a potential sell signal.
      • Oversold zone (<30): The market may be oversold and have rebound opportunities, making it a potential buy signal.
      • RSI divergence: When price makes a new high (or new low), but the RSI indicator fails to follow, it is a strong warning signal of a trend reversal.


    Risk Management Checklist Before Trading EUR/USD

    Successful trading is half analysis and half risk management. No matter how perfect a strategy is, without iron discipline and capital protection measures, it is still likely to fail. Before trading the euro/US dollar, be sure to check the following list.


    How to Set a Reasonable Stop Loss?

    A stop loss is your safety belt. It ensures that when your judgment is wrong, your losses are limited to an acceptable range. Reasonable stop-loss setting methods include:

    • Technical-level stop loss: Set the stop loss outside key technical levels, such as below the previous swing low (when going long) or above the previous swing high (when going short).
    • Percentage stop loss: Based on your total capital, set the maximum loss percentage for each trade, such as 1% or 2% of the account.
    • Volatility stop loss: Use the ATR (Average True Range) indicator to set a stop-loss distance that matches current market volatility.


    Capital Management: How Much Should You Invest in Each Trade?

    “How many lots should I trade?” This is one of the most common questions asked by beginners. The answer is: never go all-in! Professional traders use position sizing calculations to ensure that even several consecutive losses will not cause devastating damage to the account. A widely respected rule is the “2% rule”, meaning the risk taken on a single trade should not exceed 2% of the total trading account.


    Common Beginner Mistakes: Overusing Leverage and Emotional Trading

    Leverage in forex trading is a double-edged sword. It can amplify your profits, but it can also multiply your losses. Beginners are often carried away by the temptation of high leverage and overtrade without understanding the risks. In addition, “revenge trading” after losses in an urgent attempt to recover capital, or “FOMO trading” due to fear of missing market moves, are both results of emotional interference and are major enemies of trading. Creating and strictly following a trading plan is the only way to overcome these inner demons.


    Further Reading (Strongly Recommended)

    The Ultimate Guide to Forex Margin Trading: A Complete Beginner’s Guide to Leverage, Risks, and Getting Started

    How to Pick RSI Points? The Strongest Technical Indicator Combination Strategy to Improve the Win Rate of Short-Term Trading!


    Conclusion

    In summary, a successful euro trading strategy is built on a deep understanding of macroeconomics, precise mastery of trading timing, and airtight risk management. From the policy tug-of-war between the two major central banks and the interpretation of key economic data, to the golden session of the London and New York markets, as well as the flexible application of scalping, swing trading, and technical indicators, these are all indispensable cornerstones for building your personal trading system. Now, it is time to start observing the market, apply the EUR/USD trading strategies learned in this article, and create your first trading plan!


    FAQ About Euro Trading Strategies

    Q: How much margin is required to trade EUR/USD?

    A: The margin required to trade EUR/USD is not a fixed amount. It depends on three factors: the leverage offered by your trading platform (broker), the number of lots you trade (contract size), and the current EUR/USD exchange rate. For example, with 100:1 leverage, trading 0.1 lot (10,000 currency units) of EUR/USD may require only around US$100 in margin. To learn more in depth, you can refer to this detailed guide on what forex margin is.

    Q: Which technical indicators are recommended for beginners to analyze the euro exchange rate?

    A: For beginners, it is recommended to start with the most classic and intuitive indicators. Moving Averages (MA) can help you quickly identify the main market trend direction. The Relative Strength Index (RSI) is very suitable for judging whether the market is overbought or oversold and for finding potential buy and sell points. Combining these two is a technical indicator combination recommended for many beginners, and it can effectively filter out a lot of market noise.

    Q: Which economic data has the greatest impact on the euro?

    A: Although GDP, PMI, and employment data are all important, in the current market environment, inflation data (CPI) and the European Central Bank (ECB) interest rate decisions are usually the strongest catalysts affecting the euro’s movement. This is because the inflation level is directly related to the direction of the central bank’s monetary policy, while interest rate decisions are the direct expression of policy and often trigger major market volatility within a short period.

    Q: What does “pip” mean in EUR/USD?

    A: “Pip” is the abbreviation of “Percentage in Point”, and it is the smallest unit used to measure exchange rate movements in a currency pair. For currency pairs such as EUR/USD that are quoted to four decimal places, a movement of 1 pip is 0.0001. For example, when EUR/USD rises from 1.0850 to 1.0855, it has risen by 5 pips. Understanding pip value is the foundation for calculating profit and loss.

If you liked this article, please share it!

Related Articles

  • How to Buy Bitcoin in 2026: A Beginner’s Guide
    How to Get Started with Bitcoin? The Complete 2026 Bitcoin Buying Guide for Beginners After watching Bitcoin repeatedly reach new highs in recent years and successfully pass spot ETF reviews in the US and Hong Kong in 2024, officially entering mainstream financial markets, many investors have turned their attention to...
    2026 年 7 月 20 日
  • Gold V-Shaped Rebound: Bottom Signal or Bull Trap?
    Is Gold’s V-Shaped Rebound a Bottom-Fishing Signal? A Complete Guide to Trading Strategies Amid “$100 Price Swings” What Is a Gold V-Shaped Rebound? More Than Just a Technical Pattern The gold market has recently experienced sharp rises and falls, with prices frequently displaying dramatic “gold V-shaped rebounds”. Single-day “$100 price...
    2026 年 7 月 20 日
  • 2026 PPI Guide: PPI vs CPI and Stock Market Impact
    What Is PPI Data? 2026 Latest Analysis: Understand the Differences from CPI and How It Affects Stock Market Trends With market information constantly changing, do you always hold your breath while waiting for CPI data to be released? But did you know that a more forward-looking inflation indicator, PPI data...
    2026 年 7 月 20 日
返回顶部