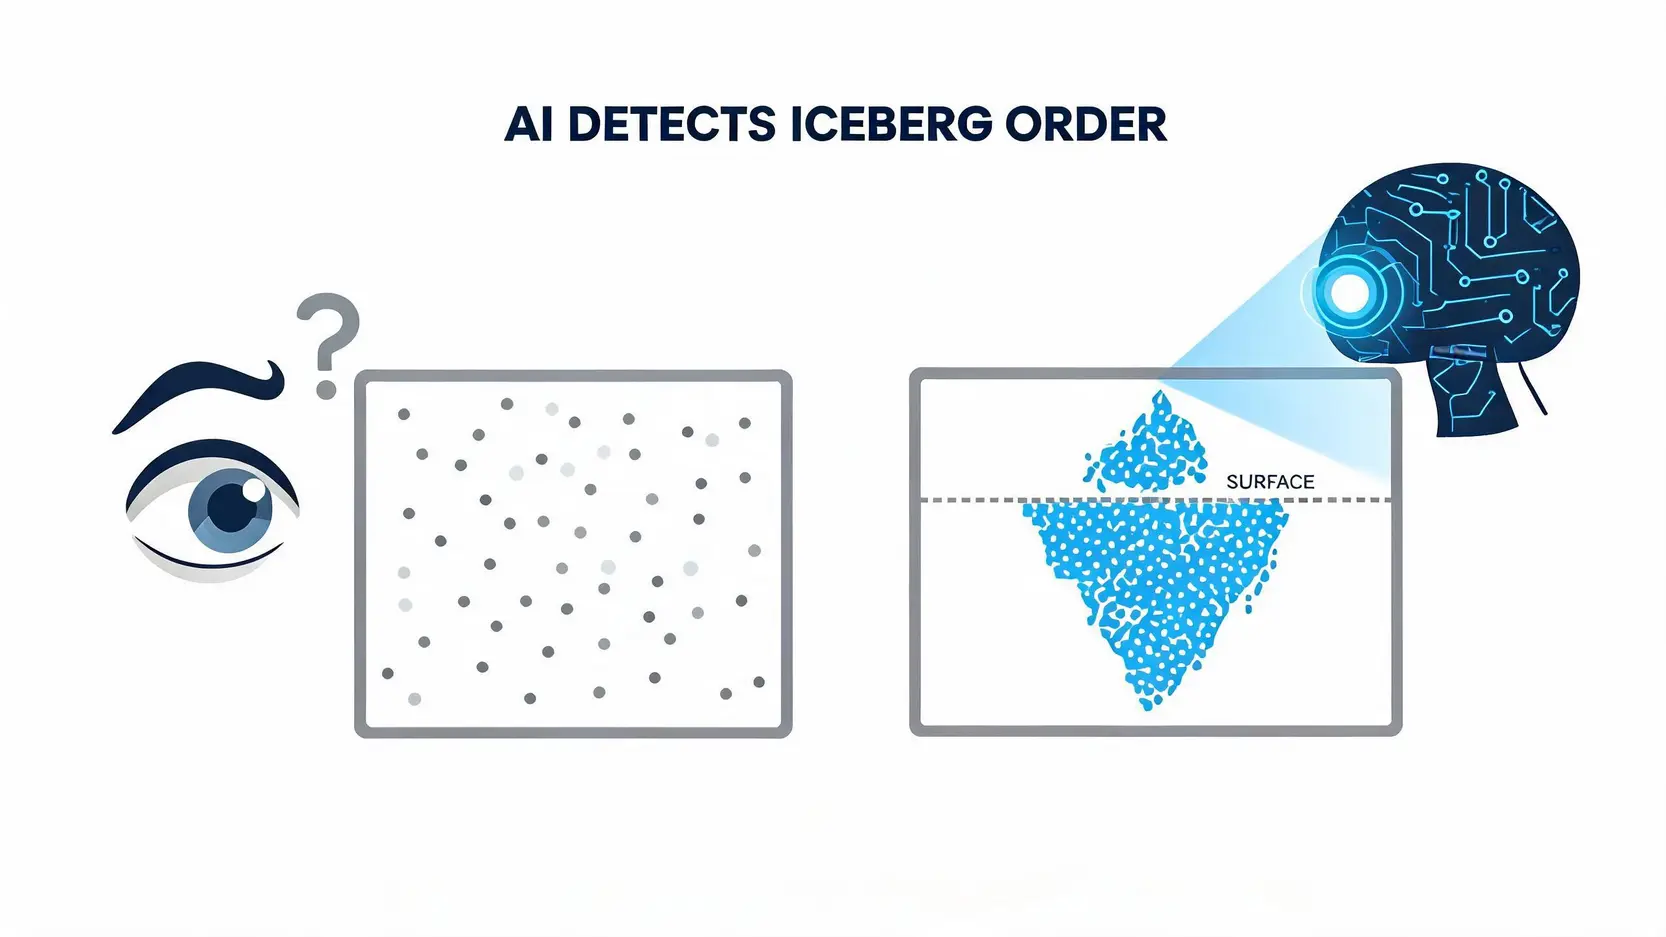
AI can penetrate surface data and identify “iceberg orders” that are difficult for humans to detect
3 Core Metrics for Evaluating Accuracy
A good AI order flow analysis tool should not rely on vague marketing claims about accuracy. We can objectively evaluate it through the following three core metrics:
- Signal Latency: How short is the time gap between AI pattern recognition and signal generation? In fast-moving markets, the lower, the better.
- Pattern Backtest Win Rate: In historical data, how successful are the patterns identified by the tool (such as absorption or sweeping) in producing the expected market movement?
- False Signal Filtering Ability: During sideways or noisy markets, can the AI effectively filter ambiguous signals and avoid frequent entries and exits that lead to losses?
Recommended Reading (Highly Recommended)
[Data Trading Guide] 5 Major Scalping Strategies with the Best Economic Calendar App Recommendations!
Japanese Yen Appreciation Must-Read: How to Identify “False Breakouts” Using Technical Analysis? Say Goodbye to Retail Traps
2026 Top 5 AI Order Flow Analysis Tools Review and Comparison
The market is full of tools. Here are five of the most notable AI order flow analysis tools in 2026, each with unique features, providing an in-depth evaluation to help you find the most suitable trading partner.
Tool 1: QuantVUE – Institutional-Grade Data, First Choice for Professional Traders
QuantVUE is designed for professional traders and small institutions seeking extreme data depth and speed. Its biggest feature is Level 3 market data, allowing users to see full order book depth. Its AI algorithm is particularly strong at detecting “order flow stacking” and “liquidity gaps”.
- Advantages: Most complete data, extremely low latency, advanced features (such as volume profile and delta analysis).
- Disadvantages: High subscription cost, complex interface, not beginner-friendly.
- Target users: Full-time traders, futures high-frequency traders, small fund managers.
Tool 2: Signalyst AI – A Practical Tool Focused on AI Trading Signal Performance
Signalyst AI does not pursue flashy charts. Instead, it focuses entirely on signal generation and optimization. Users can subscribe to trading signals for specific markets (such as crude oil or Nasdaq futures) and connect directly to broker APIs for automated or semi-automated trading. Its backtesting reports are highly transparent, detailing years of AI trading signal performance.
- Advantages: Signal-focused, clear objectives, transparent backtesting data, API integration supported.
- Disadvantages: Limited customization analysis, heavily dependent on built-in signals.
- Target users: Strategy traders who want to simplify decision-making and focus on execution.
Tool 3: Flowstarter – Beginner-Friendly Visual Learning Entry Point
For traders new to order flow concepts, Flowstarter is the best starting point. Its interface is extremely simple, converting complex order data into intuitive heatmaps and bubble charts, along with detailed educational content and community support.
- Advantages: Easy to use, clear visual charts, rich learning resources, affordable pricing.
- Disadvantages: Limited data depth and basic analysis functions, not suitable for advanced users.
- Target users: Beginner traders, students learning order flow analysis.
Tool 4: Apex Trader Pro – Comprehensive Advanced Chart Analysis Tool
Apex Trader Pro strikes an excellent balance between professional functionality and usability. It not only provides powerful order flow analysis but also integrates traditional technical indicators for cross-validation. Its “Footprint Chart” feature is particularly powerful, showing detailed buy and sell pressure at each price level.
- Advantages: Comprehensive features, highly customizable charts, integration of traditional indicators.
- Disadvantages: Requires learning time to fully master.
- Target users: Traders with basic technical analysis experience looking to advance into order flow analysis.
Tool 5: ZenFlow – Cost-Effective Lightweight Cloud Solution
ZenFlow is a lightweight web-based tool that requires no installation. It provides core order flow analysis functions. Although its data depth is not as strong as QuantVUE, it is sufficient for most daily trading scenarios. Its biggest appeal is flexible pricing, including a limited free version.
- Advantages: High cost-performance, no installation required, cross-platform access, free plan available.
- Disadvantages: Slight data delay, limited advanced analysis features.
- Target users: Budget-conscious traders, trend traders, users who need mobile access anytime.
[Summary Comparison Table] 5 Tools Features, Pricing, and Accuracy Rating Comprehensive Score
| Tool Name |
Target Users |
Core Advantages |
Price Range
|
Accuracy Rating (Overall) |
| QuantVUE |
Professional / Institutional |
Data depth, low latency |
High (over $300 per month) |
⭐️⭐️⭐️⭐️⭐️ |
| Signalyst AI |
Strategy Traders |
Signal performance, automation |
Mid to High (over $150 per month) |
⭐️⭐️⭐️⭐️ |
| Flowstarter |
Beginners |
Visualization, easy to use |
Low (over $50 per month) |
⭐️⭐️⭐️ |
| Apex Trader Pro |
Advanced Traders |
Comprehensive features, footprint chart |
Mid (over $100 per month) |
⭐️⭐️⭐️⭐️ |
| ZenFlow |
Budget-Conscious Users |
Cost-effective, cloud-based convenience |
Low (including a free plan) |
⭐️⭐️⭐️ |
How to Objectively Evaluate the Real Performance of AI Trading Signals?
Choosing a tool is only the first step. More importantly, you need to learn how to objectively evaluate whether the trading signals it produces are truly effective. Many people focus only on the “win rate”, but this is often the biggest trap. According to the authoritative financial website Investopedia, a complete evaluation system is far more complex.
Key Performance Indicators (KPI): It Is Not Just About Win Rate, but Also Risk-Reward Ratio
A complete evaluation system should include at least the following KPIs:
- Risk/Reward Ratio: How much does the average winning trade make? How much does the average losing trade lose? A healthy strategy should generally maintain a ratio of at least 1.5.
- Max Drawdown: During the entire testing period, what is the maximum decline from the account’s peak balance? This reflects the extreme risk the strategy may face.
- Sharpe Ratio: A metric that evaluates returns relative to risk. The higher the ratio, the greater the excess return earned for each unit of risk taken.
- Profit Factor: Total profit divided by total loss. A value above 1 means the strategy is profitable, and the higher, the better.
Backtesting Pitfalls: How to Avoid Overfitting and Future Data Bias
“Backtesting” is an important method for testing strategy performance using historical data, but it is easy to fall into traps. Overfitting refers to excessively tailoring a strategy to historical data, making it appear flawless in backtests but ineffective in real markets. In addition, beware of future data bias (Repainting), which occurs when data not actually available at the time is used in testing. This is a common tactic used by unreliable tools to artificially enhance results.
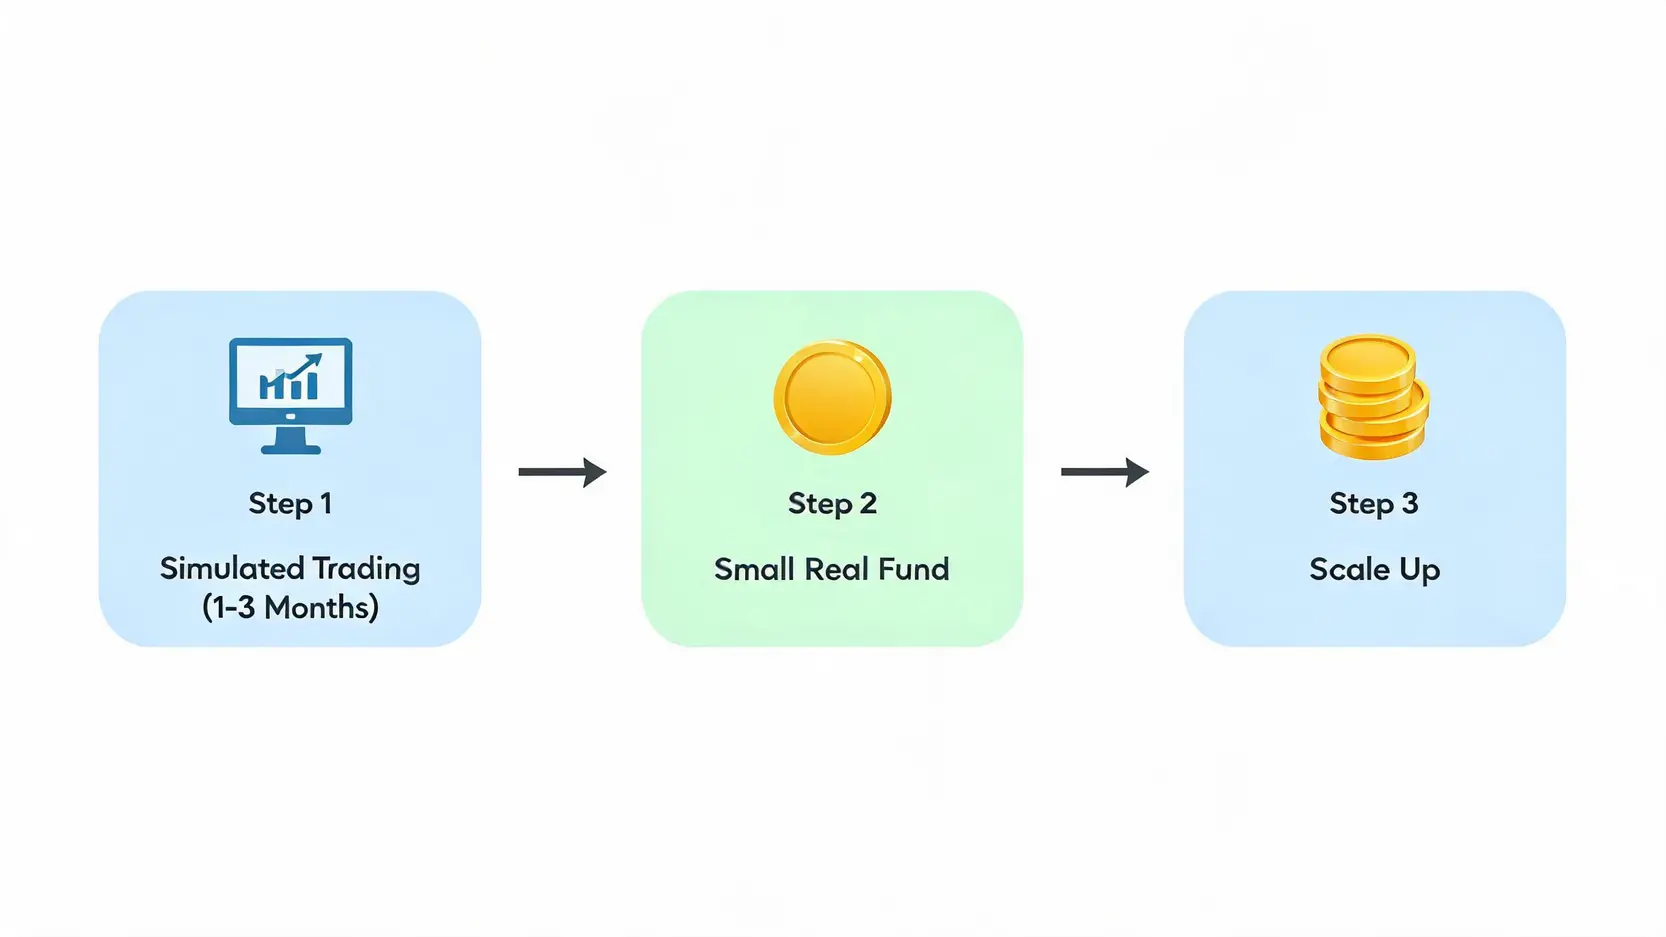
Live Verification: The Essential Process From Demo Account to Real Trading
No matter how impressive backtesting results appear, you should never immediately commit real capital. A rigorous process is: