Volatility Surface Guide: Skew Trading Strategies

Updated: 2026/06/03  |  CashbackIsland

volatility-surface-trading-guide

Practical Applications of Volatility Surfaces: From Options Modeling to Advanced Skew Trading Strategies

In options markets, implied volatility is never a flat line. Instead, it forms complex “smile” or “skew” surfaces. For advanced traders, mastering the practical applications of volatility surfaces is equivalent to possessing a lens that reveals market mispricing. When exploring options modeling techniques and skew trading strategies, many investors discover that understanding and utilizing these multidimensional data structures can significantly improve their win rates in the ongoing battle between options buyers and sellers. This article will help you break beyond the limitations of the traditional Black-Scholes model and explore how to transform implied volatility surfaces into real trading and profit opportunities. 


Rethinking the Volatility Surface

Many people learning options for the first time assume that volatility is a fixed constant. In practice, however, implied volatility varies significantly across different strike prices and expiration dates. To accurately apply volatility surfaces in real trading, it is essential to first establish a multidimensional understanding of this data structure.


The 3D Structure Formed by Strike Price and Expiration Date

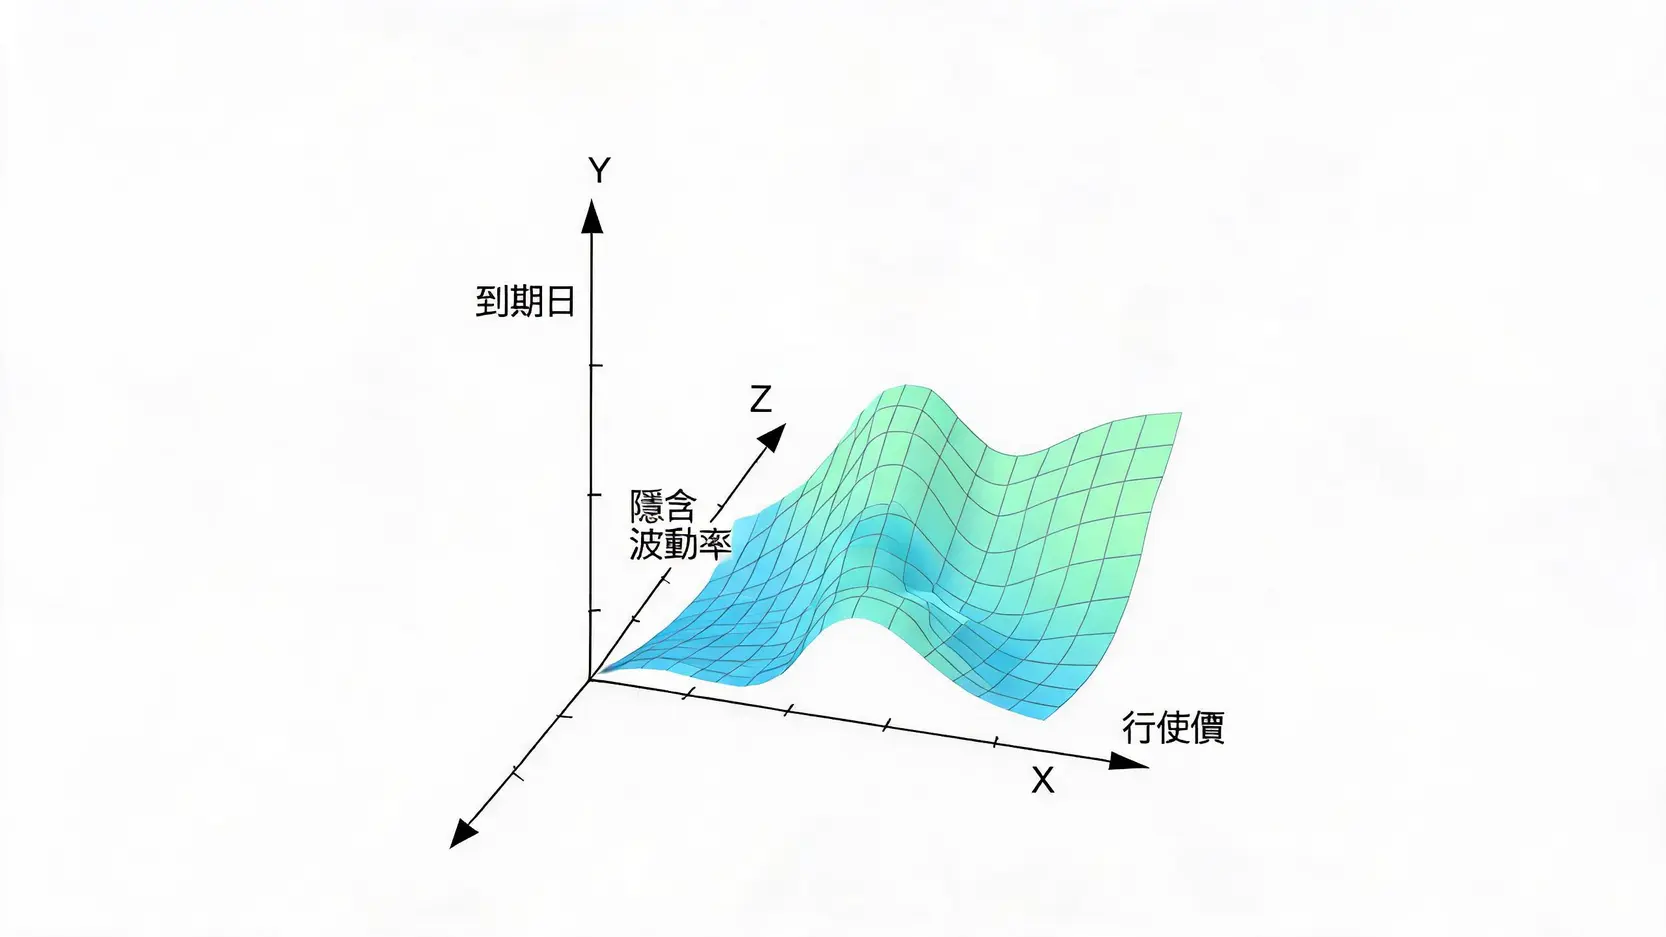
A volatility surface is essentially a three-dimensional model with “Strike Price” on the X-axis, “Time to Maturity” on the Y-axis, and “Implied Volatility” on the Z-axis. Through this model, traders can instantly observe market expectations for future volatility across different time horizons and price levels. If you wish to gain a deeper understanding of implied volatility fundamentals, you may refer to 【Options IV Guide】What Is Implied Volatility? Understanding IV Crush and Its Applications in One Article, which is crucial for understanding this three-dimensional structure.

波動率曲面的3D立體結構圖,包含行使價、到期日與隱含波動率三個維度

The Three Dimensions of a Volatility Surface: Strike Price, Time to Maturity, and Implied Volatility


Why Do Volatility Smiles and Skews Exist?

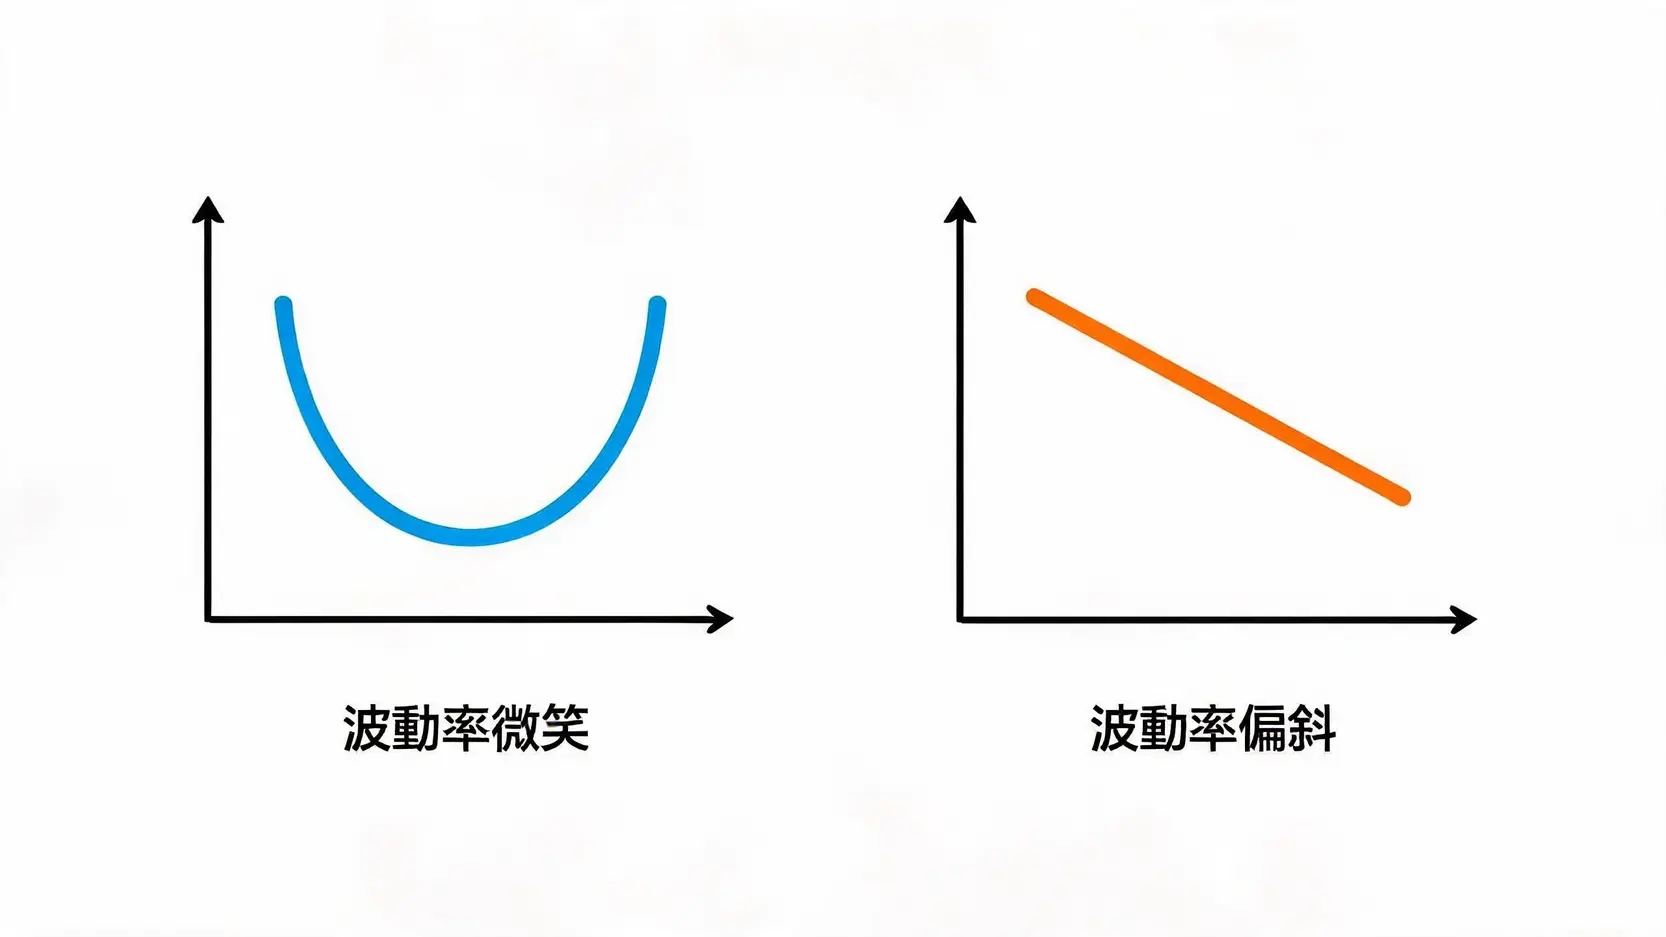
In idealized academic models, volatility surfaces should be flat. In reality, however, “implied volatility smiles” and “volatility skews” frequently appear. This primarily stems from market concerns about downside risk (such as crash scenarios), causing out-of-the-money Put options (OTM Puts) to carry significantly higher implied volatility than equally distant out-of-the-money Call options (OTM Calls). This skew phenomenon provides fertile ground for skew trading strategies and arbitrage opportunities. For a mathematical treatment of this phenomenon, readers may consult Mathematical Problems of Volatility in Finance published by Academia Sinica, which can help strengthen quantitative foundations.

波動率微笑與波動率偏斜的曲線對比圖

Volatility Smile (U-Shaped) and Volatility Skew (Higher on the Left, Lower on the Right)


Further Reading (Highly Recommended)

The Ultimate Vega Risk Management Guide: 5 Effective Strategies for Hedging Volatility

The Ultimate Options Spread Strategy Guide: Understanding Straddles and Iron Condor Strategies


Applying Volatility Surfaces to Skew Trading Strategies

After understanding the basic shape of the surface, the next step is converting that knowledge into practical skew trading and arbitrage strategies that exploit market mispricing.


Designing Vertical Spread Strategies Using Surface Slope

When the volatility surface exhibits an extremely steep skew, it indicates pricing discrepancies between options at different strike prices. Traders can sell options with abnormally high implied volatility while simultaneously buying lower-volatility options as protection. This forms the basis of classic vertical spread strategies. Through this approach, traders can profit from volatility reverting to its mean even if the underlying asset does not experience significant price movement.


Identifying Calendar Spread Opportunities Through Term Structure

Besides the horizontal strike skew, the vertical expiration structure (term structure) is also a core practical application of the volatility surface. When short-term implied volatility is significantly higher than long-term implied volatility (forming a backwardation structure), it usually indicates that a major event is expected in the near term (such as an earnings announcement or a macroeconomic policy decision). In such situations, calendar spread strategies involving the sale of expensive short-term options and the purchase of relatively cheaper long-term options can effectively capitalize on excessive short-term market fear. To better interpret market fear, it is highly recommended to read What Is the VIX Index? A Complete Trading Guide to Understanding Market Fear

Dynamic Volatility Surface Tracking During Extreme Market Conditions

In stable markets, options modeling is relatively straightforward. During extreme market conditions, however, static observation is no longer sufficient to handle rapid changes, making dynamic volatility surface tracking essential.


Surface Distortion Characteristics Before Black Swan Events

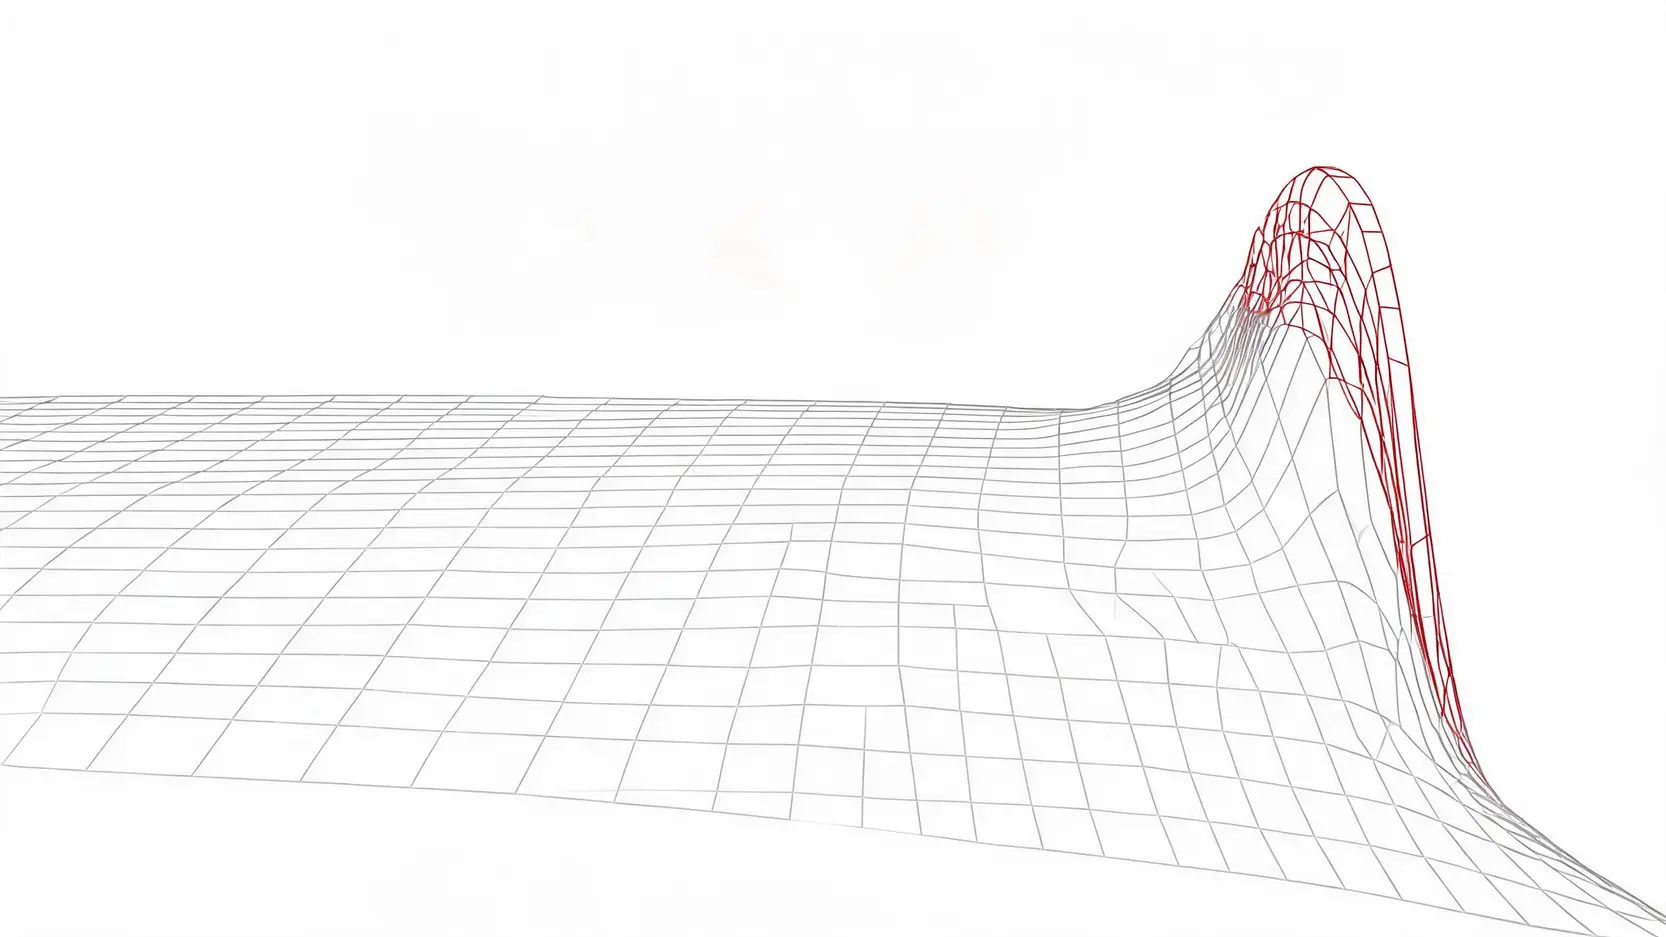
When underlying market stress begins to build, the entire volatility surface not only shifts higher but also becomes significantly distorted. For example, implied volatility in deep out-of-the-money Put options may surge irrationally, creating extreme tail-risk premiums. Experienced traders monitor these early signs of surface distortion to establish hedging positions in advance and protect against the impact of black swan events.

黑天鵝事件前夕波動率曲面發生的劇烈扭曲與邊緣翹起現象

Extreme Distortion of the Volatility Surface During Extreme Market Conditions: Tail Risk Causes Sharp Elevation at the Edges


Moving Beyond Academic Theory: Liquidity Discount Adjustments in Real Trading

Many investors rely too heavily on complex mathematical models such as SABR when performing options modeling, while overlooking the critical issue of liquidity in real-world trading. During extreme market conditions, certain out-of-the-money options may exhibit extremely wide bid-ask spreads due to a lack of market maker quotations. In practical dynamic tracking, liquidity discount factors must be incorporated into model adjustments to avoid situations where apparent arbitrage opportunities on paper result in substantial losses from severe slippage when orders are actually executed.


Frequently Asked Questions (FAQ)

Do beginners need programming skills to apply volatility surfaces?

While proficiency in programming languages such as Python can help you build more sophisticated options pricing and local volatility models, beginners can also use mature trading platforms and analytical software available in the market to directly view visualized 3D surface charts. The key is understanding the market sentiment and skew logic behind the data, rather than becoming deeply immersed in coding from the outset.

What localized characteristics does the Taiwan Index Options volatility surface have?

Due to the high level of retail participation and the strong influence of international equity markets (such as US stocks), the Taiwan Index Options market typically exhibits a pronounced left skew (Put Skew), indicating that demand for downside protection consistently exceeds expectations for substantial upside moves. In addition, the expiry-day effect before settlement often causes short-term implied volatility to become unusually steep.

Which is more suitable for practical trading, the SABR model or the local volatility model?

This depends on your trading horizon and strategy. Local Volatility models are more suitable for pricing exotic options, while the SABR model is more widely adopted by institutional traders in practical dynamic hedging and skew trading because it effectively fits market volatility smile and skew characteristics.

What is IV Crush, and how does it affect the surface?

IV Crush (or implied volatility collapse), typically occurs after major events (such as earnings releases or important economic data announcements). Once the event has passed and uncertainty is removed, expected market volatility declines sharply, causing the entire volatility surface to shift downward rapidly. This phenomenon can generate significant losses for options buyers, while simultaneously serving as a primary profit source for advanced seller strategies.

How can volatility surfaces be used to identify market mispricing?

You can compare the historical normal distribution of the surface with its current state to identify unusually elevated or depressed nodes. If the implied volatility at a particular strike price deviates significantly from neighboring strike prices without any reasonable event-based justification, this often represents temporary market mispricing and provides an excellent entry point for arbitrage strategies.


Conclusion

The practical application of volatility surfaces is not merely a mathematical theory within quantitative modeling. It is also a powerful investment tool for identifying market fear and mispricing opportunities. From understanding the fundamental three-dimensional structure, to designing spread strategies based on skew characteristics, to dynamically tracking surface changes during extreme market conditions, these techniques collectively form the core competitive advantage of advanced options traders. By mastering and continuously monitoring changes in the implied volatility smile, you can move beyond the limitations of simply predicting direction and gain a significant edge in the ongoing battle between options buyers and sellers, ultimately achieving long-term and stable asset growth.

If you liked this article, please share it!

Related Articles

  • How to Buy Bitcoin in 2026: A Beginner’s Guide
    How to Get Started with Bitcoin? The Complete 2026 Bitcoin Buying Guide for Beginners After watching Bitcoin repeatedly reach new highs in recent years and successfully pass spot ETF reviews in the US and Hong Kong in 2024, officially entering mainstream financial markets, many investors have turned their attention to...
    2026 年 7 月 20 日
  • Gold V-Shaped Rebound: Bottom Signal or Bull Trap?
    Is Gold’s V-Shaped Rebound a Bottom-Fishing Signal? A Complete Guide to Trading Strategies Amid “$100 Price Swings” What Is a Gold V-Shaped Rebound? More Than Just a Technical Pattern The gold market has recently experienced sharp rises and falls, with prices frequently displaying dramatic “gold V-shaped rebounds”. Single-day “$100 price...
    2026 年 7 月 20 日
  • 2026 PPI Guide: PPI vs CPI and Stock Market Impact
    What Is PPI Data? 2026 Latest Analysis: Understand the Differences from CPI and How It Affects Stock Market Trends With market information constantly changing, do you always hold your breath while waiting for CPI data to be released? But did you know that a more forward-looking inflation indicator, PPI data...
    2026 年 7 月 20 日
返回顶部