Implied Volatility Guide: IV Crush & Strategies

Updated: 2026/04/17  |  CashbackIsland

implied-volatility-iv-guide

[Options IV Tutorial] What Is Implied Volatility? A Complete Guide to IV Crush Meaning and Calculation Strategies

Have you ever been confused in options trading, where even when you correctly predict the direction of the underlying asset, the price of the premium still does not move as expected? The most critical factor behind this is very likely “implied volatility (IV)”. Understanding what implied volatility is is a necessary step from an options beginner to an advanced trader. This article provides a complete options IV tutorial, starting from scratch to help you deeply understand this core variable that affects options pricing, and also breaks down the most confusing concept for beginners, “IV crush meaning”, helping you make more informed decisions in the complex options market. 


What Is Implied Volatility (IV)?

Implied volatility (IV) sounds academic, but the concept is actually quite intuitive. It acts like the “sentiment indicator” or “fear index” of the options market, measuring the collective expectation of market participants regarding the “potential magnitude” of future price movements of the underlying asset. The higher the number, the more volatile the market expects future price movements to be; conversely, a lower number indicates expectations of relatively stable prices.


Core Definition of IV: It Is Not Historical Data, but the Market’s “Expectation” of the Future

One of the most common mistakes beginners make is confusing implied volatility with historical volatility (Historical Volatility, HV). HV is calculated based on “past” price movements of an asset over a certain period, making it an objective and historical dataset. IV, however, is completely different; it is a “forward-looking” indicator.

  • Predictive nature: IV is derived by “backing out” from options market prices, reflecting how much traders are willing to pay for future “uncertainty”.
  • Subjective nature: It includes market sentiment, such as expectations, excitement, or fear surrounding upcoming earnings, Fed meetings, or major news events.

In simple terms, HV tells you “how volatile the stock has been in the past” while IV tells you “how volatile the market expects it to be in the future”.


Why Does IV Have Such a Huge Impact on Options Pricing? Breaking Down the Premium

An option premium mainly consists of two components: Intrinsic value and extrinsic value (time value).

  • Intrinsic value: The profit if the option were exercised immediately. For example, a call option with a strike price of $100, when the market price is $105, has an intrinsic value of $5. Out-of-the-money (OTM) options have zero intrinsic value.
  • Time value: The portion of the premium above intrinsic value, representing the “hope” that the “price may move in a favorable direction” before expiration.

Implied volatility (IV) is the most critical factor affecting “time value”. When IV rises, the market expects greater future volatility, increasing the “probability” of options moving into the money before expiration. As a result, the time value of both calls and puts increases, making premiums more expensive. Conversely, when IV falls, time value shrinks, and premiums decrease.

期權權利金組成示意圖,顯示隱含波動率如何影響時間價值

Implied Volatility (IV) is the most important factor affecting option time value.


Extended Reading (Highly Recommended)

What Is the VIX Index? Understand the Market Signals Behind the “Fear Index”


Implied Volatility (IV) vs Historical Volatility (HV): Past vs Future in Volatility Analysis

To master options IV, it is essential to clearly distinguish IV from HV. Although both are called “volatility”, they measure completely different dimensions, one looks at the past, the other at the future.


HV: Objective data based on historical price movements

Historical volatility (HV) is calculated using statistical methods by measuring the standard deviation of an asset’s daily returns over a specific past period (e.g., 30 or 60 days). It reflects how much the asset has fluctuated historically. High HV indicates frequent and large past price swings, while low HV indicates relatively stable movement.


IV: A forward-looking indicator reflecting market sentiment and uncertainty

As mentioned earlier, implied volatility (IV) is not derived from historical data. It is the unknown variable solved by plugging “current market option prices” into an option pricing model (such as the Black-Scholes model). This value represents the cost the market is willing to pay to hedge future “uncertainty”. Therefore, the level of IV directly reflects the market’s collective expectations and sentiment.

歷史波動率與隱含波動率的對比圖

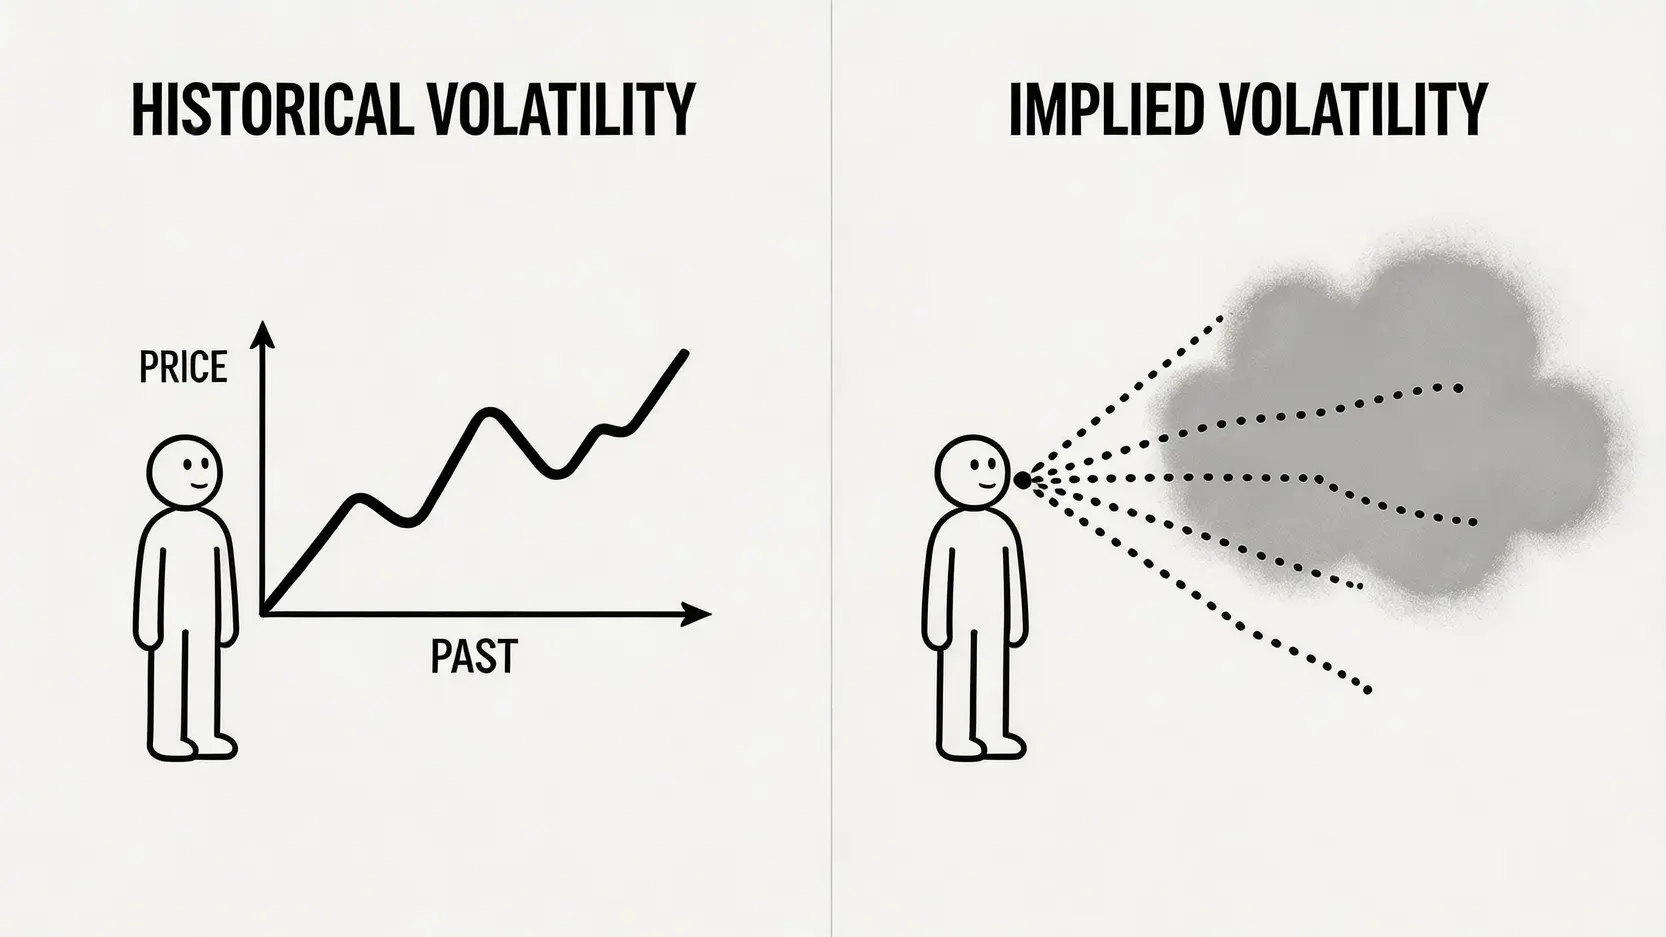
HV looks at the past and is objective data; IV looks at the future and reflects market expectations.


[Comparison Summary] A Table to Clearly Understand the Key Differences Between IV and HV

To help you understand more clearly, we have summarized the key differences between IV and HV in the table below:

Characteristic Implied Volatility (IV) Historical Volatility (HV)
Data Source Current options market price (premium) Historical price of the underlying asset
Time Dimension Forward-looking (expectation of the future) Backward-looking (summary of the past)
Nature Subjective, influenced by market sentiment and news events Objective, based on historical statistical data
Primary Use Evaluate whether options are expensive or cheap, and develop trading strategies Measure historical risk and build quantitative models


Understanding and Applying the Concept of Implied Volatility Calculation

After understanding the basic concept of implied volatility calculation, the next key step is how to interpret and apply it in practice. IV itself has no absolute good or bad value. High or low levels both contain different trading opportunities and risks. 

What Does High IV Represent: An Opportunity for Huge Profits or a Price Trap?

When IV surges, it usually means that a major market event is about to occur, such as:

  • Earnings releases from companies
  • Announcement of new drug clinical trial results
  • Federal Reserve interest rate decision meetings
  • Major geopolitical events

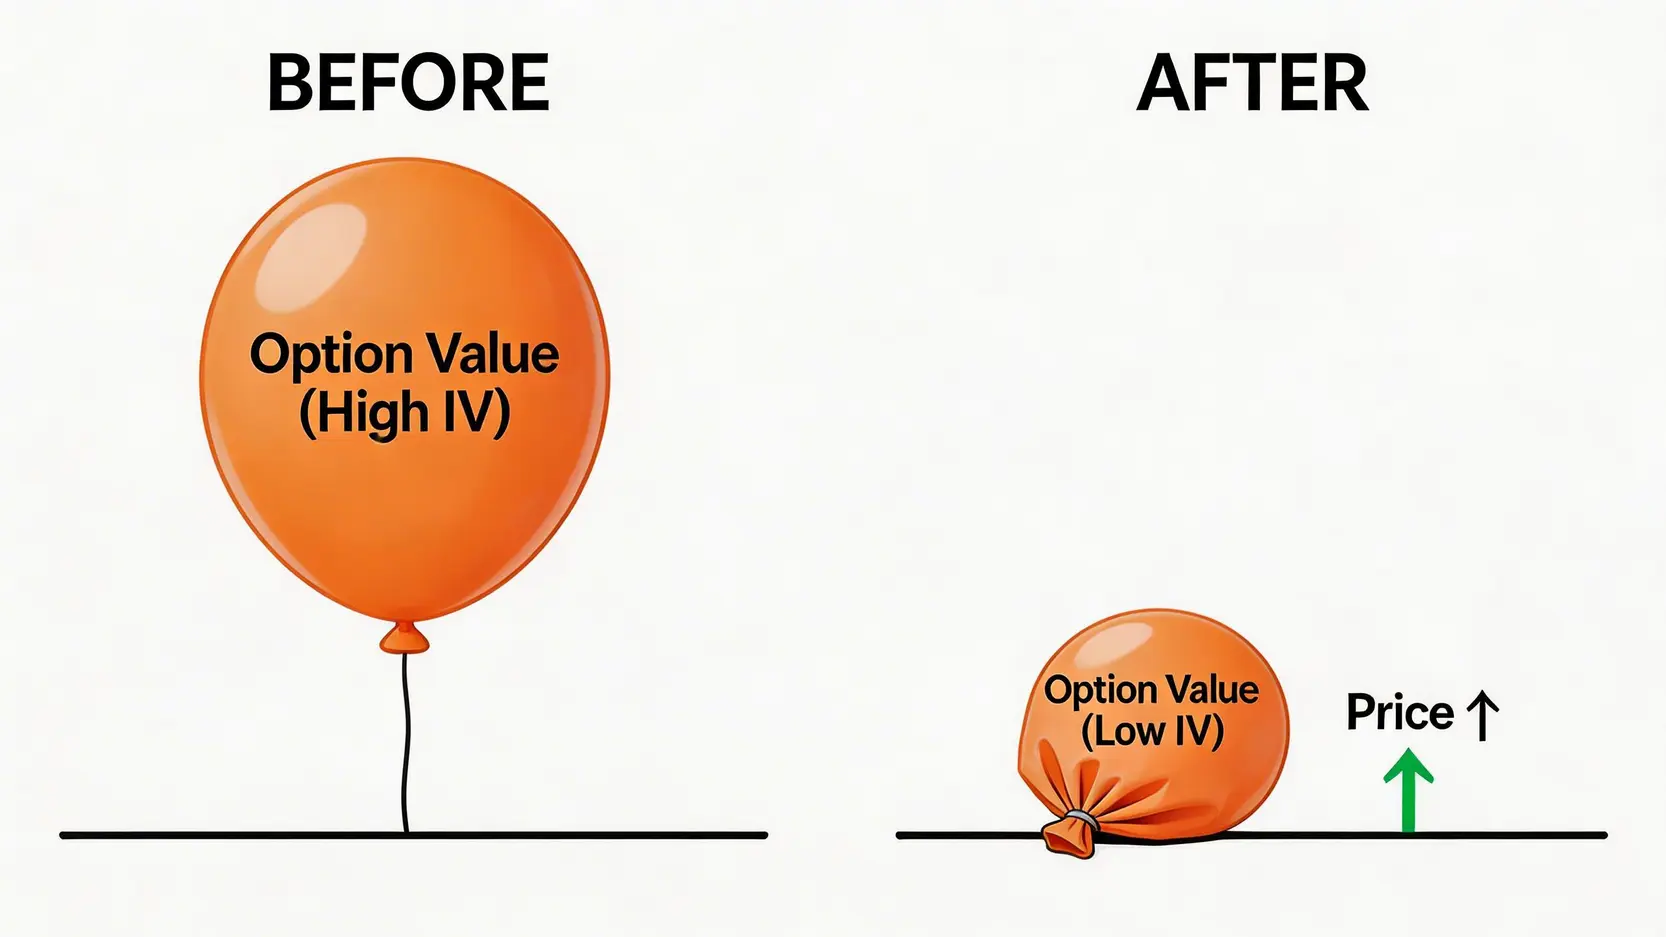
At this point, option premiums become very expensive. For option “sellers” (Sell Call / Sell Put), this is an excellent opportunity, because they can collect higher premiums. As long as the post-event price movement is not as extreme as expected, they can steadily earn time value. However, for “buyers”, high IV is a trap because the entry cost is extremely high. Once the event passes and IV drops sharply, even if the direction is correct, losses may still occur due to the subsequent “IV Crush”.


Insights From Low IV: When Is It a Good Time to Deploy Buyer Strategies?

When the market is calm and IV is at relatively low levels, option premiums are comparatively cheap. This is a more favorable environment for option “buyers” (Buy Call / Buy Put). You can establish positions at lower cost to speculate on potential large price movements in the future. If market volatility increases afterward and IV rises, you may have the opportunity to profit from both “directional gains (Delta profit)” and “IV expansion gains (Vega profit)”, achieving dual returns.


Introduction to Implied Volatility Calculation: A Brief Look at How the Black-Scholes Model Derives IV

Most traders do not need to manually calculate IV, as trading software provides it directly. However, understanding the underlying principle helps deepen your comprehension. The most classic option pricing model in the industry is the Black-Scholes Model, which considers five variables to calculate the theoretical option price:

  1. Underlying asset price
  2. Strike price
  3. Risk-free interest rate
  4. Time to expiration
  5. Volatility

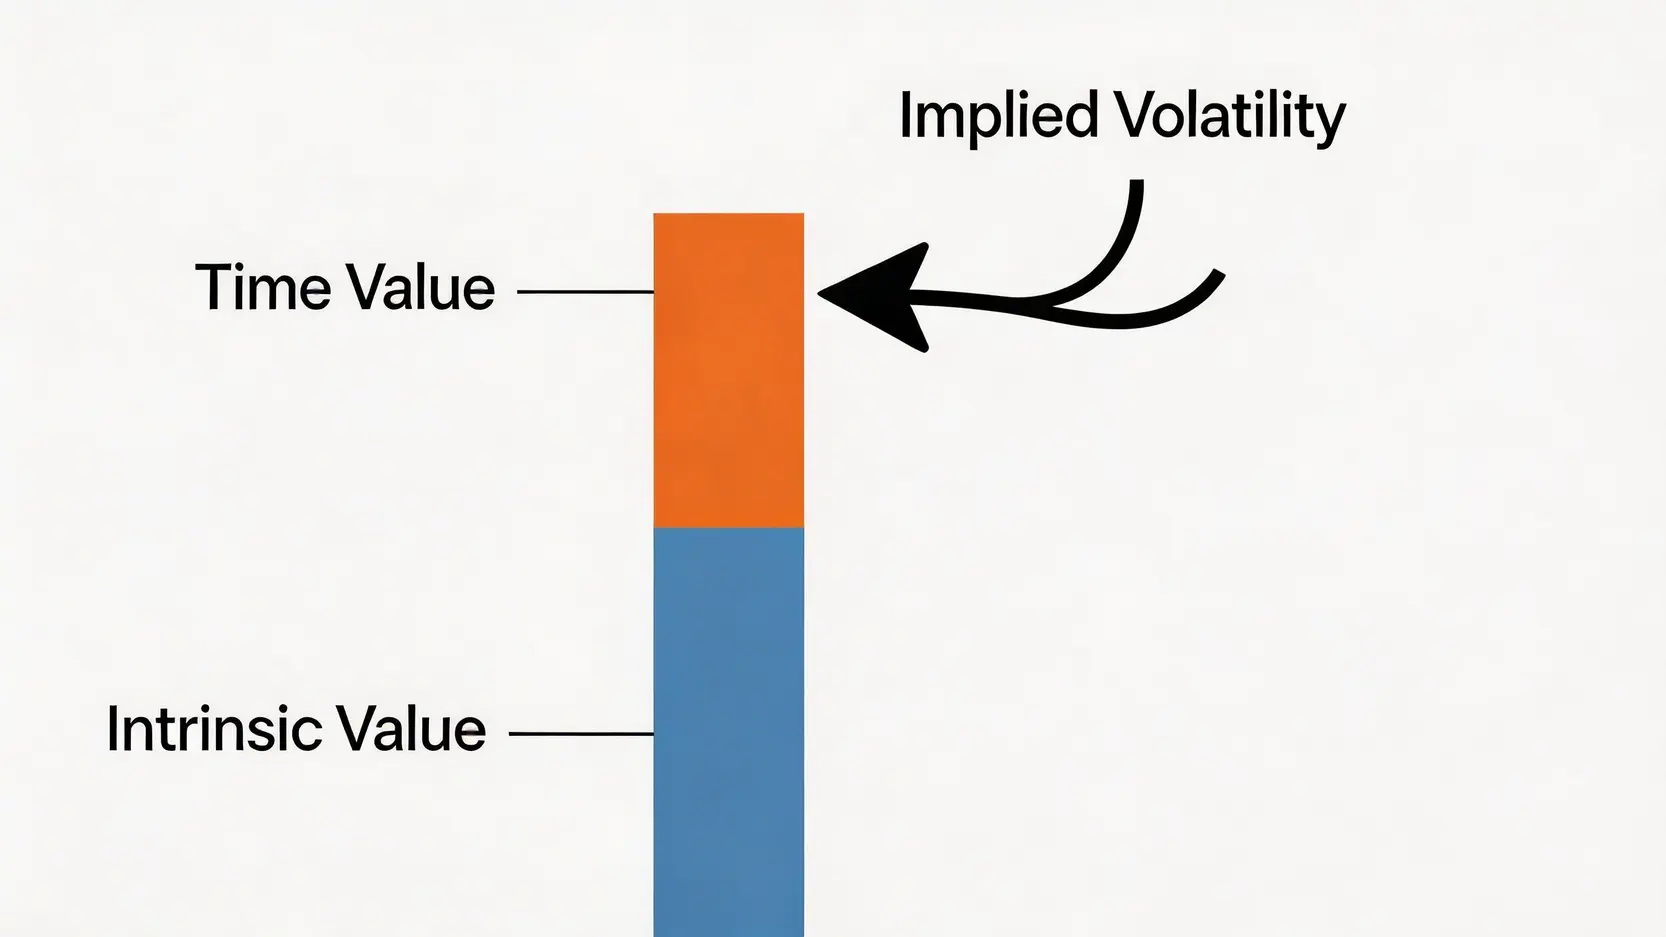
In practical application, the first four variables are known, and the market price of the option is also known. Therefore, we can substitute the market price into the formula and reverse-solve for the only unknown variable, “volatility”. This volatility implied by the market price is what we call IV.


The Terrifying Value Killer: What Is IV Crush (Implied Volatility Collapse)?

Once you understand IV, you must also understand its most dangerous aspect, IV Crush. This is the biggest nightmare for many beginner options traders and the main reason behind the situation of “getting direction right but still losing money”.


What IV Crush Means: Why Does It Vanish After Earnings and Other Major Events?

IV Crush refers to the sudden and significant drop in implied volatility after a major uncertainty event is resolved. Imagine that before an earnings announcement, the market is full of speculation and uncertainty. No one knows whether the result will be good or bad. This “unknown” pushes IV higher, making option prices expensive.

However, once the earnings are released, all uncertainty disappears instantly. Whether the result is better or worse than expected, the “fog” covering the market is lifted. At this point, IV quickly falls back to normal levels, causing option time value to evaporate instantly. This is IV Crush.

IV Crush 示意圖,事件前後期權價值因隱含波動率崩跌而大幅縮水

IV Crush: After the event, uncertainty disappears and option value collapses like a deflated balloon.


Case Study: Right Direction but Heavy Loss? The Power of IV Crush

Assume a stock is about to release earnings, trading at $100. Due to expected volatility, IV surges to 150%. You are bullish on the earnings result and spend $8 to buy a Call with a $105 strike price.

  • Scenario: After earnings, the stock rises to $110 as expected. You feel confident that you made money.
  • Harsh reality: After earnings, uncertainty disappears and IV drops from 150% to 30%. Your Call now has $5 intrinsic value ($110 – $105), but due to the collapse in time value from IV Crush, the option may only be worth $6.

Result: Even though the stock rose 10% as you expected, the trade still resulted in a loss ($6 selling price – $8 entry price = -$2). This is the terrifying effect of IV Crush.


Trading Strategies: How to Effectively Use or Avoid IV Crush Risk?

Facing IV Crush does not mean you are helpless. Smart traders either avoid it or use it to their advantage:

  1. Avoidance strategy (buyers): Avoid buying naked calls or put options right before major events when premiums are inflated. If you still want exposure, consider spread strategies such as Bull Call Spread or Bear Put Spread, where selling another further out-of-the-money option helps offset part of the premium cost and reduces IV Crush impact.
  2. Exploitation strategy (sellers): If you expect post-event price movement to be less extreme than what IV implies, you can sell options before the event (such as Straddle or Strangle strategies). By collecting high premiums, IV Crush becomes your ally, allowing you to profit quickly as volatility collapses after the event.


Frequently Asked Questions About Implied Volatility (FAQ)

Q: Where can IV be found?

A: Almost all professional stock and options trading platforms provide IV data. You can find IV for each contract on the option chain. Many financial websites (such as Yahoo Finance and Barchart) also provide IV indicators for individual stocks or the broader market.

Q: Does a higher IV mean options are more expensive?

A: Yes. Under the same conditions (such as stock price, strike price, and expiration), higher IV leads to higher time value, which makes the option premium (market price) more expensive. Therefore, IV is often used as a relative indicator of whether options are “expensive” or “cheap”.

Q: What is the relationship between the VIX index and implied volatility?

A: The VIX index, often called the “fear index”, is itself a measure of overall market implied volatility. Specifically, it is calculated based on S&P 500 index options expiring in 30 days and reflects market expectations of volatility over the next 30 days. In short, VIX can be seen as the “overall IV indicator” of the US stock market sentiment. For deeper understanding, you may refer to detailed VIX index tutorials.

Q: Does IV Crush only happen after earnings announcements?

A: No. Although earnings season is the most common scenario, any event that removes major uncertainty can trigger IV Crush. This includes Federal Reserve interest rate decisions, important economic data releases (such as CPI or non-farm payrolls), product launch events, FDA drug approvals, and more.


Conclusion

In summary, mastering implied volatility is a key advanced skill in options trading. It is not only a measure of whether premiums are expensive or cheap, but also an indicator of market sentiment. A deep understanding of the fundamental differences between IV and HV, the ability to interpret trading signals behind high and low IV, and constant awareness of IV Crush risks can significantly improve trading performance and risk management. This complete IV options guide is designed to help you use implied volatility more confidently in strategy deployment and navigate the options market more effectively.

If you liked this article, please share it!

Related Articles

  • Volatility Surface Guide: Skew Trading Strategies
    Practical Applications of Volatility Surfaces: From Options Modeling to Advanced Skew Trading Strategies In options markets, implied volatility is never a flat line. Instead, it forms complex "smile" or "skew" surfaces. For advanced traders, mastering the practical applications of volatility surfaces is equivalent to possessing a lens that reveals market...
    2026 年 6 月 3 日
  • Foreign Capital Flow Model: Track Institutional Money
    Building a Foreign Capital Flow Copy Trading Model: A Stock Market Indicator for Accurately Tracking Institutional Positioning In Asia-Pacific stock markets, foreign capital inflows and outflows often determine the direction of the index. However, simply looking at daily net buy and sell data is no longer enough. Only by building...
    2026 年 6 月 3 日
  • Options Buying Strategies for Extreme Market Risks
    Options Buyer Strategies During Extreme Market Conditions: Black Swan Hedging and Cross-Market Arbitrage During Volatility Surges The most terrifying aspect of financial markets is not a gradual decline, but overnight flash crashes and cross-market capital withdrawals accompanied by volatility surges. In the highly unpredictable global macroeconomic environment of 2026, geopolitical...
    2026 年 6 月 3 日
返回顶部