S&P 500 Returns: Annualized Data & ETF Insights

A Complete Analysis of the S&P 500 Annualized Return Rate: What Historical Data Tells You About How Much You Can Earn Investing in US Stock ETFs
Many investors have heard that “buy and hold the S&P 500” is a proven path to financial stability, but do you truly understand the actual performance of the “S&P 500 index return rate“? In the face of market fluctuations and watching your account rise and fall, you may wonder whether the long-term S&P 500 annualized return is truly reliable. This article provides an in-depth analysis of the historical return data of the S&P 500, answers all your questions about investing in US stock ETF returns, and offers clear ETF selection strategies to help you build solid investment confidence and achieve long-term asset growth.
Revealing the Historical Annualized Returns of the S&P 500
The most direct way to evaluate the value of an investment is to review its historical performance. Since its inception, the S&P 500 index has gone through multiple economic recessions, wars, and technology bubbles, yet it has consistently navigated bull and bear markets, demonstrating remarkable long-term growth potential. Understanding this historical data is the first step in building investment confidence.
Backtested Data: What Are the Average Returns Over the Past 10, 30, and 50 Years?
It is often said in the market that the “average annualized return of the S&P 500 is around 10%”, and this claim is not without basis. Based on historical data, this figure is a relatively reliable long-term average. However, returns vary across different time periods:
- Past 10 years (approximately 2016-2025): This period includes a strong bull market in technology stocks. Despite experiencing a brief bear market in 2020 and a correction in 2022, the annualized return remains very impressive, at approximately 12% to 14%. This is largely driven by earnings growth and market expansion of major technology companies.
- Past 30 years (approximately 1996-2025): This longer period includes the burst of the dot-com bubble in 2000 and the global financial crisis in 2008. Even so, the annualized return of the S&P 500 (including dividends) remains around 9% to 10%, fully demonstrating its recovery capability after crises.
- Past 50 years (approximately 1976-2025): Over an even longer timeframe, including the stagflation period of the 1970s, the long-term annualized return still remains stable at around 10% to 11%. This data strongly shows that for patient long-term investors, the S&P 500 is a highly reliable engine for wealth growth.
Of course, historical data does not fully equate to future predictions, but it provides a rational basis for expectations.

Long-Term Annualized Return of the S&P 500: Steady Growth Across Time
The Power of Dividend Reinvestment: The Difference Between Total Return and Price Return
When calculating the S&P 500 annualized return, many beginners overlook a key factor: dividends. Most companies within the S&P 500 index distribute a portion of their profits to shareholders in the form of dividends.
- Price Return: Only reflects the change in the index price itself, excluding dividends.
- Total Return: Assume that the investor immediately uses all received dividends to purchase additional index units (dividend reinvestment).
The difference between the two is significant. For example, over the past 30 years, the S&P 500 price return may have been around 7% to 8% annually, but after adding an average dividend yield of about 2% and reinvesting it, the total return can reach close to 10%. The compounding effect of dividend reinvestment is a powerful “hidden accelerator” in long-term investing. When investing in ETFs that track the S&P 500, most ETFs automatically reinvest dividends, allowing investors to fully benefit from total returns.

Dividend Reinvestment: The “Hidden Accelerator” of Long-Term Returns
Experiencing Bull and Bear Markets: How Does the S&P 500 Perform Across Economic Cycles?
Markets do not rise forever, and bear markets are an inevitable part of investing. Observing how the S&P 500 performed during major historical bear markets helps build a healthier investment mindset:
- Dot-com bubble in 2000: It took about 7 years for the market to recover to its previous peak.
- Global financial crisis in 2008: The index fell by more than 50% within about 18 months, but then entered a decade-long bull market and returned to its previous peak in about 5 and a half years.
- COVID-19 pandemic in 2020: The market dropped more than 30% within a month, but rebounded rapidly within just 5 months and reached new highs, demonstrating strong resilience.
These historical events show that although short-term drawdowns can be painful, the US economy and its leading companies possess strong innovation and recovery capabilities. For investors following a “buy and hold” strategy, bear markets can instead be a golden opportunity to accumulate high-quality assets at lower costs.
Further Reading (Highly Recommended)
How to Invest in the S&P 500 Through US Stock ETFs? A Comparison of Three Major Popular ETFs
For ordinary investors, the simplest and lowest-cost way to invest in the S&P 500 is to purchase exchange-traded funds (ETFs) that track the index. There are many options in the market, but three of the largest and most liquid ETFs are the most popular: VOO, SPY, and IVV.
VOO vs SPY vs IVV: A Comprehensive Comparison of Expense Ratios, Scale, and Tracking Error
All three ETFs aim to replicate the performance of the S&P 500 index, so their holdings and long-term returns are highly similar. The main differences lie in several subtle but important details, especially for long-term investors.
| Category | VOO (Vanguard) | SPY (State Street) | IVV (iShares) |
| Issuer | Vanguard | State Street | BlackRock |
| Inception Date | Year 2010 | Year 1993 | Year 2000 |
| Management Fee (Annual Expense Ratio) | 0.03% | 0.09% | 0.03% |
| Assets Under Management (AUM) | Large | Largest | Large |
| Structure | ETF (Open-End Fund) |
UIT (Unit Investment Trust) |
ETF (Open-End Fund) |
| Advantages | Very low fees, suitable for long-term holding | Longest history, extremely high liquidity, active options trading | Very low fees, issued by BlackRock |
Which ETF Is Most Suitable for Small Investors or Long-Term Investors?
From the table above, it is clear that for small investors or long-term investors who plan to “buy and hold” for several years or even decades, VOO and IVV are the better choices. The main reason is that their management fees (0.03%) are only one-third of SPY (0.09%).
This 0.06% annual fee difference may seem negligible in the short term, but when amplified by the compounding effect over 20 or 30 years, it can have a significant impact on your final investment returns. SPY’s advantage lies in its unparalleled liquidity and massive options market, which is more attractive to institutional investors who require frequent trading or complex derivatives strategies. For the vast majority of individual investors aiming to accumulate wealth, choosing VOO or IVV and converting the saved fees into returns is undoubtedly the wiser decision.
Hidden Costs of Investing in US Stock ETFs: Dividend Tax and Trading Fees
In addition to management fees, there are two potential costs to be aware of when investing in US stock ETFs:
- Dividend Tax: For non-US tax residents (such as investors from Taiwan or Malaysia), dividends distributed by S&P 500 ETFs are subject to a 30% withholding tax. This directly affects your total return, reducing the actual dividend yield. This is a common and unavoidable cost when investing in US stocks.
- Trading Fees: This depends on the broker you use. Fortunately, many international brokers now offer zero-commission or very low-cost trading for US stock ETFs. By choosing the right platform, this cost can be minimized.
Key Factors Affecting Future Returns of the S&P 500
Historical returns provide a reference, but the future is uncertain. Understanding the macro factors that influence the S&P 500 index returns can help you stay calm during market fluctuations and make more rational decisions.
Macroeconomics: How Do Interest Rates and Inflation Affect the Market?
Central bank policies (especially those of the Federal Reserve) are key drivers of the stock market. Generally:
- Rate hike cycle: When interest rates rise, borrowing costs for companies increase, which may compress profits. At the same time, higher yields on risk-free government bonds reduce the relative attractiveness of stocks, potentially leading to valuation compression in the equity market.
- Rate cut cycle: When interest rates decline, the cost of capital decreases, which supports corporate expansion and earnings growth, typically boosting the stock market.

Interest Rates and the Stock Market: An Inverse Seesaw Relationship
Inflation is another important variable. Moderate inflation can benefit companies by allowing them to raise prices, but excessively high inflation erodes consumers’ purchasing power and forces central banks to adopt tighter monetary policies, which puts pressure on the stock market.
Corporate Earnings: How Do Tech Giants Dominate the Index Direction?
The S&P 500 is a market-cap-weighted index, meaning that companies with larger market capitalizations have a greater impact on the index’s movements. Currently, the index is heavily concentrated in several major technology companies (such as Apple, Microsoft, Amazon, and Nvidia).
As a result, the profitability, pace of innovation, and future outlook of these tech giants largely determine the direction of the entire S&P 500 index. When they perform strongly, they drive the index to new highs. Conversely, if they face headwinds, the index may come under downward pressure even if the other 490 companies perform steadily. Monitoring the earnings reports and industry trends of these leading companies is a key task in assessing market direction.
Market Valuation: Is the Current Price-to-Earnings Ratio Too High or Reasonable?
The price-to-earnings ratio (P/E Ratio) is a commonly used metric to measure stock prices relative to a company’s earnings. By observing the overall P/E ratio of the S&P 500 and comparing it with its historical average (typically around 15 to 20 times), one can roughly determine whether the market is currently “expensive”, “fair”, or “cheap”.
When the P/E ratio is significantly above the historical average, it may indicate overly optimistic market sentiment, suggesting that future return expectations should be moderated and that the risk of correction is higher. Conversely, when the P/E ratio is at historical lows, it is often a good entry opportunity for long-term investors. However, valuation is not a precise timing tool, and the market can remain “expensive” for an extended period while continuing to rise.
Common Questions About the S&P 500 Index Return Rate
In actual investing, you may encounter some specific questions. Here are several of the most common ones with answers provided.
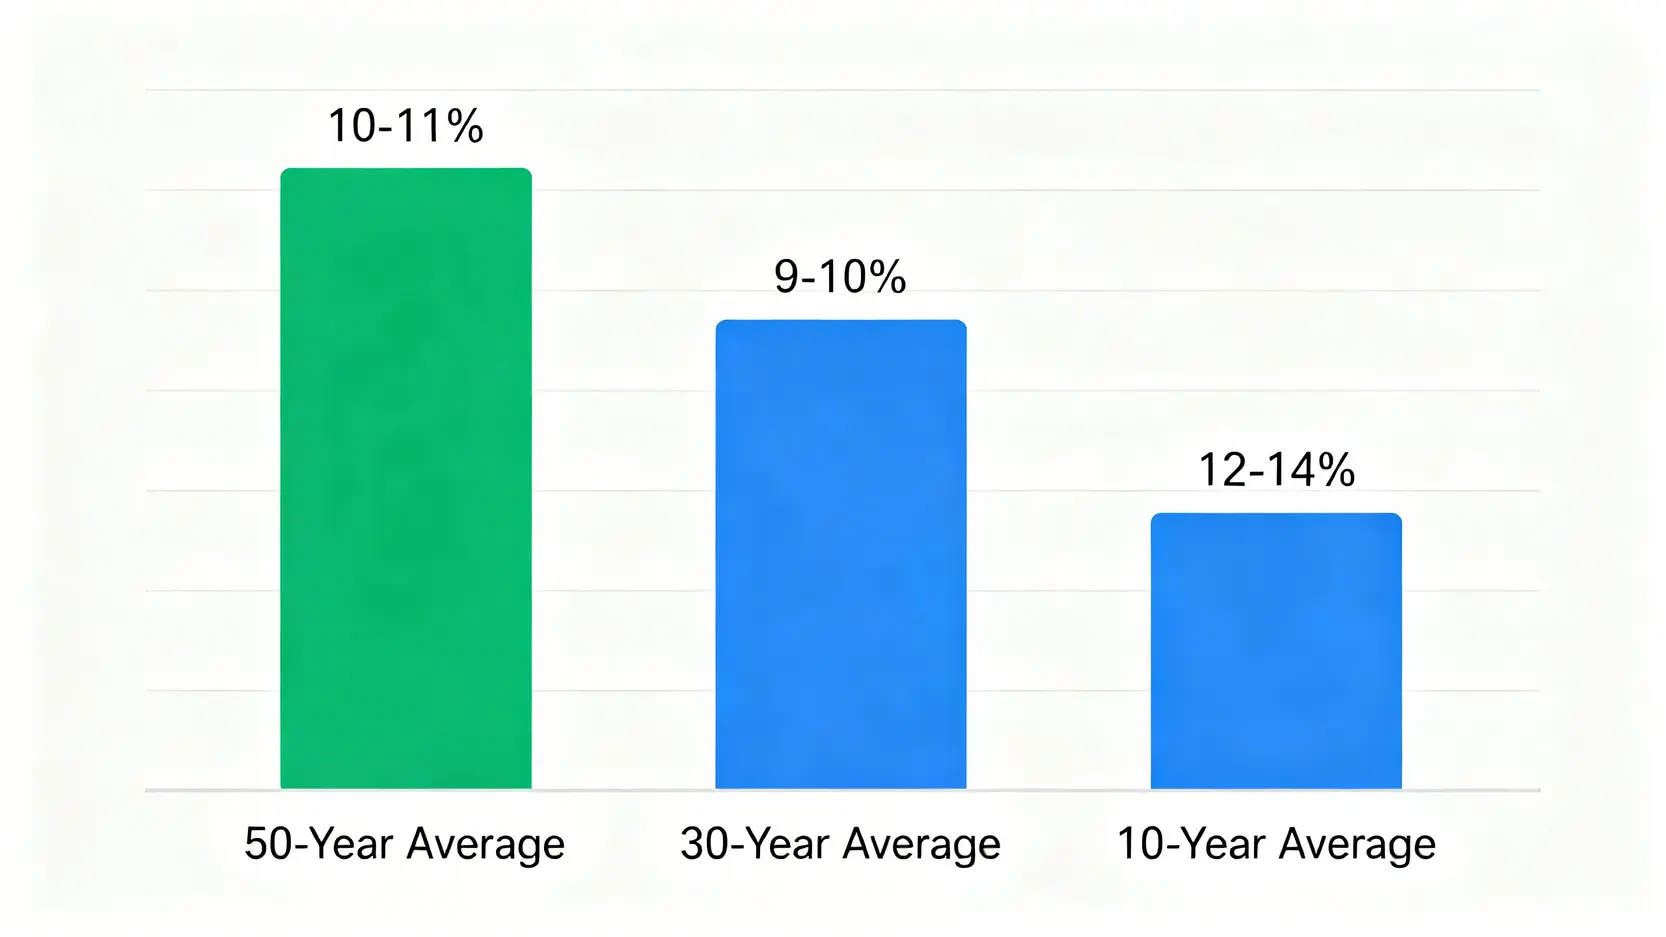
Q: Is the average annualized return of the S&P 500 really 10%?
A: Yes. Based on decades of historical data, including dividend reinvestment, the total return does average close to 10%. However, it is important to understand that this is a “long-term average” and does not mean every year delivers 10%. There will be years with very strong performance (such as returns exceeding 20%), as well as years of decline. The key is to hold for the long term and allow time to smooth out short-term volatility to achieve returns close to the average.
Q: What is the biggest risk of investing in S&P 500 ETFs?
A: The biggest risk is systematic risk. Since the S&P 500 represents the overall US large-cap market, when there is a broad economic recession, financial crisis, or major geopolitical event, the index can decline significantly, and the net asset value of your ETF will also drop. This type of risk cannot be eliminated through diversification across different stocks. Another risk is short-term volatility risk. If you invest at a market peak and sell shortly after during a downturn due to panic, it will result in actual losses.
Q: Should you invest in a lump sum or use dollar-cost averaging (DCA) to buy S&P 500 ETFs?
A: This is a classic investment strategy question. From a purely mathematical and historical backtesting perspective, since the market has a long-term upward trend, lump sum investing generally has a higher expected return than dollar-cost averaging. However, this requires strong psychological resilience to withstand the possibility of the market declining immediately after investing. For beginners or investors with lower risk tolerance, dollar-cost averaging is a better choice. It helps spread out the purchase cost, reduce timing risk, and build a disciplined habit of regular investing.
Q: Besides VOO, SPY, and IVV, are there other ETFs that track the S&P 500?
A: Yes. In addition to these three major options, there are other choices, such as RSP issued by Invesco (Invesco S&P 500 Equal Weight ETF). Unlike market-cap-weighted ETFs like VOO, RSP adopts an equal-weight strategy, where each of the 500 companies in the S&P 500 accounts for approximately 0.2%. This reduces the concentration risk from large technology stocks and gives it a tilt toward mid-cap characteristics. It may perform better under certain market conditions, but its management fee (around 0.20%) is relatively higher.
Conclusion
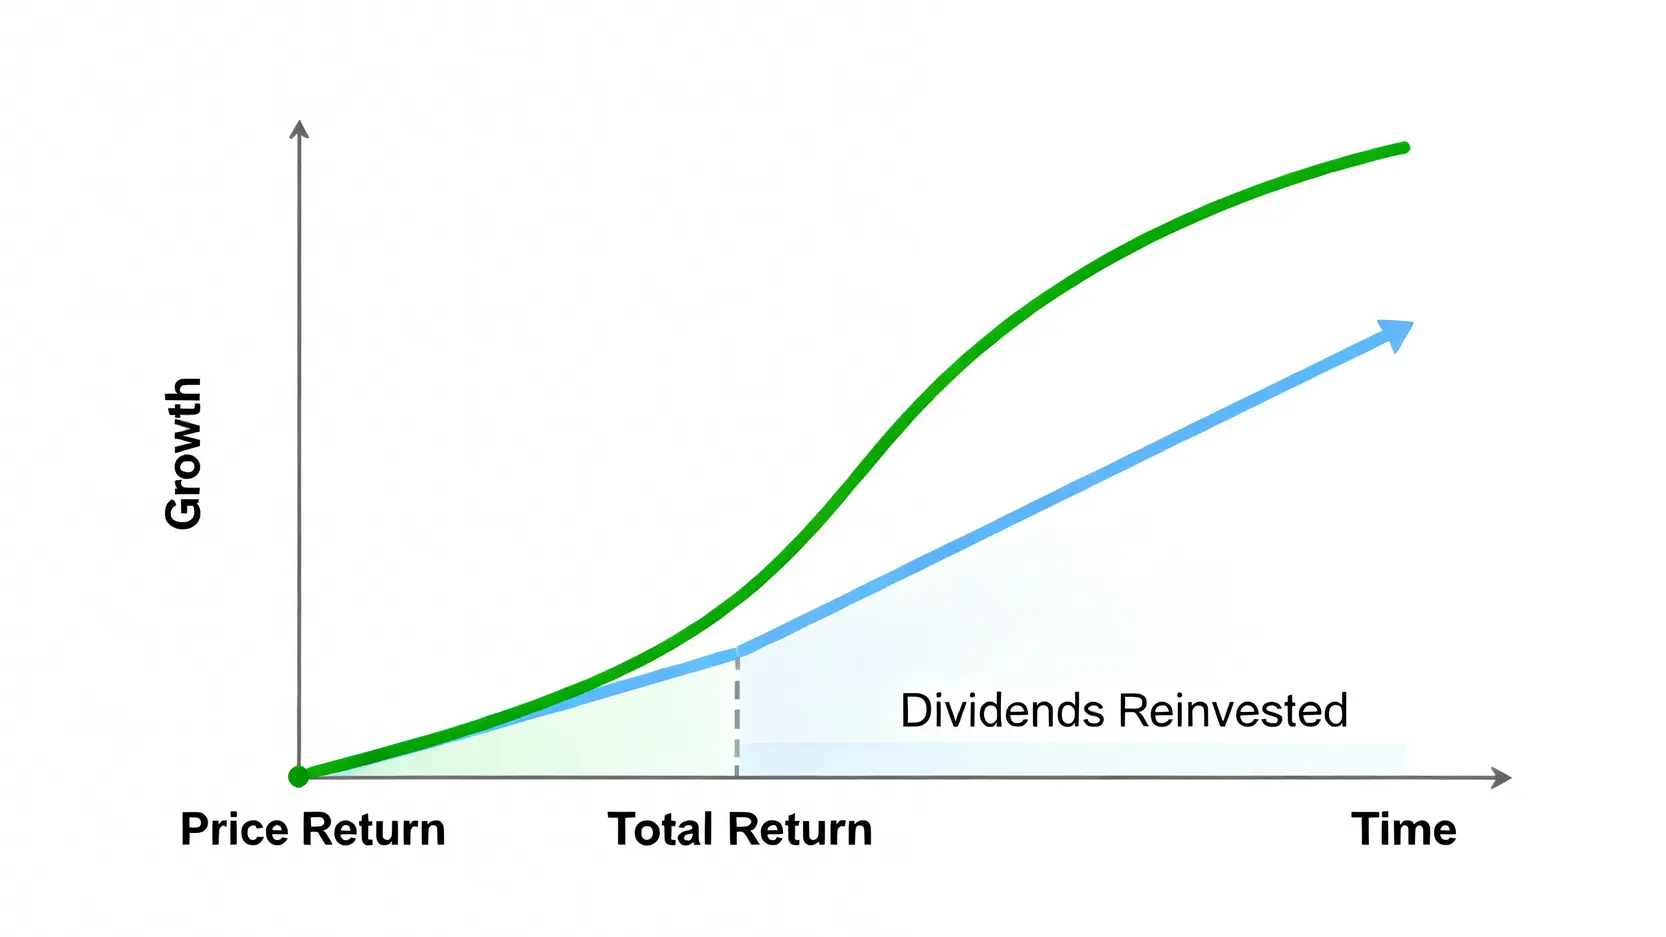
In summary, long-term holding and focusing on the annualized return of the S&P 500 is an effective strategy for achieving asset growth. Historical data clearly shows that despite short-term market fluctuations, the S&P 500 index return rate remains stable over the long term and serves as a powerful tool to hedge against inflation and accumulate wealth. By choosing low-cost and efficient US stock ETFs such as VOO or IVV, any investor can easily participate in the growth of leading US companies. Understanding macroeconomic factors and valuation levels can help you navigate your investment journey more steadily. Start planning your portfolio now and make the S&P 500 a strong partner in achieving your financial goals.
Related Articles
-
Practical Applications of Volatility Surfaces: From Options Modeling to Advanced Skew Trading Strategies In options markets, implied volatility is never a flat line. Instead, it forms complex "smile" or "skew" surfaces. For advanced traders, mastering the practical applications of volatility surfaces is equivalent to possessing a lens that reveals market...2026 年 6 月 3 日
-
Building a Foreign Capital Flow Copy Trading Model: A Stock Market Indicator for Accurately Tracking Institutional Positioning In Asia-Pacific stock markets, foreign capital inflows and outflows often determine the direction of the index. However, simply looking at daily net buy and sell data is no longer enough. Only by building...2026 年 6 月 3 日
-
Options Buyer Strategies During Extreme Market Conditions: Black Swan Hedging and Cross-Market Arbitrage During Volatility Surges The most terrifying aspect of financial markets is not a gradual decline, but overnight flash crashes and cross-market capital withdrawals accompanied by volatility surges. In the highly unpredictable global macroeconomic environment of 2026, geopolitical...2026 年 6 月 3 日


