What Is the S&P 500? Beginner Guide to ETFs & Buying

Updated: 2026/02/12  |  CashbackIsland

S&P500是什麼?新手投資指南:搞懂成分股、ETF與怎麼買

What Is the S&P 500? A Beginner’s Investment Guide: Understanding Constituents, ETFs, and How to Buy

Want to ride the growth train of US equities but do not know where to start? You have probably heard of the S&P 500 index, which Warren Buffett has publicly recommended many times. But what exactly is the S&P 500? Why is it regarded as the best benchmark for measuring the overall performance of the US market? For beginners, buying individual stocks directly can carry too much risk. By investing through ETFs that track the S&P 500, you can gain exposure to 500 of the most representative leading US companies in one go and enjoy the benefits of market growth. This complete introduction to the S&P 500 will take you from zero, helping you fully understand what the S&P 500 is, its massive influence, and most importantly, how to invest in it easily through ETFs, so you can take your first steady step into US stock investing. 


What Is the S&P 500? A Complete Guide to Its Definition and Historical Evolution

The S&P 500, formally known as the “Standard & Poor’s 500 Index” (Standard & Poor’s 500 Index), is one of the most closely watched stock market indices in the world. It is not only a key benchmark for measuring the performance of the US large-cap stock market, but also an important barometer of the health of the US economy.


The Basic Definition of the S&P 500: More Than Just a Number

The S&P 500 index is maintained by “S&P Dow Jones Indices” and includes 500 of the most representative large-cap companies listed on the two major US exchanges (the New York Stock Exchange and Nasdaq). The index is calculated using a “market capitalization-weighted” method, meaning the larger a company’s size (market cap), the greater the impact its stock price movements have on the index. Therefore, when you see the S&P 500 index rise, it often indicates that giants such as Apple and Microsoft are performing strongly, driving the broader market higher. Simply put, investing in the S&P 500 is equivalent to investing in a reflection of the US economy.

一張解釋市值加權概念的示意圖,顯示大型公司如蘋果和微軟對S&P 500指數的影響遠大於眾多小型公司。

Market capitalization weighting: the larger the company, the greater its influence on the index.


The History of the S&P 500: How Did It Become a Barometer of the US Stock Market?

The history of the S&P 500 index can be traced back to March 4, 1957, when it was officially launched in its current form, replacing the original S&P 90 index to become a more comprehensive market benchmark. Since then, it has witnessed decades of shifts and transformations in the US economy, from the industrial era to the technology era, and has gone through multiple recessions and bull markets. Thanks to its broad representativeness and transparent methodology, the S&P 500 soon surpassed the Dow Jones Industrial Average, which includes only 30 companies, becoming the primary benchmark for institutional investors, fund managers, and global investors to measure their investment performance. For more authoritative information about the index, you can refer to the S&P Global official website

Which Companies Are Included in the S&P 500? Understanding the Full Picture of the US Economy Through Constituents

To truly understand the value of the S&P 500, you must understand its constituent selection mechanism and sector distribution. These 500 companies are not chosen at random, but selected through a strict set of criteria to ensure the index accurately reflects the pulse of the US economy.


S&P 500 Selection Criteria: Strict Requirements to Become a Constituent

For a company to be included in the S&P 500 index, it must meet multiple stringent requirements, mainly including:

  • Market capitalization requirement: Must be a large-cap stock, with market capitalization meeting the minimum threshold set by the index committee (this threshold is adjusted based on market conditions and is usually above US$10 billion).
  • Liquidity: The stock must be easy to trade and actively traded, ensuring the index is investable.
  • Profitability: The company’s most recent quarterly earnings must be positive, and the sum of earnings over the past four quarters must also be positive.
  • Public float: At least 50% of shares must be available for public trading.
  • Headquarters location: Must be a US company.

This mechanism ensures the quality and representativeness of the index. Being added to or removed from the S&P 500 constituents is a major event for any company.


Analysis of the Top Ten Constituents and Sector Distribution

The top ten constituents of the S&P 500 are almost all globally renowned giants, and their combined weight typically accounts for 25% to 30% of the index. As of early 2026, the major members include (note: the list and weightings may change with market fluctuations):

  • Apple Inc.
  • Microsoft Corp.
  • Amazon.com, Inc.
  • NVIDIA Corp.
  • Alphabet Inc.
  • Tesla, Inc.
  • Meta Platforms (formerly Facebook)

From a sector distribution perspective, the Information Technology sector has long held the largest weighting, followed by Health Care, Financials, and Consumer Discretionary. This distribution clearly illustrates the current structure of the US economy, which is driven by technology and service industries. For investors looking to get started with US stocks, you may refer to this 2026 Complete Guide to US Stock CFD Trading: Platform Comparisons, Pros and Cons, and Beginner Tutorials to learn more foundational knowledge. 

Why Invest in the S&P 500? Three Key Advantages and Long-Term Return Analysis

Warren Buffett has advised at shareholder meetings that for most investors, the best choice is to buy a low-cost S&P 500 index fund. The reason behind this is that the S&P 500 offers several irreplaceable investment advantages.


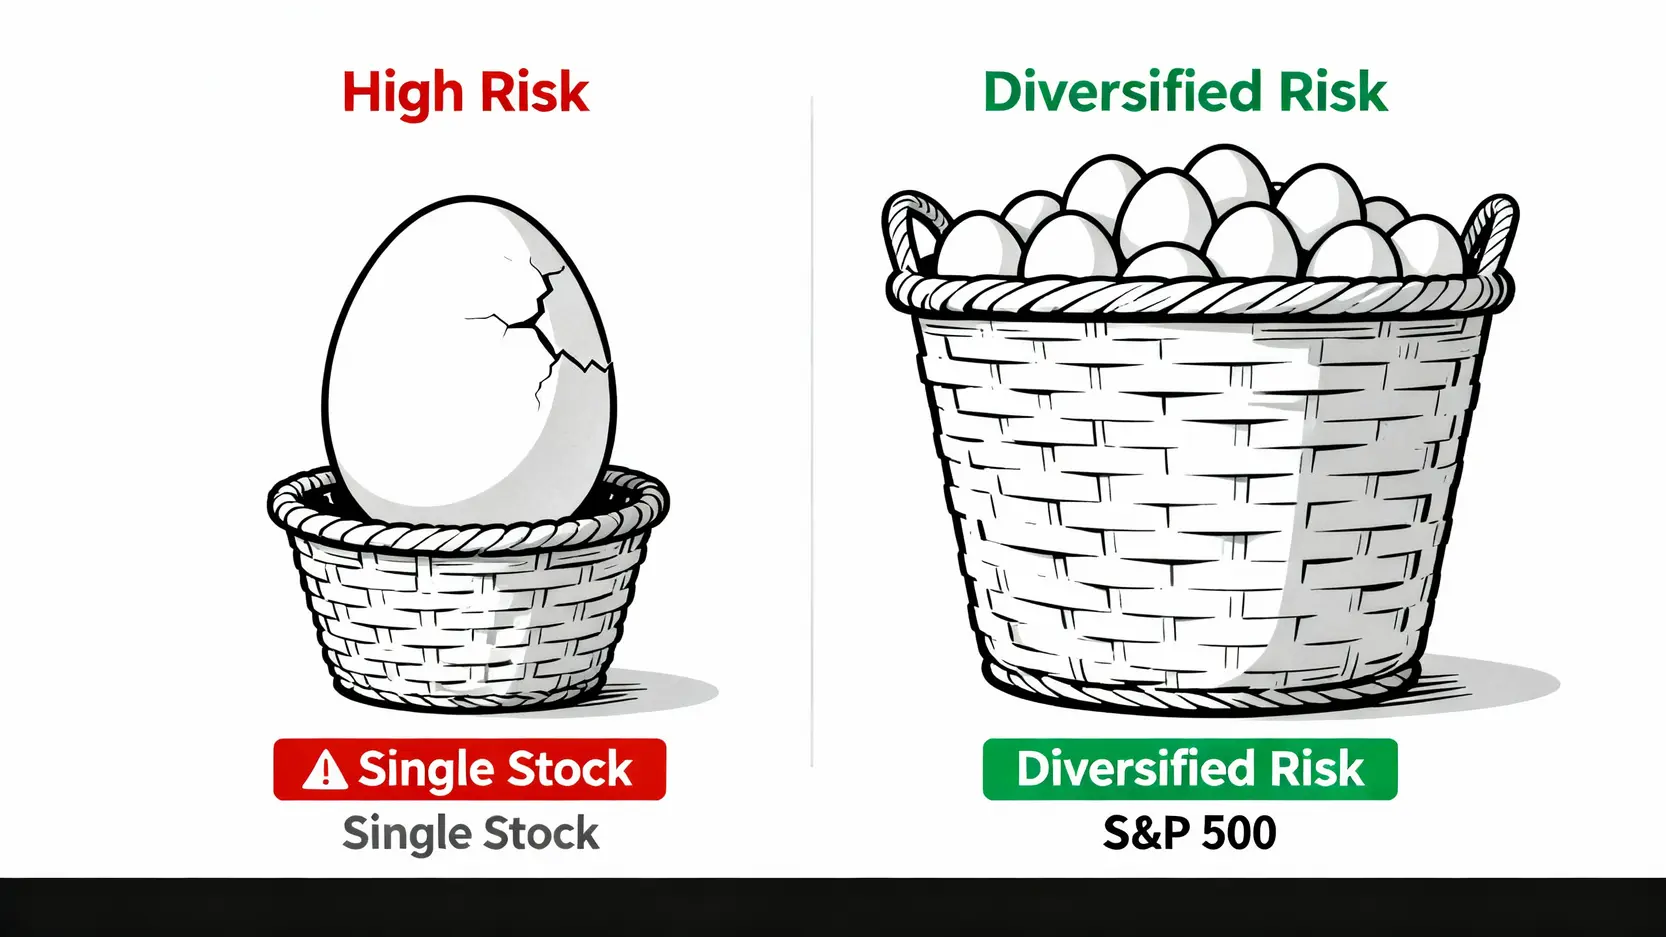
Advantage One: Risk Diversification by Gaining Exposure to Leading Companies in One Move

When you invest in a single company’s stock, a single “black swan” event could wipe out your investment. Investing in the S&P 500, however, is equivalent to diversifying your capital across 500 leading companies from different industries. Even if one company underperforms, the growth of others can effectively offset its negative impact. This built-in “risk diversification” mechanism is the cornerstone of prudent investing.

一張對比圖,顯示投資單一股票的高風險與投資S&P 500的分散風險區別。

Investing in the S&P 500 is like placing your eggs in 500 baskets, significantly reducing the risk arising from poor performance by any single company.


Advantage Two: Long-Term Stable Historical Returns

Although the market fluctuates in the short term, over the long run the US economy has consistently demonstrated strong growth resilience. Looking back over several decades of historical data, the S&P 500 index (including dividend reinvestment) has delivered an annualized return of approximately 10%. This means that if you can maintain a long-term holding strategy, the compounding effect can generate considerable asset growth potential. Of course, it must be emphasized that past performance does not represent future returns, but it does provide a rational reference for expectations. 

How to Invest in the S&P 500? Comparison of Three Popular ETFs and Buying Guide

For most investors, the simplest and most cost-effective way to invest in the S&P 500 is to purchase “index equity funds” (ETFs) that track the index. The objective of these ETFs is to replicate the performance of the S&P 500 index.


US Stock ETF Comparison: VOO vs. IVV vs. SPY

There are three of the most well-known and largest US stock ETFs that track the S&P 500 on the market, namely VOO, IVV, and SPY. Their tracking performance is very similar, but there are still differences in certain details.

Ticker Full Name Issuer Management Fee Key Features
SPY SPDR S&P 500 ETF Trust State Street 0.09% The longest track record, the largest size, and the most active trading volume, suitable for short-term traders.
IVV iShares CORE S&P 500 ETF BlackRock 0.03% An extremely low expense ratio, issued by the world’s largest asset management company, suitable for long-term holding.
VOO Vanguard S&P 500 ETF Vanguard 0.03% The same expense ratio as IVV, issued by Vanguard, a pioneer of index funds, and also a top choice for long-term investing.

For long-term investors, VOO and IVV are more cost-effective choices due to their extremely low expense ratios. If you want to gain a deeper understanding of how ETFs work, you can read this Crude Oil ETF Investment Guide: A Complete Guide to Oil Funds, Fees, and Popular ETF Recommendations. Although the underlying assets are different, the core concepts are the same.

VOO、IVV、SPY三檔S&P 500 ETF的比較圖,包含發行商、管理費用和適合對象。

Core Differences Among VOO, IVV, and SPY: Long-term investors should prioritize lower expense ratio options such as VOO or IVV.


Further Reading (Highly Recommended)

2026 Complete Guide to US Stock CFD Trading: Platform Comparisons, Pros and Cons, and Beginner Tutorials.

Crude Oil ETF Investment Guide: A Complete Guide to Oil Funds, Fees, and Popular ETF Recommendations 

Taiwan Stock ETFs: How to Buy an ETF in Taiwan That Tracks the S&P 500?

If you do not want to open an overseas brokerage account, you can also invest in Taiwan’s securities market through “sub-brokerage” services or by directly purchasing an ETF listed in Taiwan that tracks the S&P 500. The most well-known example is the Yuanta S&P 500 Umbrella Fund (00646). The advantage of buying directly on the Taiwan stock market is convenience and the ability to trade in Taiwan dollars. The downside is that management fees are usually higher than US-listed ETFs, and there may be some tracking error. 

Frequently Asked Questions (FAQ) About the S&P 500

Q: What Is the Difference Between the S&P 500 and the Dow Jones Index?

A: The biggest differences lie in the number of constituents and the calculation methodology. The S&P 500 includes 500 companies and uses a “market capitalization-weighted” approach, making it more representative of overall market conditions. The Dow Jones Industrial Average includes only 30 large blue-chip stocks and uses a “price-weighted” method, meaning higher-priced stocks have a disproportionately large impact on the index. As a result, most experts consider the S&P 500 to be a more representative market benchmark.

Q: Do S&P 500 ETFs Pay Dividends?

A: Yes. Companies included in the S&P 500 index pay dividends, and ETFs that track the index pool these dividends and distribute them to ETF holders in cash on a regular basis. The distribution frequency depends on each ETF’s rules and is usually quarterly.

Q: What Is the Approximate Annualized Return of the S&P 500?

A: Based on historical data, the S&P 500’s long-term annualized return (including dividend reinvestment) is approximately 10%. However, this is a long-term average. In any given year, the market may experience significant gains or losses. Investors should be mentally prepared for “long-term holding” in order to withstand short-term market volatility.

Q: Are the S&P 500 Constituents Fixed and Unchanging?

A: No. The index committee regularly reviews the constituent list (usually on a quarterly basis), removing companies that no longer meet the criteria (such as those that have been acquired, experienced a decline in market capitalization, or turned unprofitable) and adding new qualified companies. This “metabolism” mechanism ensures that the S&P 500 continues to represent the most dynamic and leading group of US companies.


Conclusion

In summary, the S&P 500 is not only an important indicator of the US economy, but also an excellent starting point for beginner investors entering the US stock market. Through a single investment vehicle, it offers unparalleled diversification and market representativeness, allowing investors to participate in the long-term growth of the US market at a very low cost. Through this comprehensive introduction to the S&P 500, you should now have a solid grasp of the core concepts and practical investment methods. Start your first S&P 500 investment now and take the first step toward steady wealth management.

If you liked this article, please share it!

Related Articles

  • Volatility Surface Guide: Skew Trading Strategies
    Practical Applications of Volatility Surfaces: From Options Modeling to Advanced Skew Trading Strategies In options markets, implied volatility is never a flat line. Instead, it forms complex "smile" or "skew" surfaces. For advanced traders, mastering the practical applications of volatility surfaces is equivalent to possessing a lens that reveals market...
    2026 年 6 月 3 日
  • Foreign Capital Flow Model: Track Institutional Money
    Building a Foreign Capital Flow Copy Trading Model: A Stock Market Indicator for Accurately Tracking Institutional Positioning In Asia-Pacific stock markets, foreign capital inflows and outflows often determine the direction of the index. However, simply looking at daily net buy and sell data is no longer enough. Only by building...
    2026 年 6 月 3 日
  • Options Buying Strategies for Extreme Market Risks
    Options Buyer Strategies During Extreme Market Conditions: Black Swan Hedging and Cross-Market Arbitrage During Volatility Surges The most terrifying aspect of financial markets is not a gradual decline, but overnight flash crashes and cross-market capital withdrawals accompanied by volatility surges. In the highly unpredictable global macroeconomic environment of 2026, geopolitical...
    2026 年 6 月 3 日
返回顶部