Stock Return Guide: Annual Return & HK Stock Rankings

Stock Return Calculation Guide: How to Calculate Average Annual Return for Individual Stocks? Includes Latest Hong Kong Stock Return Rankings
When investing in Hong Kong stocks, do you often feel unsure about whether your portfolio is actually making a profit or loss? Do you see others discussing average annual return of individual stocks but have no idea where to start? This article is written for you. We will begin with the core methods of stock return calculation, explain them in a simple and clear way, and combine them with the latest Hong Kong stock return rankings to help you understand your investment performance and make smarter decisions to identify the next potential stock.
Core Concepts: Understanding Two Key Stock Return Metrics
Before starting calculations, you must first understand two fundamental concepts: total return and annualized return. They measure investment performance from different perspectives, and both are essential.
Total Return: The Combination of Price Appreciation and Dividend Income
Total return measures how much an investment has generated in total over a specific period. It includes not only stock price appreciation (capital gains) but also all dividends received during the holding period. This is especially important for Hong Kong stocks, where many blue-chip companies offer substantial dividends.
- Capital Gain: profit from buying low and selling high.
- Dividend Income: cash distributed to shareholders from company profits.
The formula is straightforward:
Total Return = (Ending Value – Initial Cost + Dividend Income) / Initial Cost
For example, if you buy a stock at HK$100, sell it at HK$110 after one year, and receive HK$5 in dividends, your total return is:
(110 – 100 + 5) / 100 = 15 / 100 = 15%
This 15% clearly reflects all gains from the investment.
Annualized Return: How to Fairly Compare Investments with Different Time Periods?
While total return is useful, it has a limitation: it cannot fairly compare investments with different holding periods. For example, if Investment A earns 10% in 6 months and Investment B earns 12% in 2 years, which performs better?
At this point, “annualized return” comes into play. It converts investment returns over different periods into an “average annual” return, allowing you to compare them on the same basis. To learn more about annualized return, you can refer to this article What Is the S&P 500? A Beginner’s Investment Guide, which includes further discussion on long-term returns.
The calculation formula is slightly more complex:
Annualized Return = ((1 + Total Return) ^ (1 / Holding Period)) – 1
Continuing with the example above, assume Investment A earns 10% in half a year (0.5 years), its annualized return is:
((1 + 0.10) ^ (1 / 0.5)) – 1 = (1.1 ^ 2) – 1 = 1.21 – 1 = 21%
While Investment B earns 12% over 2 years, its annualized return is:
((1 + 0.12) ^ (1 / 2)) – 1 = 1.0583 – 1 = 5.83%
It is clear at a glance that Investment A’s annual performance far exceeds that of Investment B. This is the power of annualized return. It is the gold standard for evaluating long-term investment performance and fund performance.

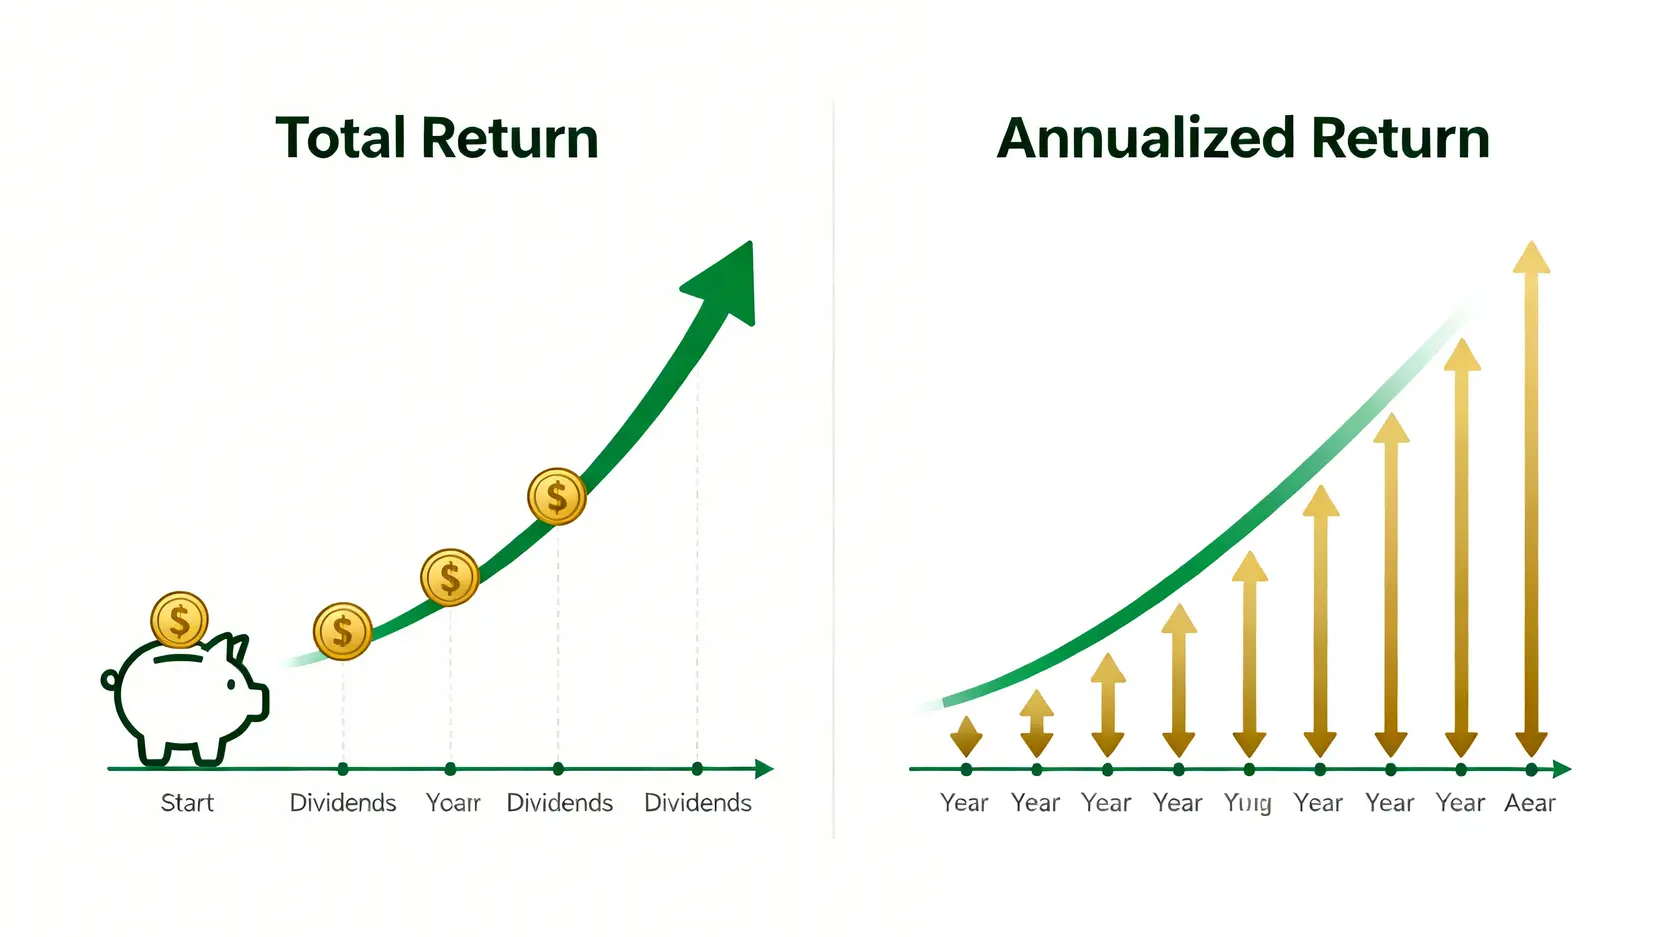
Total return shows the “overall result”, while annualized return shows the “average yearly performance”. Only by combining both can you fully evaluate an investment.
Step-by-Step Guide: Practical Methods for Calculating Stock Returns
Once you understand the theory, the next step is practical application. Calculating stock returns does not necessarily require complex software. Sometimes simple tools or even pen and paper are sufficient.
Manual Calculation: Simple Formula Made Easy (With Example)
Let us use a familiar Hong Kong stock, HSBC Holdings (0005.HK), as an example to calculate returns step by step.
Scenario Assumptions:
- Purchase date: January 2, 2024
- Purchase price: HK$62.5
- Selling date: January 2, 2026
- Selling price: HK$75.0
- Holding period: 2 years
- Total dividends during the period: assumed HK$6.0 (for illustration purposes)
Calculation Steps:
- Calculate total return:
(75.0 – 62.5 + 6.0) / 62.5 = 18.5 / 62.5 = 29.6%
This indicates that over the two-year holding period, the total return of this investment is 29.6%. - Calculate annualized return:
((1 + 0.296) ^ (1 / 2)) – 1 = (1.296 ^ 0.5) – 1 = 1.1384 – 1 = 13.84%
This means the average annual return of this stock investment is approximately 13.84%.
With these two figures, you can comprehensively evaluate the performance of this trade.
Make Good Use of Tools: Excel and Broker App Automatic Calculations
If you find manual calculation too tedious, especially when managing multiple stocks in a portfolio, using tools is a more efficient choice.
- Excel/Google Sheets: You can create a simple table to record the buy and sell dates, prices, dividends, and other details of each transaction. By using the XIRR function, inputting cash flows (purchases as negative, sales and dividends as positive) along with corresponding dates, you can calculate precise annualized returns with one click. This is especially suitable for managing complex investment portfolios.
- Broker Apps: Most modern brokerage apps come with built-in return calculation features. They automatically track your cost basis, market value changes, and calculate daily, monthly, and yearly returns, as well as total return since inception. This is the most convenient and direct method. Remember to review it regularly to understand your investment performance.
Further Reading (Highly Recommended)
2026 Hong Kong Stock Return Rankings: Which Stocks Are Worth Watching?
After learning how to calculate returns, the next step is to apply this knowledge to identify quality investment targets. When analyzing Hong Kong stock return rankings, do not focus solely on short-term performance. You should also consider the company’s fundamentals and future prospects.
High-Dividend Blue Chips: A Stable Income Choice
For investors seeking stable cash flow, high-dividend blue-chip stocks are often the preferred core allocation. These companies typically have mature businesses, stable profitability, and a willingness to return a large portion of profits to shareholders in the form of dividends. When analyzing such stocks, total return is a key metric, as dividends account for a significant portion of the return.
Sectors and examples worth paying attention to:
| Sectors | Stock Examples | Characteristics |
| Financials (Banking) | HSBC Holdings (0005), Bank of China (Hong Kong) (2388) | Stable business operations, generally higher dividend yields, influenced by the interest rate environment |
| Utilities | CLP Holdings (0002), Hong Kong and China Gas (0003) | Defensive nature, stable earnings and dividends, considered traditional income stocks |
| Telecommunication Services | China Mobile (0941) | Strong cash flow, generous dividend policies, affected by industry competition |
To learn more about how to select and build a high-dividend stock portfolio, you can read this curated list of 15 Hong Kong high-dividend blue-chip stock recommendations to obtain a more detailed list and analysis.
High-Growth Potential Stocks: Finding the Next Market Focus
Another category worth paying attention to is high-growth potential stocks. These companies may pay very little or even no dividends, as they reinvest their profits into business expansion. For such stocks, investors primarily seek capital gains driven by rapid share price growth. When evaluating them, the focus should be on their future earnings growth potential, industry trends, and market share.
Potential high-growth sectors:
- Technology innovation: Leading companies in fields such as artificial intelligence, cloud computing, and semiconductors.
- New energy and environmental protection: Companies related to the electric vehicle supply chain, renewable energy, and environmental technologies.
- Biotechnology: Biotech companies with core patents and innovative drugs.
Investing in such stocks carries relatively higher risk, and returns tend to be more volatile, but if market trends are accurately captured, the average annual return of individual stocks may far exceed the market average.
A Guide to Avoid Pitfalls: How to Identify the Trap of “Earning Dividends but Losing Principal”
When reviewing Hong Kong stock return rankings, avoid being misled by extremely high “dividend yields”. Sometimes, a sharp decline in a company’s share price can cause its dividend yield to rise passively, which is a typical “value trap” or “dividend trap”. If investors buy solely based on high dividends, they may end up earning some dividends but losing even more from the decline in share price, making it not worthwhile.

Beware of the “dividend trap”: earning dividends while losing on the share price ultimately results in a net loss.
Several key points to identify traps:
- Check the payout ratio: If a company distributes more than 100% of its earnings as dividends, it is likely unsustainable.
- Analyze earnings stability: Review the company’s earnings records over the past few years. If earnings are consistently declining, its future dividend-paying ability is questionable.
- Understand the reason for the share price decline: Is it due to market panic causing a mispricing, or are there serious issues with the company’s fundamentals? The latter must be avoided.
A healthy dividend-paying stock should be built on a foundation of consistently growing earnings, rather than relying on asset sales or borrowing to maintain high dividend payouts.
FAQ: Common Questions About Stock Returns
Q: What is a reasonable average annual return for an individual stock?
A: There is no absolute standard answer, as it depends on multiple factors, including the industry the stock belongs to, the company’s growth stage, and the overall macroeconomic environment. Generally, a long-term, stable average annual return that consistently exceeds the market index (such as the long-term average return of the Hang Seng Index) is considered quite good. For high-risk growth stocks, investors may expect higher returns (for example, above 15%), while for stable blue-chip stocks, 8%-12% may already be a reasonable expectation.
Q: Does a high dividend yield mean a high total return?
A: Not at all. Dividend yield is only one component of total return. Total return = share price change + dividend return. If a stock offers an 8% dividend yield but its share price falls by 20% within a year, your total return is actually -12%. Therefore, dividend yield alone should never be the sole basis for investment decisions. It must be evaluated together with the company’s fundamentals and share price trends.
Q: Where can I find the most reliable Hong Kong stock return ranking data?
A: To obtain reliable data, it is recommended to cross-verify through multiple authoritative sources. Major financial information websites (such as Bloomberg and Reuters), mainstream financial media, and research reports from major brokerages are all good sources. If you want to check the most original and official company dividend history records, you can visit the Hong Kong Exchanges and Clearing “HKEXnews” website, where all official announcements of listed companies are published, and the information is the most accurate.
Q: Should transaction costs be considered when calculating returns?
A: Absolutely. To calculate the most accurate net return, you must deduct all transaction costs, including brokerage commissions, stamp duty, transaction levies, etc. Although these costs may seem small per transaction, they will significantly affect your final returns when accumulated over the long term. A prudent investor will incorporate transaction costs into the “initial cost” to calculate the true net return that is actually received.
Conclusion
In summary, mastering the calculation of stock returns is not only a tool for reviewing past investment performance, but also the foundation for making informed decisions in the future. By gaining a deep understanding of the differences between total return and annualized return, and learning how to calculate them manually or using tools, you can more accurately assess the true effectiveness of each investment. When referring to Hong Kong stock return rankings, be sure to combine them with fundamental analysis to avoid the trap of “earning dividends but losing principal”. Now, start applying the knowledge from this article to review your holdings and identify the next high-quality Hong Kong stock with strong return potential!
Related Articles
-
Practical Applications of Volatility Surfaces: From Options Modeling to Advanced Skew Trading Strategies In options markets, implied volatility is never a flat line. Instead, it forms complex "smile" or "skew" surfaces. For advanced traders, mastering the practical applications of volatility surfaces is equivalent to possessing a lens that reveals market...2026 年 6 月 3 日
-
Building a Foreign Capital Flow Copy Trading Model: A Stock Market Indicator for Accurately Tracking Institutional Positioning In Asia-Pacific stock markets, foreign capital inflows and outflows often determine the direction of the index. However, simply looking at daily net buy and sell data is no longer enough. Only by building...2026 年 6 月 3 日
-
Options Buyer Strategies During Extreme Market Conditions: Black Swan Hedging and Cross-Market Arbitrage During Volatility Surges The most terrifying aspect of financial markets is not a gradual decline, but overnight flash crashes and cross-market capital withdrawals accompanied by volatility surges. In the highly unpredictable global macroeconomic environment of 2026, geopolitical...2026 年 6 月 3 日


