Short Volatility Guide: VIX Futures & Trade Timing

Updated: 2026/05/13  |  CashbackIsland

short-volatility-vix-futures-guide

The Ultimate Guide to Short Volatility Strategies: VIX Futures Trading and the Best Timing for Short Volatility Trades

Sharp market fluctuations always make investors uneasy, but have you ever considered that “volatility” itself can become a profit opportunity? Many professional traders use “Short Volatility strategies” to capture time value during relatively calm market periods. The core idea behind this strategy is that when market volatility declines, the value of related derivatives also decreases, allowing traders to profit from the price difference. This article will provide a deep breakdown of the core concepts behind Short Volatility, using the most important instrument, VIX futures trading, as an example to show you how to identify the right timing for executing Short Volatility trades, as well as how to effectively manage the potentially massive risks involved. 


What Is a Short Volatility Strategy?

At its core, a Short Volatility strategy is a trading approach that bets against market volatility. Traders executing this strategy do not profit from predicting whether the market will rise or fall, but rather from anticipating that future market volatility will “decrease” or “remain at low levels”. When markets transition from violent swings back to calm conditions, these strategies tend to perform exceptionally well.


Core Concept: Why “Short” Market Volatility?

Imagine you are an insurance company. During calm and peaceful periods, you continuously collect premiums and accumulate profits. However, one sudden hurricane can result in massive claim payouts. Shorting volatility is somewhat similar to “selling insurance”.

  • Collecting Time Value (Theta): The value of derivatives such as options or futures naturally declines over time, and this component is known as “time value”. Traders who short volatility earn profits much like insurance companies collecting premiums, capturing this time value that erodes day by day. As long as the market does not experience violent fluctuations (a hurricane), these “premiums” can be collected steadily.
  • Mean Reversion in Volatility: Market volatility typically exhibits a “mean reversion” characteristic. This means that extreme fear (high volatility) or extreme calmness (low volatility) usually does not last forever and eventually returns toward a historical average level. Therefore, when volatility surges to historically high levels, shorting volatility is essentially a bet that the market will eventually “calm down”.


Analysis of Potential Profit and Inherent Risks

There is no free lunch in the market. The profit and risk profile of Short Volatility strategies is highly asymmetrical, which is exactly what makes them both attractive and dangerous.

Potential Profit:

  • Relatively Stable Returns: During stable market conditions or periods of declining volatility, the strategy can generate consistent and predictable returns, similar to a cash flow stream.
  • Higher Probability of Success: Most of the time, markets remain relatively calm or experience declining volatility trends, meaning the statistical success rate of the strategy is relatively high.

Inherent Risks:

  • Unlimited Loss Potential: This is the most dangerous risk of the strategy. In theory, there is no upper limit to market panic, and the VIX Index can surge to extremely high levels. Once a black swan event occurs (such as a financial crisis or pandemic outbreak), volatility can spike dramatically, causing potentially unlimited losses for short volatility traders.
  • Limited Profit: In contrast to the unlimited risk, the maximum profit from a single trade is fixed, equal to the initial “premium” or spread collected.
  • Extreme Psychological Pressure: When the market moves unfavorably, losses can expand rapidly, placing tremendous emotional pressure on traders.

沽空波幅策略的風險與回報不對稱示意圖,左邊是撿拾少量金幣代表有限利潤,右邊是巨大的壓路機代表無限風險。

The Risk and Reward Structure of a Short Volatility Strategy: “Picking Up Pennies in Front of a Steamroller”.


Further Reading (Highly Recommended)

Futures Account Opening Requirements Guide: Understand Personal Account Applications, Required Documents, and Entry Thresholds in 10 Minutes


Core Tools: Understanding the VIX Index and VIX Futures Trading

To execute a Short Volatility strategy, you must first understand its two most important tools and indicators: the VIX Index and VIX futures. These are the key instruments used to measure and trade market volatility.


How Does the VIX Index (Fear Index) Reflect Market Expectations?

The VIX Index, formally known as the Chicago Board Options Exchange Volatility Index (CBOE Volatility Index), is commonly referred to as the “Fear Index”. It does not measure “current” market volatility, but instead reflects market participants’ “expectations” of S&P 500 volatility over the next 30 days.

  • Rising VIX: Indicates that the market expects significant stock market turbulence over the next 30 days, with investor sentiment leaning toward fear. It generally moves inversely to the stock market.
  • Falling VIX: Indicates that the market expects calmer conditions ahead, with investor sentiment becoming more optimistic or neutral.

Importantly, the VIX Index itself is only an index and cannot be traded directly. To trade VIX, investors must use its derivative products, with VIX futures being the most direct and widely used instrument.

VIX 恐慌指數與股市關係的蹺蹺板示意圖,熊市與高 VIX 在蹺蹺板一端升起,牛市與平穩市場在另一端降下,展示兩者反向關係。

The VIX Fear Index Typically Moves Inversely to the Stock Market.


VIX Futures Contract Overview: Symbol, Margin, and Trading Hours

VIX futures are standardized contracts traded on the Chicago Board Options Exchange (CBOE), allowing traders to speculate on or hedge against the future price of the VIX Index. Below are the basic contract specifications:

Item

Specification

Exchange Chicago Board Options Exchange Futures Exchange (CFE)
Contract Symbol VX
Contract Value VIX Index x US$1,000
Minimum Tick Size 0.05 Points (Value: US$50)
Trading Hours Nearly 24-Hour Trading (Please refer to the exchange announcement for specific trading hours)
Official Information CBOE VIX Futures Contract Specifications


How to Execute an Actual VIX Futures Trade Through a Futures Account?

The process of trading VIX futures is similar to trading other commodity futures. The main steps are as follows:

  1. Open a futures account that supports global futures trading: First, you need to choose a reputable broker that offers access to CBOE products and open a futures account.
  2. Deposit margin: Futures trading operates on a margin system. To short one VIX futures contract, you do not need to pay the full contract value. You only need to deposit the “initial margin” required by the exchange into your account.
  3. Place a short-selling order: In the trading platform, select the VIX futures contract month you wish to trade (for example, the December 2024 contract), then place a “Sell to Open” order.
  4. Monitor and close the position: If the VIX futures price declines as expected, you can place a “Buy to Close” order at any time to lock in profits. Conversely, if the price rises, you should consider stopping your losses.


The Key to Success: Identifying the Best Timing for Short Volatility Trades

Choosing the right entry timing is the core factor behind the success of a Short Volatility strategy. Blindly shorting volatility at any moment is no different from picking up coins on railway tracks, extremely dangerous. Below are three relatively ideal timing signals.


Signal 1: Anticipating a Pullback After the VIX Index Reaches Historical Highs

This is the most classic Short Volatility setup. When markets fall into extreme panic due to sudden major negative events (such as wars or financial crises), the VIX Index may surge to extreme levels of 40, 50, or even higher within a short period. Historical data shows that the VIX Index does not remain at such elevated levels for long and eventually returns toward its historical average near 20. Therefore, entering short positions while the VIX is at absolute high levels still carries substantial risk, but the probability of success and potential returns tend to improve when trading with the mean reversion trend.

VIX 指數均值回歸與最佳沽空時機示意圖,圖表顯示 VIX 指數從高點回落至歷史平均水平,高點處標示為理想的沽空進場點。

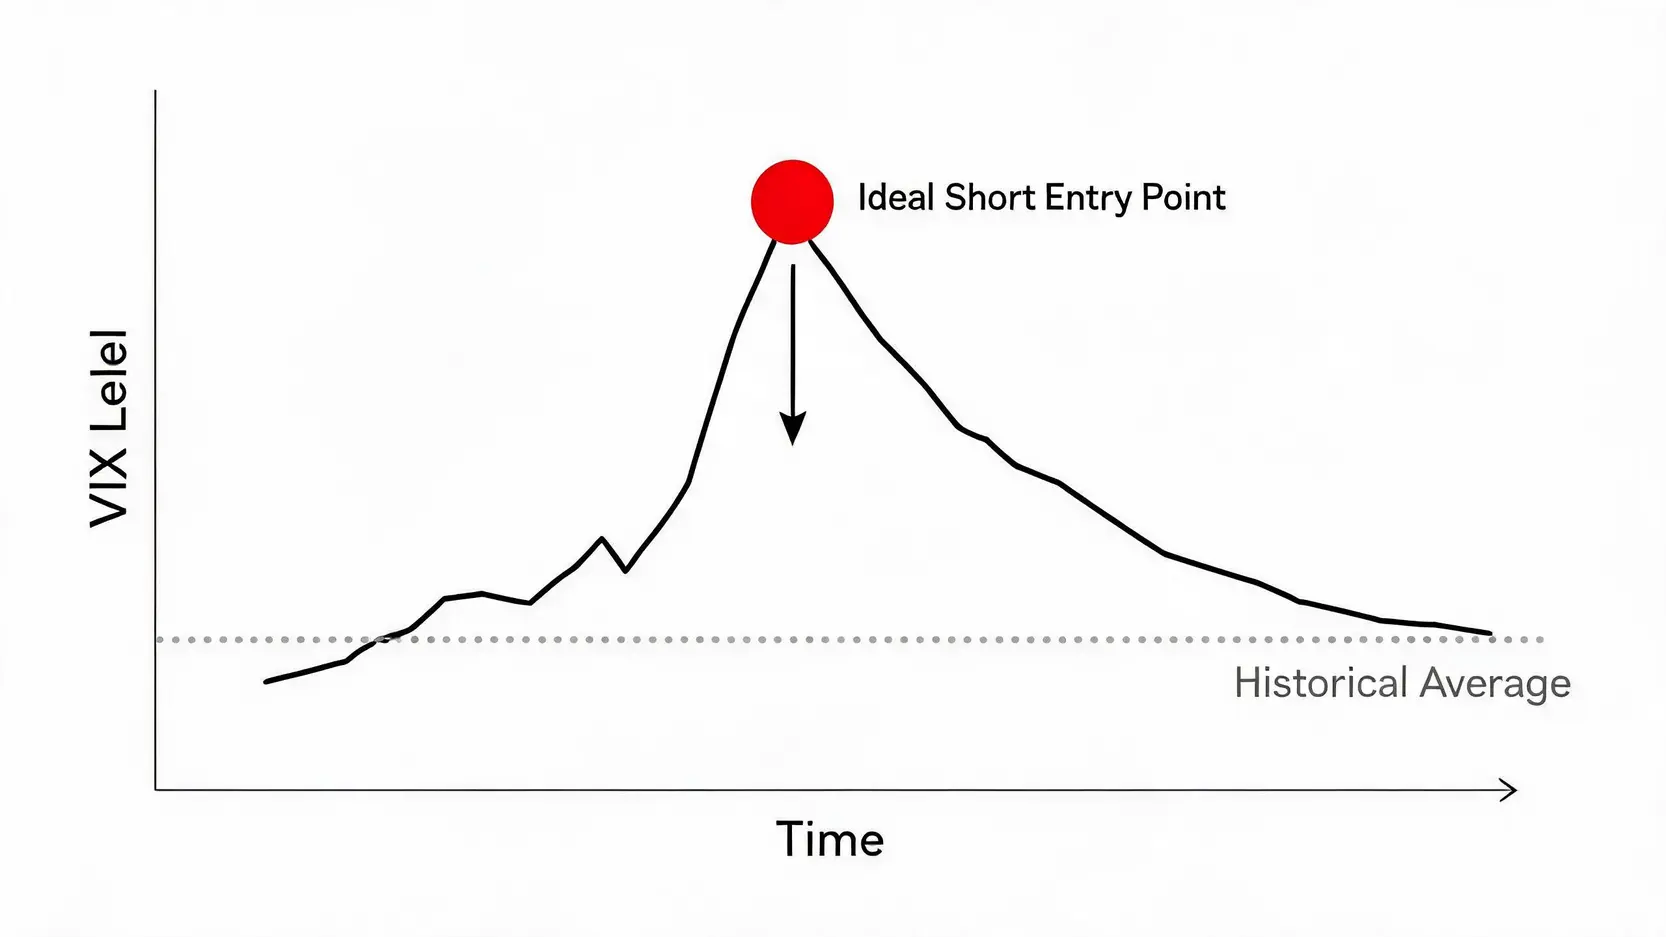
Use the “mean reversion” characteristic of the VIX Index to identify short-selling opportunities when the index reaches historical highs.


Signal 2: Market Expectations of a Stable Period Ahead (Such as After Major Events)

Markets dislike “uncertainty” the most. “Before” major events (such as US presidential elections, Federal Reserve interest rate meetings, or major economic data releases), markets tend to experience heightened hedging demand because participants cannot predict the outcome, pushing the VIX Index higher. However, once the event outcome becomes clear and uncertainty disappears, regardless of whether the result is positive or negative, markets usually stabilize and the VIX Index rapidly declines. Therefore, the period immediately “after” major announcements is often an ideal timing window for short volatility trades.


Technical Analysis: How to Use Chart Patterns to Support Decision-Making

Although VIX Index movements are mainly driven by market sentiment, technical analysis can still serve as a useful supporting tool:

  • Resistance and Support Levels: By studying historical VIX charts, traders can identify key resistance zones (for example, the 35-40 range) and support zones (for example, the 12-15 range). When the VIX reaches strong historical resistance areas, it may signal a potential short-selling opportunity.
  • Technical Indicator Divergence: For example, when the S&P 500 Index reaches new lows while the VIX Index fails to make new highs, this may form a “divergence” signal, suggesting that market panic could have peaked and may soon reverse.
  • Bollinger Bands: When the VIX price touches the upper Bollinger Band, it indicates that volatility has reached a relatively extreme level, increasing the probability of a short-term pullback.


Further Reading (Highly Recommended)

Futures Account Opening Requirements Guide: Understand Personal Account Applications, Required Documents, and Entry Thresholds in 10 Minutes


Common Short Volatility Strategies and Risk Management

In addition to directly shorting VIX futures, there are several other tools available in the market for executing Short Volatility strategies. At the same time, regardless of which instrument is used, strict risk management remains the only way to survive in the long run.


Strategy Applications: Short Straddle vs. Directly Shorting VIX Futures

These are the two most common methods for executing Short Volatility strategies, although their underlying logic differs slightly:

  • Directly Shorting VIX Futures: This is a “pure” volatility trade. Your profit and loss depend solely on the price movement of VIX futures themselves. You are betting that market expectations of “future” volatility will decline.
  • Short Straddle: This strategy involves simultaneously selling one Call option and one Put option with the “same expiration date and same strike price”. Your profit comes from the “actual” market remaining relatively stable, with the underlying asset trading within a narrow range around the strike price. It bets on low “realized” volatility rather than low “expected” volatility.

Overall, directly shorting VIX futures is more straightforward, while selling Short Straddles offers greater flexibility. However, both strategies face the risk of sudden spikes in volatility.


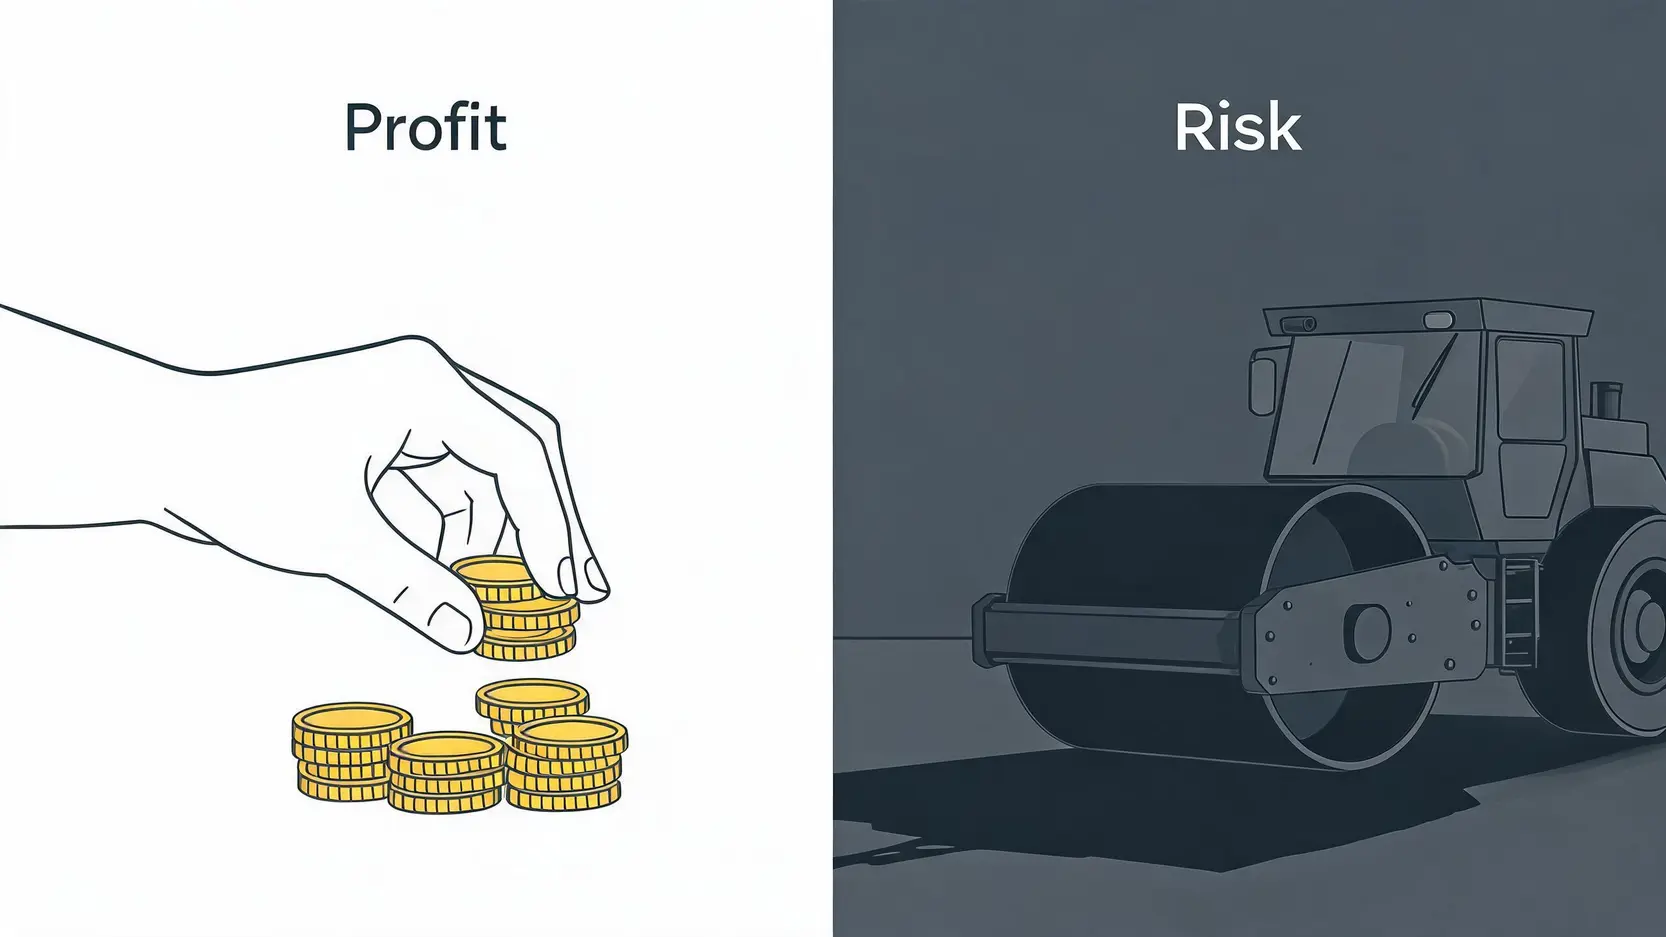
Risk Management: Why Is This Strategy Called “Picking Up Pennies in Front of a Steamroller”?

“Picking up pennies in front of a steamroller” is Wall Street’s most classic description of Short Volatility strategies. This metaphor vividly illustrates the risk/reward structure of the strategy:

  • Pennies: The profit from each successful trade is usually relatively small, like picking up coins one by one from the ground, requiring long-term accumulation.
  • Steamroller: The risk resembles an invisible steamroller that may suddenly approach at high speed at any moment. Most of the time nothing happens, but once it arrives, all the pennies previously collected (profits) can be wiped out instantly, and even your principal capital may be destroyed.

Understanding this metaphor is a mandatory lesson before engaging in any Short Volatility trade.


Practical Tips for Stop Losses and Capital Management

Since the risks are substantial, disciplined risk management is not optional, it is essential.

  1. Always Set Stop Losses: Before entering a trade, you must clearly define your stop-loss price or maximum acceptable loss amount. For example, if you short VIX futures at 20 points, you may set 25 points as your stop-loss exit level. You must never rely on the mindset of “waiting a little longer”.
  2. Trade With Small Position Sizes, Never Go All-In: The proportion of capital allocated to Short Volatility strategies should not represent too large a portion of your overall investment portfolio. A common recommendation is to keep it below 5%. This ensures that even in the event of extreme losses, your entire portfolio remains protected.
  3. Use Spread Strategies to Define Risk: For options traders, strategies with more controllable risk profiles can be considered, such as using a Bear Call Spread instead of directly selling Naked Calls. Although this limits maximum profit, it also caps maximum loss.
  4. Maintain Respect for the Market: Never believe that you can predict everything. Black swan events are called black swans precisely because they are unpredictable.


FAQ: Common Questions About Short Volatility Strategies

Q: Are Short Volatility strategies suitable for beginner investors?

A: Absolutely not. This strategy involves complex derivatives knowledge, a deep understanding of market sentiment, and extremely strict risk management discipline. Its highly asymmetrical risk/reward structure means that incorrect judgments or unexpected black swan events may result in losses far exceeding the original capital invested. Beginner investors should start by learning more basic investment instruments first.

Q: What is the difference between VIX futures and the VIX Index itself?

A: The most fundamental difference is that the VIX Index is an “index” measuring the market’s current expectation of volatility over the next 30 days. It is a calculated figure and cannot be traded directly. VIX futures, on the other hand, are “derivative financial contracts” based on the VIX Index, trading the market’s expectation of what the VIX Index will be at a specific “future point in time”. As a result, VIX futures prices are influenced by factors such as time value and market supply and demand. Their movements do not perfectly track the spot VIX Index, creating what is known as “basis”.

Q: How do black swan events affect Short Volatility strategies?

A: Catastrophically. Black swan events (such as the September 11 attacks, the 2008 global financial crisis, or the 2020 COVID-19 outbreak) are by definition extreme, rare, and unpredictable. These events can trigger explosive market panic within an extremely short period, causing the VIX Index to double or surge even higher within a single day. For Short Volatility positions, this means instant, massive, and potentially uncontrollable losses, enough to wipe out any account lacking proper risk management.


Conclusion

In summary, Short Volatility strategies represent a professional trading art with high risk and potentially high rewards. This is not traditional value investing or trend-following. Instead, it is a strategy that bets against market “sentiment” and “time”. The key to success lies not only in accurately identifying Short Volatility timing, but also in fully understanding the “picking up pennies in front of a steamroller” nature of the strategy, and building an iron-disciplined risk management system around that reality. Before committing real capital, you should practice extensively through a demo account and ensure that you fully understand every detail of VIX futures trading. This path is full of challenges, but for traders capable of mastering it, it also contains unique profit opportunities.

If you liked this article, please share it!

Related Articles

  • Volatility Surface Guide: Skew Trading Strategies
    Practical Applications of Volatility Surfaces: From Options Modeling to Advanced Skew Trading Strategies In options markets, implied volatility is never a flat line. Instead, it forms complex "smile" or "skew" surfaces. For advanced traders, mastering the practical applications of volatility surfaces is equivalent to possessing a lens that reveals market...
    2026 年 6 月 3 日
  • Foreign Capital Flow Model: Track Institutional Money
    Building a Foreign Capital Flow Copy Trading Model: A Stock Market Indicator for Accurately Tracking Institutional Positioning In Asia-Pacific stock markets, foreign capital inflows and outflows often determine the direction of the index. However, simply looking at daily net buy and sell data is no longer enough. Only by building...
    2026 年 6 月 3 日
  • Options Buying Strategies for Extreme Market Risks
    Options Buyer Strategies During Extreme Market Conditions: Black Swan Hedging and Cross-Market Arbitrage During Volatility Surges The most terrifying aspect of financial markets is not a gradual decline, but overnight flash crashes and cross-market capital withdrawals accompanied by volatility surges. In the highly unpredictable global macroeconomic environment of 2026, geopolitical...
    2026 年 6 月 3 日
返回顶部