RSI Indicator Guide: Formula, Settings & Signals

Updated: 2026/03/10  |  CashbackIsland

RSI指標終極指南:由RSI公式、計算方法到最佳參數設定,一篇掌握買賣訊號

The Ultimate RSI Indicator Guide: From the RSI Formula and Calculation Method to Optimal Parameter Settings, Master Buy and Sell Signals in One Article

Want to improve your investment win rate with technical indicators, yet always feel confused by complex RSI formulas and parameter settings? Not sure how to find the optimal RSI parameters, or puzzled by the RSI calculation method? This article starts from scratch, guiding you through an in-depth analysis of the RSI formula and teaching you how to set the most suitable parameters based on your personal trading style, so you can accurately capture overbought and oversold signals and significantly enhance the accuracy of your trading decisions.


What Is the RSI Indicator? Why It Is Key to Determining Market Strength

The Relative Strength Index (RSI), created by technical analysis master J. Welles Wilder Jr., is a momentum oscillator. Its core function is to measure the speed and magnitude of price changes in order to determine whether an asset is in an “Overbought” or “Oversold” condition. The RSI value ranges from 0 to 100 and is one of the most widely used technical indicators among traders worldwide.


The Core Concept of RSI: A Thermometer for Measuring the Strength of Buyers and Sellers

You can think of RSI as a market sentiment “thermometer”. It does not measure the absolute price level, but rather the relative strength between recent “upward momentum” and “downward momentum”. If upward momentum significantly outweighs downward momentum, the RSI value rises, indicating increasingly euphoric market sentiment. Conversely, if downward momentum dominates, the RSI value declines, reflecting increasingly pessimistic sentiment. Through this value, traders can gain insight into the true market momentum hidden behind price fluctuations.


How to Interpret RSI Values: The Basic Definition of Overbought (>70) vs. Oversold (<30)

The interpretation of RSI is intuitive and mainly revolves around two key ranges:

  • Overbought: When the RSI value is above 70, it is generally regarded as an overheated market. The asset price may have risen too much and too quickly, potential selling pressure may be building, and a pullback or reversal could occur at any time. This is a warning signal reminding traders to avoid chasing higher prices.
  • Oversold: When the RSI value falls below 30, it is generally interpreted as an overcooled market. The asset price may have declined too deeply, potential buying interest may begin to emerge, and a rebound or upward reversal may follow. This serves as a potential buying opportunity signal.

The range between 30 and 70 is considered neutral, indicating relatively balanced bullish and bearish forces. Remember that 70 and 30 are the most commonly used default values, but they are not absolute. We will later explore how to adjust them under different market conditions.

RSI指標的示意圖,顯示0至100的量表,並標示出30以下的超賣區、30-70的中性區,以及70以上的超買區。

The RSI indicator is like a thermometer of market sentiment, helping determine whether the market is overcooled (oversold) or overheated (overbought).


Complete Breakdown of the RSI Formula and Calculation Method (Step-by-Step)

To truly master RSI, understanding the calculation logic behind it is essential. Although modern charting software calculates it automatically, comprehending the RSI calculation method allows you to better understand each fluctuation of the indicator and make more precise judgments.


RSI Formula Explained: What Is RS and How Does It Affect the Final Reading?

The complete RSI formula is as follows:

RSI = 100 – [100 / (1 + RS)]

The core of this formula lies in “RS” (Relative Strength). The RS value is the ratio of the “average gain” to the “average loss” over a given period (typically 14 days).

RS = (Average Gain Over N Days) / (Average Loss Over N Days)

  • When the average gain is greater than the average loss, the RS value is greater than 1 and the RSI value will be above 50.
  • When the average loss is greater than the average gain, the RS value is less than 1 and the RSI value will be below 50.
  • If there are only gains and no losses over a period, the RS value approaches infinity and the RSI approaches 100.

In simple terms, the RS value directly reflects the relative strength of bulls and bears and is the core of the entire RSI indicator.


Step-by-Step Guide: Complete the RSI Calculation in Three Steps, Even Beginners Can Follow Easily

Using the most common 14-day RSI as an example, the calculation process can be simplified into the following three steps:

  1. Calculate the initial RS value:
    • Step 1A: Identify all upward movements over the past 14 days, sum the gains, and divide by 14 to obtain the “14-day average gain”.
    • Step 1B: Identify all downward movements over the past 14 days (sum the losses in absolute terms) and divide by 14 to obtain the “14-day average loss”.
    • Step 1C: Divide the “14-day average gain” by the “14-day average loss” to obtain the first RS value.
  2. Calculate subsequent RS values (smoothing method): Starting from day 15, to make the data smoother, a slightly different calculation method is used:
    • New Average Gain = [(Previous Day’s Average Gain) * 13 + Current Day’s Gain] / 14
    • New Average Loss = [(Previous Day’s Average Loss) * 13 + Current Day’s Loss] / 14
  3. (Note: If the current day is a loss, the gain for that day is 0. If the current day is a gain, the loss for that day is 0.)
  4. Substitute RS into the RSI formula: Insert each calculated RS value into RSI = 100 – [100 / (1 + RS)] to obtain the RSI value for that day.


Case Study: Calculating the 14-Day RSI Using Actual Stock Price Data

Suppose a stock has the following closing prices over 15 consecutive days. We will calculate the RSI values for day 14 and day 15:

Number of Days Closing Price Gain/Loss Upward Points Downward Points
1 50.0
2 51.0 +1.0 1.0 0
14 55.0 -0.5 0 0.5

Day 14 (Initial Calculation):

  • Assume that over the first 14 days, the cumulative gain is 10 points and the cumulative loss is 4 points.
  • Average Gain = 10 / 14 = 0.714
  • Average Loss = 4 / 14 = 0.286
  • RS = 0.714 / 0.286 = 2.5
  • RSI (14) = 100 – [100 / (1 + 2.5)] = 71.4

Day 15 (Smoothed Calculation):

Assume that on day 15 the stock price rises by 1.5 points (from 55.0 to 56.5).

  • New Average Gain = (0.714 * 13 + 1.5) / 14 = 0.77
  • New Average Loss = (0.286 * 13 + 0) / 14 = 0.265
  • New RS = 0.77 / 0.265 = 2.9
  • RSI (15) = 100 – [100 / (1 + 2.9)] = 74.4


The Art of RSI Parameter Settings: How to Find Your Optimal Parameters

After understanding the RSI formula, the next step is the crucial RSI parameter setting. There is no absolute standard answer to this step. Instead, it requires dynamic adjustment based on your trading style and market environment, which is precisely what distinguishes beginners from experienced traders. 

Why Is “14 Days” the Default Standard? Differences and Application Scenarios of Short and Long RSI Periods

Wilder originally proposed 14 days as the standard because this period (approximately three weeks), effectively balances sensitivity and stability and was suitable for medium-term swing trading at the time. However, different RSI periods produce very different effects:

  • Short-Period RSI (such as 6 or 9 days):
    Advantage: Highly sensitive to price changes and capable of quickly capturing short-term turning points.
    Disadvantage: Prone to noise and false signals, potentially leading to frequent erroneous trades in ranging markets.
    Application Scenario: Suitable for aggressive short-term traders engaging in day trading or rebound trades.
  • Long-Period RSI (such as 21 or 30 days):
    Advantage: Produces a smoother indicator line that filters out short-term market noise and focuses on capturing major medium- to long-term trends.
    Disadvantage: Signals appear later and may miss optimal entry and exit points.
    Application Scenario: Suitable for steady investors engaged in swing trading or trend-following strategies.

短天期RSI與長天期RSI的比較圖,短天期RSI靈敏但雜訊多,長天期RSI穩定但訊號延遲。

Different RSI periods each have their own advantages and disadvantages. Traders should select based on their trading style (whether short-term or long-term).


Short-Term Traders vs. Long-Term Investors: Distinct RSI Parameter Strategies

Your trading style determines how you should set RSI parameters. Below are strategic suggestions for two different styles:

For Short-Term Traders (Day Trader / Scalper):

  • Parameter Suggestion: Consider using a 5- or 9-period RSI.
  • Strategy: Utilize its high sensitivity to look for buying opportunities when RSI reaches the oversold zone (such as 20 or 30), and selling opportunities when it reaches the overbought zone (such as 70 or 80). However, it is essential to confirm signals with other indicators (such as volume or support and resistance levels) to avoid being misled by false signals.

For Long-Term Investors (Swing Trader / Position Trader):

  • Parameter Suggestion: Consider using a 21- or 30-period RSI.
  • Strategy: Do not focus excessively on short-term overbought or oversold signals. Instead, use RSI as a supplementary tool to assess the health of the long-term trend. For example, in an uptrend, as long as RSI remains steadily above 50, the bullish trend is still strong and there is no need to sell prematurely. Only when RSI falls below 50 or even 40 should you become cautious about a potential trend reversal.


How to Adjust Overbought and Oversold Levels (70/30 vs 80/20) to Adapt to Different Market Conditions?

In addition to adjusting the period, you can also modify the overbought and oversold thresholds to adapt to different levels of market volatility:

  • In a strong bull market or highly volatile market (such as cryptocurrencies): Prices may frequently break above 70, causing RSI to become “passivated” (remaining at elevated levels) for extended periods. In such cases, the overbought level can be raised to 80 and the oversold level lowered to 20. This helps filter out noise and generates signals only during extreme market sentiment, allowing better capture of pullback opportunities within a trend.
  • In a mild ranging market or low-volatility environment (such as certain large-cap blue-chip stocks): Prices may struggle to reach 70 or 30. In such cases, you may consider lowering the overbought level to 65 and raising the oversold level to 35 to increase the frequency of signals.

The process of identifying the optimal RSI parameters is itself a deep understanding of the market and an optimization of your own trading system. 

Further Reading (Highly Recommended)

MACD Indicator Guide | Understand Fast and Slow Lines, Histogram, Golden Cross, and Divergence in One Article!


Advanced RSI Applications: Four Practical Techniques to Improve Trading Win Rate

After mastering the basic RSI calculation and parameter settings, we can further explore several advanced RSI applications. These techniques allow you to identify more subtle market changes and position yourself in advance.


Technique One: Use the “Golden Cross” and “Death Cross” to Identify Trend Reversals

This technique requires setting two RSI lines with different periods, for example a short-term RSI (such as 9 RSI) and a long-term RSI (such as 21 RSI).

  • Golden Cross: When the short-term RSI line crosses above the long-term RSI line from below, it indicates strengthening short-term momentum and may lead the long-term trend to turn bullish, regarded as a potential buy signal.
  • Death Cross: When the short-term RSI line crosses below the long-term RSI line from above, it indicates weakening short-term momentum and may drag the long-term trend bearish, regarded as a potential sell or short signal.


Technique Two: Understand “RSI Divergence” to Anticipate Price Reversals

“Divergence” is one of the most powerful RSI signals, providing early warnings before price reversals. When price movement contradicts the RSI indicator movement, it is referred to as divergence.

  • Bullish Divergence: The price makes a “new low”, but the RSI does not follow with a new low and instead forms a higher low. This indicates that although price continues to decline, downward momentum is weakening, serving as a strong upward reversal signal.
  • Bearish Divergence: The price reaches a “new high”, but the RSI indicator does not follow with a new high and instead forms a lower high. This means that although the price is rising, the upward momentum is weakening, which is a strong signal of a potential downward reversal.

RSI看漲背離的示意圖。圖中顯示股價創下新低,但下方的RSI指標卻形成一個更高的低點,預示著潛在的價格反轉向上。

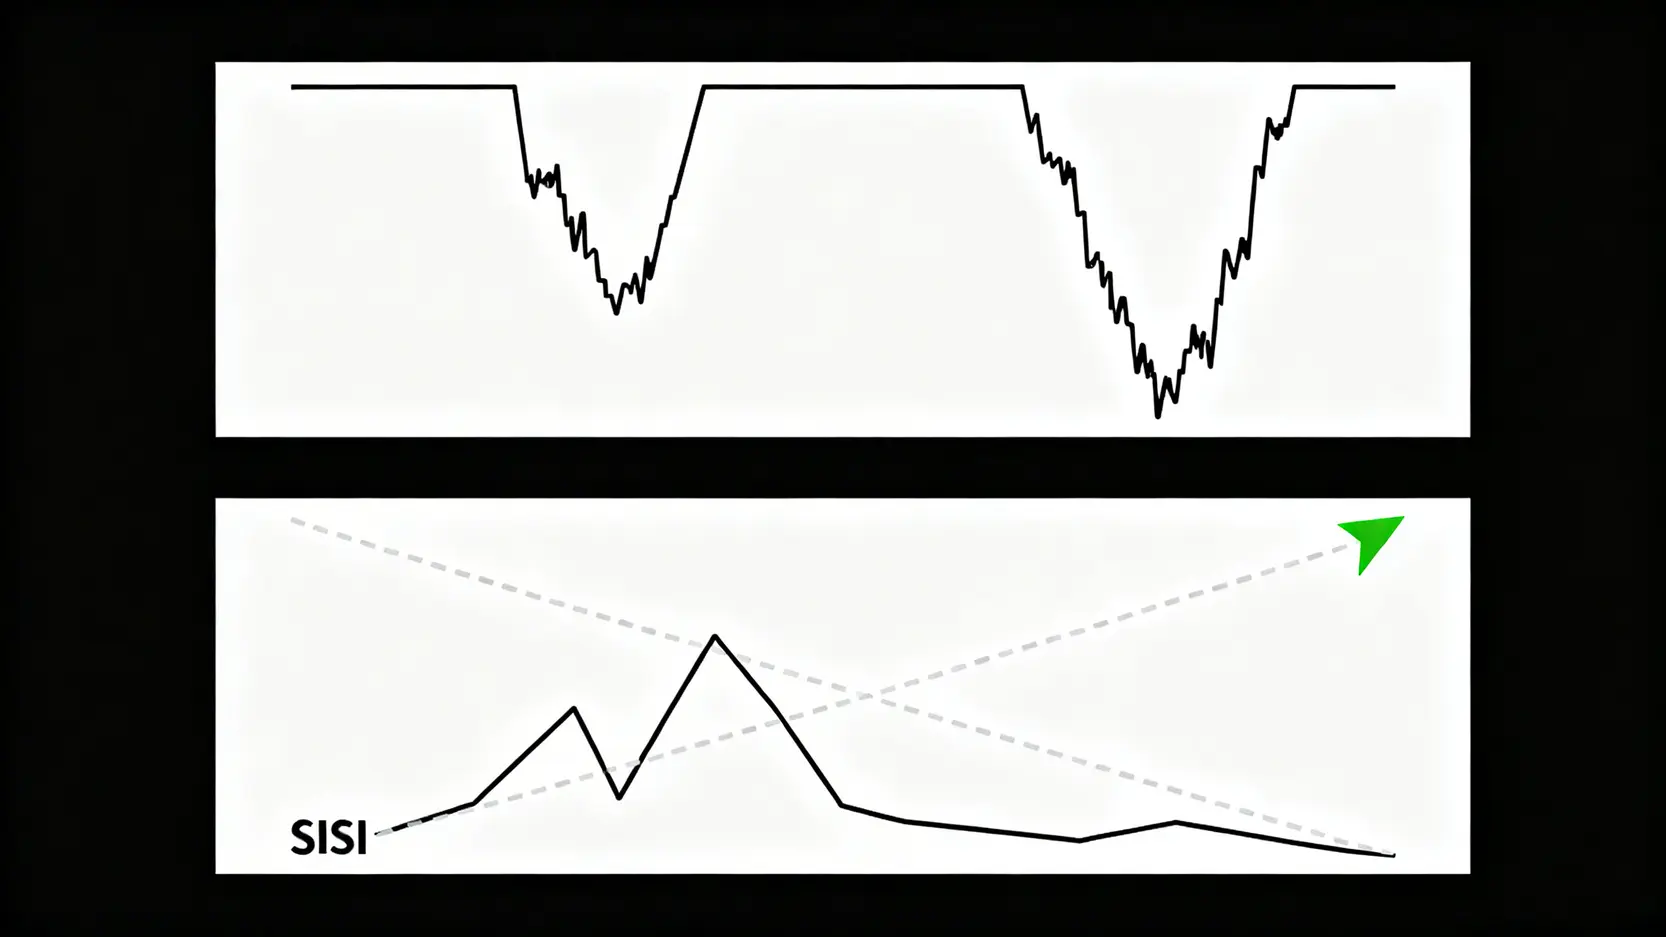
Bullish Divergence is a strong reversal signal: when price makes a new low but RSI does not follow, it indicates that downward momentum is weakening.


Technique Three: What Is RSI Passivation? How to Avoid Being Misled in Strong Trends?

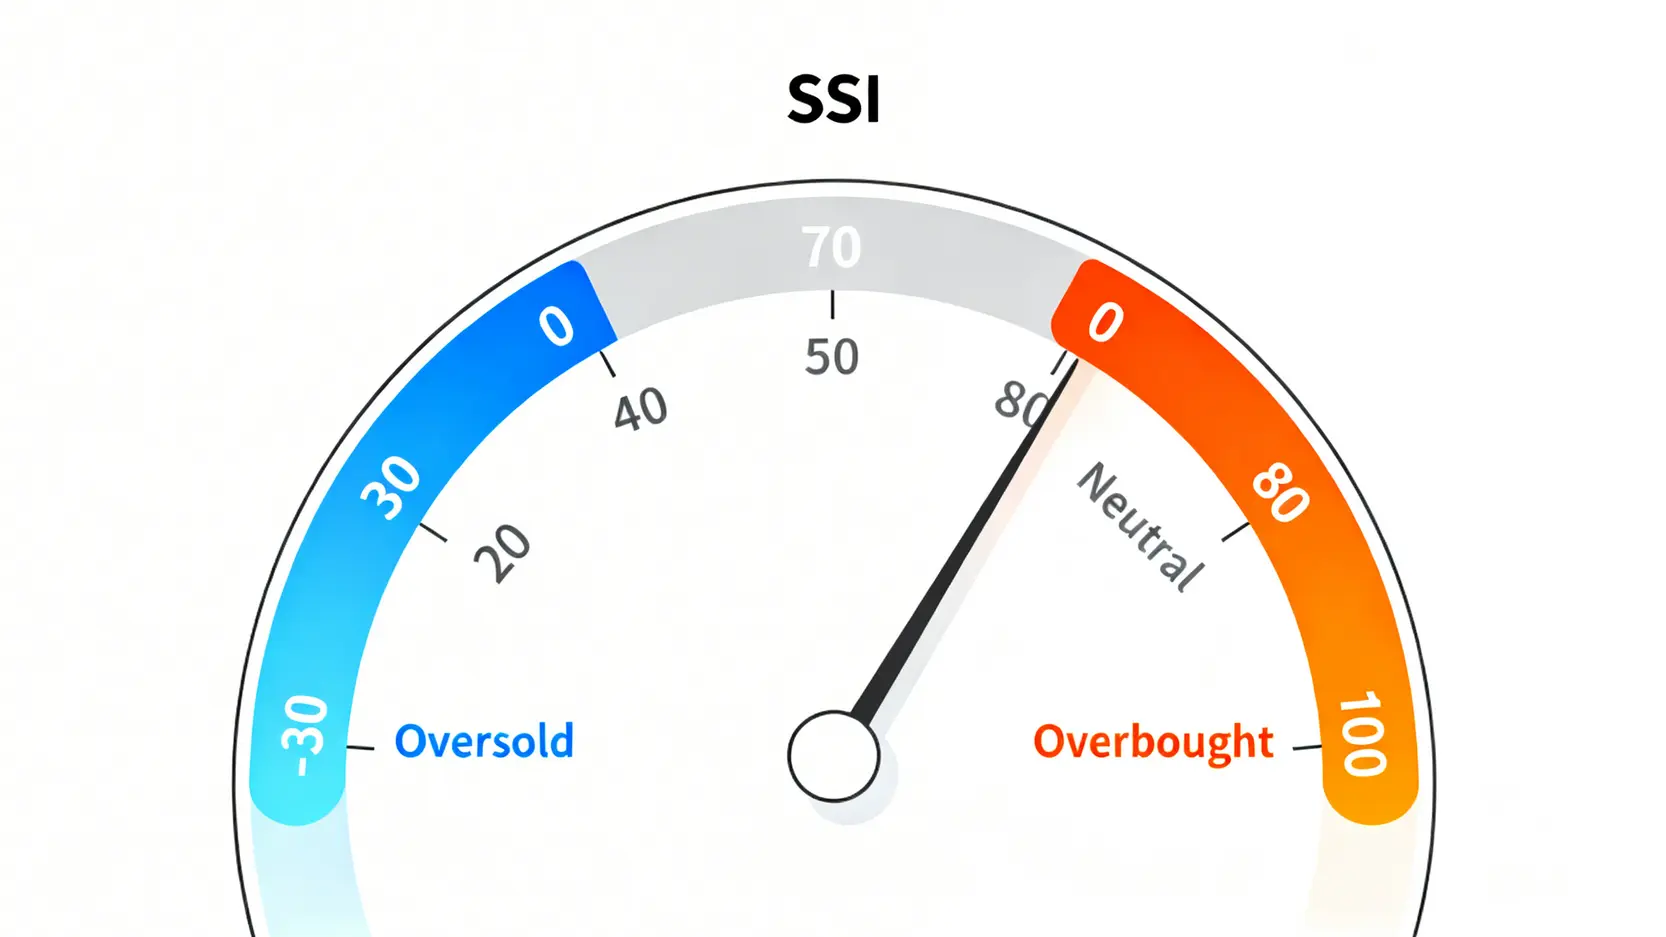
In extremely strong bull or bear markets, RSI may remain in the overbought zone (>80) or oversold zone (<20) for an extended period. This phenomenon is known as “Passivation”. Many beginners rush to sell when RSI enters the overbought zone and end up missing a much larger subsequent rally. The correct approach is:

  • Identify passivation: When RSI remains in extreme zones for a prolonged period, do not treat it as an immediate reversal signal, but rather as confirmation of a “very strong trend”.
  • Response strategy: During passivation, avoid trading against the trend. Wait until RSI clearly “exits” the overbought or oversold zone (for example falling from above 80 to below 70), before considering it an initial sign of weakening momentum, then combine it with other analytical tools to decide whether to exit.


Frequently Asked Questions (FAQ)

Is there an absolute best combination of RSI parameters?

No. The so-called “optimal RSI parameters” are relative and entirely depend on your trading instrument, trading timeframe (whether short-term or long-term) and current market volatility. Parameters effective for Stock A may not be suitable for Forex Pair B. The best approach is to backtest the strategies provided in this article on the instruments you frequently trade and identify the parameter combination that best fits your own trading system.

Can RSI be used alone, or should it be combined with other indicators (such as MACD and moving averages)?

It is strongly discouraged to use RSI alone. No technical indicator is perfect, and RSI is no exception. It performs well in trending markets but may generate false signals in ranging conditions. To improve win rate, it is best to combine RSI with other types of indicators for multiple confirmations. For example:

  • Combine with Moving Average: Use moving averages to determine the primary trend direction, then use RSI to find entry points in line with the trend.
  • Combine with MACD: Use RSI to identify overbought and oversold conditions, and MACD to assess momentum and trend, allowing mutual confirmation.
  • Combine with Volume: Confirm whether RSI signals are supported by trading volume. For example, when bullish divergence appears in RSI accompanied by increasing volume, the probability of reversal is higher.

Is RSI applicable to all markets (such as stocks, cryptocurrencies, and forex)?

Yes. The fundamental principle of RSI, measuring the relative strength of buying and selling pressure, applies to any freely traded market, including stocks, indices, forex, futures, and cryptocurrencies. However, market volatility differs significantly. For example, cryptocurrency markets are far more volatile than traditional stock markets. Therefore, when applying RSI to cryptocurrencies, adjusting overbought and oversold levels to 80/20 or even 90/10 may often be more effective than the traditional 70/30. Flexible parameter adjustment is key.

Who invented the RSI indicator?

The RSI indicator was first introduced by American technical analyst J. Welles Wilder Jr. in his 1978 book “New Concepts in Technical Trading Systems”. He also invented several other well-known technical indicators, such as the Average True Range (ATR) and the Parabolic SAR, which have had a profound impact on modern technical analysis.

Conclusion

Mastering the RSI indicator is not merely about memorizing the RSI formula and RSI calculation method. More importantly, it is about learning to adjust RSI parameter settings like an artist, according to different market environments and your own trading style. There is no single set of optimal RSI parameters suitable for all situations. The true key to profitability lies in continuous practice, backtesting, and optimization to find the trading rhythm that suits you best. Open your charting software now and apply the techniques shared in this article to your analysis, and begin building a more powerful trading strategy!

If you liked this article, please share it!

Related Articles

  • Volatility Surface Guide: Skew Trading Strategies
    Practical Applications of Volatility Surfaces: From Options Modeling to Advanced Skew Trading Strategies In options markets, implied volatility is never a flat line. Instead, it forms complex "smile" or "skew" surfaces. For advanced traders, mastering the practical applications of volatility surfaces is equivalent to possessing a lens that reveals market...
    2026 年 6 月 3 日
  • Foreign Capital Flow Model: Track Institutional Money
    Building a Foreign Capital Flow Copy Trading Model: A Stock Market Indicator for Accurately Tracking Institutional Positioning In Asia-Pacific stock markets, foreign capital inflows and outflows often determine the direction of the index. However, simply looking at daily net buy and sell data is no longer enough. Only by building...
    2026 年 6 月 3 日
  • Options Buying Strategies for Extreme Market Risks
    Options Buyer Strategies During Extreme Market Conditions: Black Swan Hedging and Cross-Market Arbitrage During Volatility Surges The most terrifying aspect of financial markets is not a gradual decline, but overnight flash crashes and cross-market capital withdrawals accompanied by volatility surges. In the highly unpredictable global macroeconomic environment of 2026, geopolitical...
    2026 年 6 月 3 日
返回顶部