What Does a High ROE Indicate? Breaking Down the Return on Equity Calculation Formula and Teaching You How to Use ROE to Identify Potential Stocks in 4 Steps
Want to learn stock selection like Warren Buffett, but feel overwhelmed when you open a company’s financial statements? In fact, you only need one key indicator to quickly assess a company’s profitability, and that indicator is “Return on Equity (ROE)”. Many beginner investors have heard of it but do not know how to use it, and some even mistakenly believe that a high ROE is always good. This article will explain in the simplest and most direct way what a high ROE indicates, break down the ROE calculation formula, and provide a practical four-step strategy to teach you how to use ROE for stock selection, helping you identify truly high-quality potential stocks in a complex market.
What Exactly Is Return on Equity (ROE)? Breaking Down Its Core Definition
Basic Definition of ROE: Measuring a Company’s Efficiency in Generating Profit for Shareholders
Return on Equity (ROE), also commonly referred to as equity return, is a financial metric used to measure “how much profit a company can generate using shareholders’ funds”. In simple terms, ROE tells you how much profit the company can earn in a year for every dollar you invest as a shareholder.
For example, if a company’s ROE is 20%, it means that for every 100 dollars invested by shareholders, the company can generate 20 dollars in net profit after tax. Therefore, ROE can be regarded as a “report card” of how efficiently a company generates profit for its shareholders. A high and stable ROE usually indicates strong profitability and operational efficiency.
Why Is ROE So Important to Investors? Even Warren Buffett Values It
Warren Buffett once said, “If I could only use one metric to select stocks, I would choose ROE”. He even set a threshold, only considering companies with a stable ROE of over 15% for many consecutive years. Why does he value ROE so highly? The main reasons are as follows:
Insight into a company’s “moat”: a company that can consistently maintain a high ROE usually has strong competitive advantages, such as brand value, patented technology, or economies of scale. These are what Buffett refers to as an “economic moat”.
Reflection of the compounding effect of reinvested profits: companies with high ROE not only have strong profitability, but they can also reinvest their earnings efficiently to generate more profit, creating a powerful “compounding snowball effect”.
Evaluation of management capability: ROE is also an important indicator for assessing management performance. An excellent management team can effectively utilize shareholders’ funds to create maximum value, which is directly reflected in the ROE figure.
As ROE reflects a company’s quality from multiple perspectives, it has become a core indicator that value investors always analyze when selecting stocks.
Breaking Down the ROE Calculation Formula and Data Sources
Main Formula: Net Profit After Tax / Average Shareholders’ Equity
The ROE calculation formula is very simple and straightforward:
ROE = (Net Income After Tax / Average Shareholders’ Equity) x 100%
The two key components are explained as follows:
Net Income After Tax: Refers to the final profit a company earns in an accounting period after deducting all costs, interest, and taxes. This figure directly reflects the company’s overall profitability.
Average Shareholders’ Equity: Shareholders’ equity is the portion of a company’s total assets that remains after deducting total liabilities, it essentially belongs to the shareholders. To avoid distortions from a single point in time (for example, if the company issues new shares at year-end), we usually take the sum of the “beginning and ending shareholders’ equity” and divide by 2 to get the “average shareholders’ equity”. Using this average to calculate ROE provides a more accurate reflection of the company’s profitability over the period.
Where Can You Find Financial Statement Data?
To calculate ROE, you need to refer to two main financial statements:
Income Statement: You can find “Net Profit After Tax” or “Net Profit for the Period” in the income statement.
Balance Sheet: You can find “Total Shareholders’ Equity” or “Total Equity” in the balance sheet. Remember to use both the beginning and ending figures to calculate the average.
For Hong Kong-listed companies, investors can conveniently search and download annual reports (annual financial report) or interim reports (half‑year financial report) from the Hong Kong Exchanges and Clearing “HKEXnews” website, where all required financial data is clearly presented.
What Does a High ROE Indicate? A Deeper Look at the Real Meaning Behind High and Low ROE
After calculating a company’s ROE and arriving at a figure, the natural question is: “What does a high ROE indicate? Is the higher, the better?” The answer is: not necessarily. We need to analyze more deeply the reasons behind a high ROE.
Generally, 3 Major Advantages of Companies With High ROE
Setting aside special cases, a consistently high ROE usually means the company has the following advantages:
Outstanding profitability: the company’s products or services are highly competitive, allowing it to maintain high gross margins and generate substantial profits.
Efficient asset turnover: the company’s management is highly capable of “doing business”, generating more revenue with fewer assets and using capital very efficiently.
Strong brand or pricing power: the company holds a leading position in its industry, with strong brand effects or pricing power, making it less vulnerable to market fluctuations.
Be Careful! 3 Major Traps That May Be Behind a High ROE
Do not get excited too early when you see a high ROE, because some high ROE figures may be “artificial strength” that hide significant risks. Investors must watch out for the following three traps:
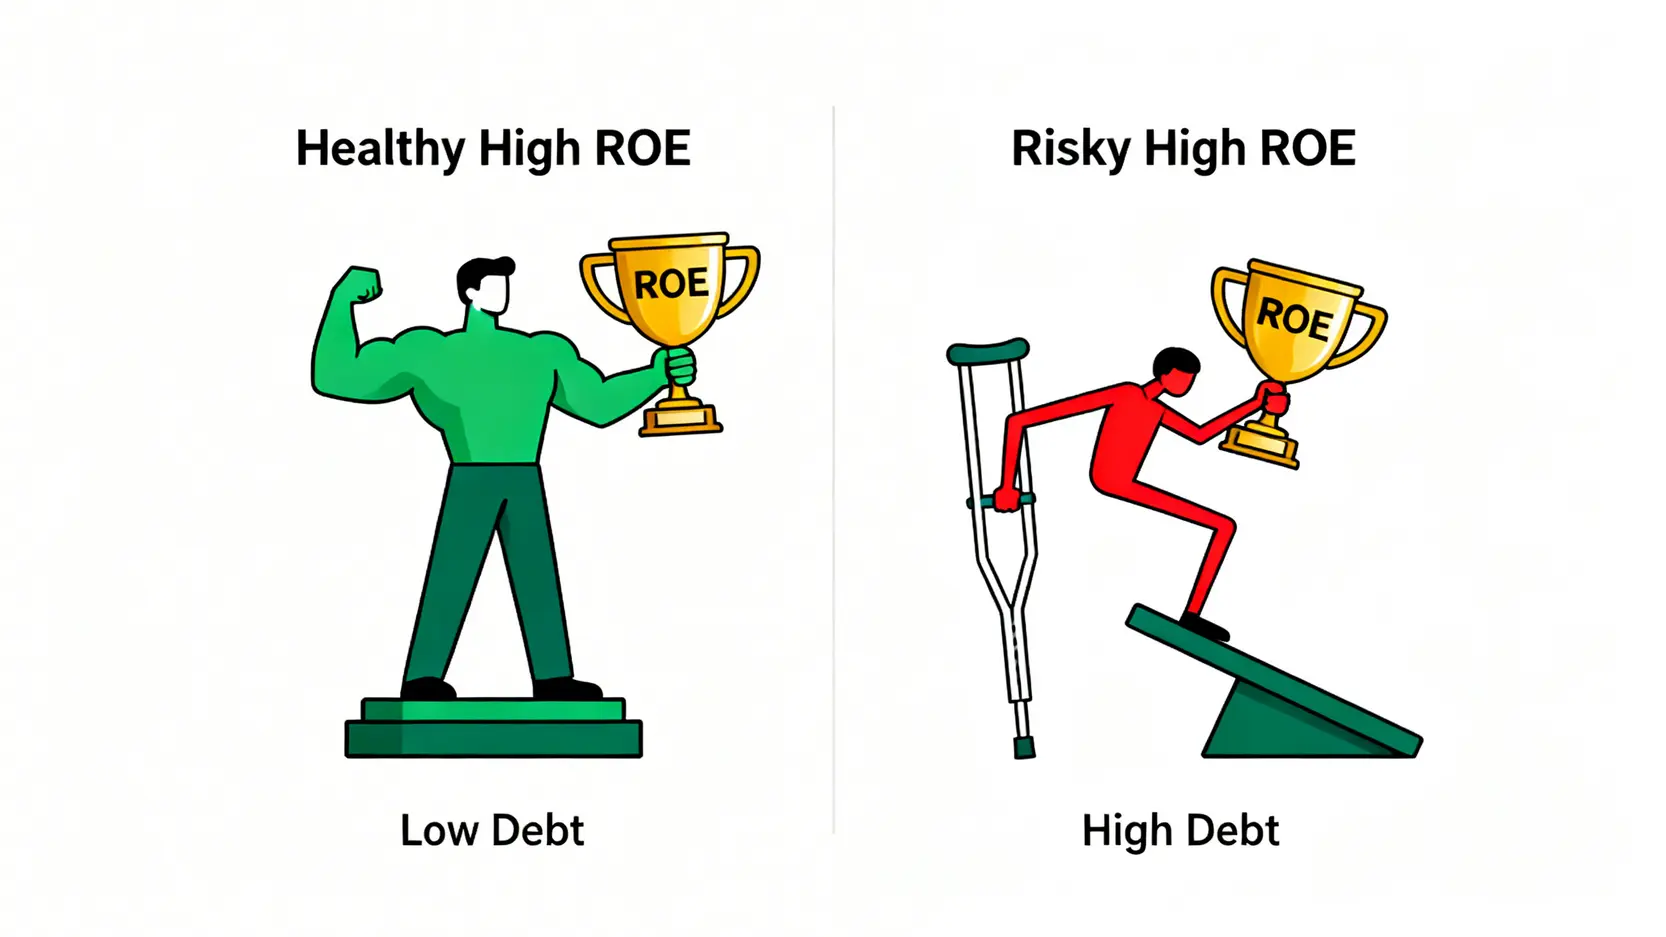
High debt operations: the denominator in the ROE formula is “shareholders’ equity”. If a company borrows heavily to expand its business (which means an increase in liabilities), the proportion of shareholders’ equity in total assets becomes smaller. Even if profitability and the numerator (net income after tax) remains unchanged,,a smaller denominator will “inflate” the ROE figure. This kind of high ROE supported by financial leverage is very dangerous. Once business conditions reverse, the company may fall into a serious debt crisis.
One-off gains: sometimes a company’s net profit after tax rises sharply because of one-time income, such as selling land, factories, or subsidiaries. These gains do not come from the core business and are not sustainable. A single-year high ROE caused by “non-recurring gains and losses” has limited value in judging a company’s long-term worth.
Equity reduction (share buybacks): when a company uses cash to repurchase and cancel its own shares, the number of shares outstanding decreases, and shareholders’ equity also declines. If earnings remain unchanged, a smaller denominator will likewise push ROE higher. Although moderate share buybacks may support the stock price, if a company is simply repurchasing shares to make its ROE look better, that is not a healthy sign.
Be Careful of False High ROE: Truly high-quality companies should derive high ROE from strong profitability, not heavy financial leverage.
What Is a Reasonable ROE Level?
So what level of ROE is considered reasonable? There is no absolute standard, because different industries have very different business models and capital structures. For example, asset-light industries such as technology and consumer goods generally have higher ROE, while asset-heavy industries such as banking, utilities, and real estate, which require substantial capital investment, naturally have lower ROE.
Therefore, the most important principle is to compare the target company’s ROE with that of its peers in the same industry. Only if a company’s ROE can consistently outperform the industry average over the long term does it truly demonstrate exceptional strength.
How to Use ROE to Select Stocks? A 4-Step Stock Selection Strategy Every Beginner Should Learn
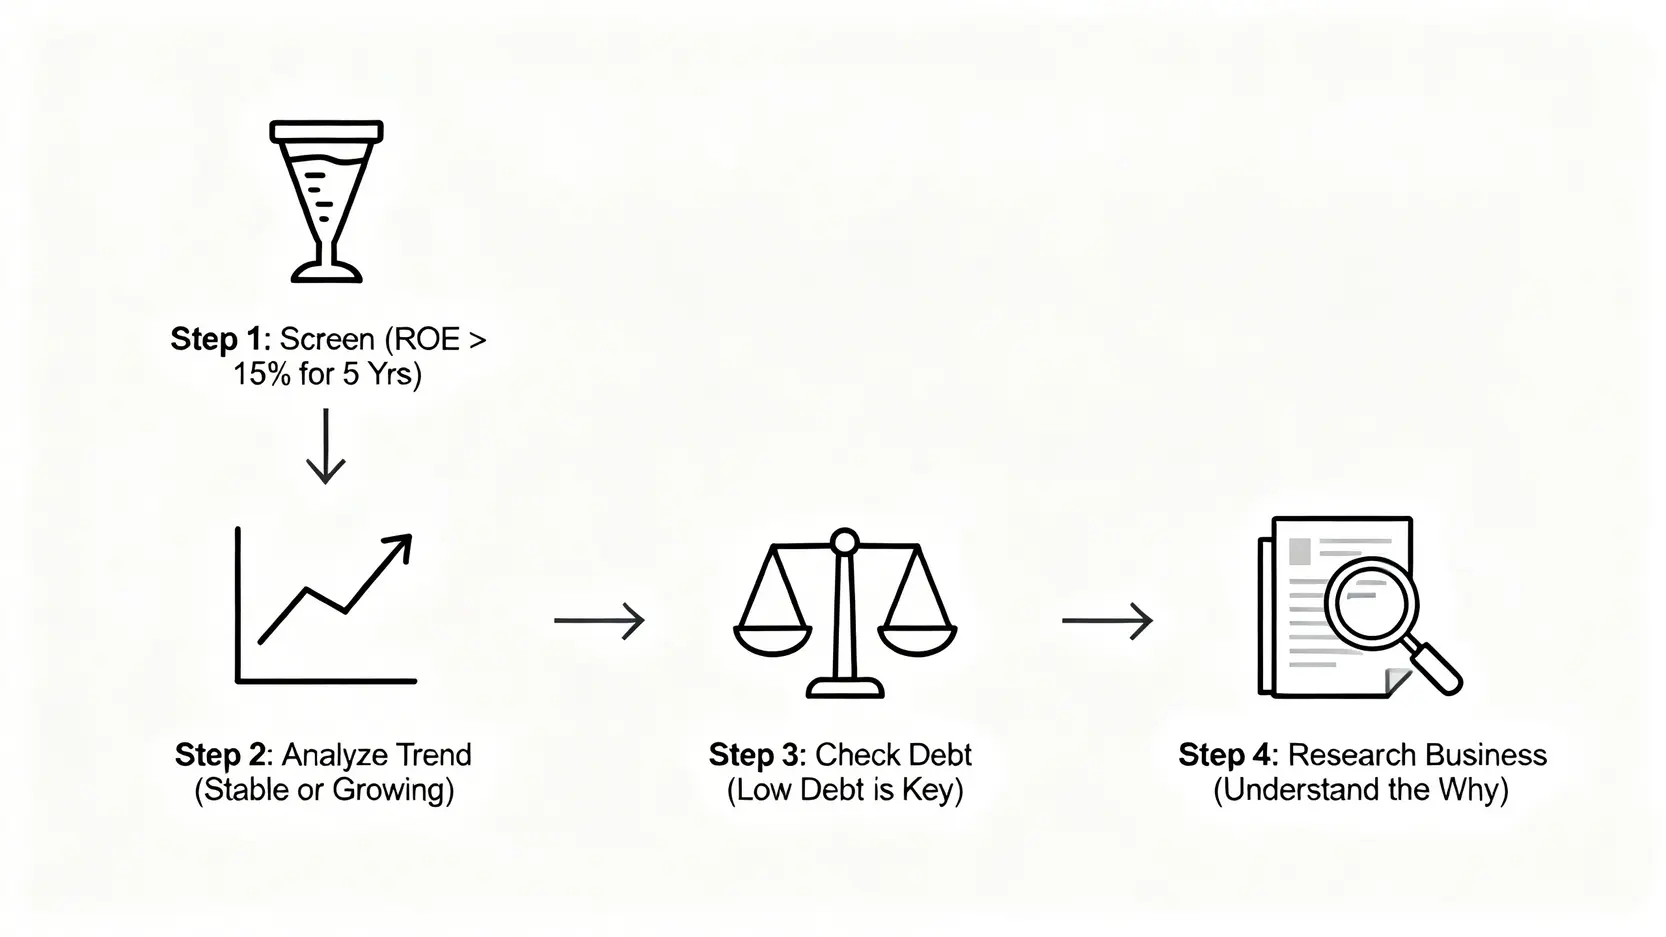
After understanding the basic concept and calculation formula of ROE, the most important part is applying it in practice. Below is a simple and effective four-step ROE stock selection strategy designed specifically for beginners:
The 4-Step ROE Stock Selection Method: From data screening to business analysis, identify quality potential stocks step by step.
Step 1: Screen for Companies With ROE Consistently Above 15% for 5 Consecutive Years
The first step is initial screening. Use a stock screening tool and set the condition that ROE must be above 15% for 5 consecutive years. Why 5 years and 15%?
5 consecutive years: this helps filter out companies that recorded high ROE only by chance due to one-off gains or short-term favorable factors, ensuring that we select businesses with long-term and stable earning power.
Above 15%: this is Buffett’s standard and is also widely recognized in the market as the threshold for an excellent company. Maintaining ROE above 15% over the long term indicates that the company’s return far exceeds the market average.
Step 2: Analyze the ROE Trend, Is It Growing Steadily or Starting to Decline?
After screening out a list, do not look only at the latest year’s figure. Instead, lay out the ROE data for the past 5 to 10 years and observe the trend.
Ideal trend: ROE remains stable or shows a steady upward trend. This is the strongest positive signal, indicating that the company’s competitive strength is continuing to improve.
Warning trend: ROE shows a year-by-year decline. Even if it is still above 15% at present, the declining trend may mean the company’s moat is being eroded or industry competition is intensifying, which requires deeper investigation into the cause.
Step 3: Review It Together With the Debt Ratio to Avoid Companies With High Financial Risk
This step is meant to filter out the “high debt trap” mentioned earlier. Analyze ROE together with the debt ratio (Debt-to-Equity Ratio). The formula for the debt ratio is: total liabilities / shareholders’ equity.
An ideal investment target should have “high ROE and low debt“. If a company has a very high ROE but also a very high debt ratio (for example, over 200% or far above industry peers), caution is warranted. The high ROE in such cases may be driven primarily by borrowed funds, which carries significant financial risk. A deeper analysis of the company’s debt ratio can provide a more comprehensive assessment of its financial health.
Step 4: Study the Business and Understand the Real Reasons Behind ROE Growth
Data analysis is only the first step. The most important thing is to return to fundamentals and understand the business itself. By reading the company’s annual reports, analyst reports, and related news, try to answer the following questions:
Where does the company’s high ROE come from? Is it because of high gross margins, or fast asset turnover?
Are the company’s products or services unique? Is its moat deep enough?
Is management trustworthy? Does it have a clear plan for future development?
Only when you understand the business logic behind the numbers will your investment decisions become more solid and reliable.
Frequently Asked Questions About Return on Equity (ROE) (FAQ)
Q: What does it mean if ROE is negative?
A: A negative ROE indicates that the company is in a loss-making position in terms of net profit after tax. When the numerator (net profit after tax) is negative, the calculated ROE will naturally be negative. For such companies, investors need to be extremely cautious, as they lack even the most basic ability to generate profits. Unless you have strong confidence in a turnaround of its business, it is generally advisable to avoid them.
Q: Which industries typically have higher ROE?
A: Generally, asset-light industries with high gross margins and strong brand effects tend to have higher ROE. For example, software technology, branded consumer goods (such as luxury products and beverages), and healthcare. In contrast, asset-heavy industries that require substantial fixed asset investment, such as banking, insurance, real estate, utilities, and airlines, usually have lower ROE.
Q: What is the difference between ROE and ROA (Return on Assets)?
A: Both ROE (Return on Equity) and ROA (Return on Assets) are indicators used to measure a company’s profitability, but they focus on different perspectives. ROE measures how efficiently a company generates profit for “shareholders”, while ROA measures how efficiently a company uses “total assets” (including both shareholders’ funds and borrowed funds) to generate profit. The formula for ROA is: net profit after tax / total assets. Comparing ROE and ROA together can reveal the company’s level of financial leverage. If ROE is significantly higher than ROA, it indicates that the company is using more debt to operate.
Q: Can DuPont Analysis be used to further break down ROE?
A: Absolutely! DuPont Analysis is an advanced financial analysis tool that breaks ROE into three components: ROE = Net Profit Margin x Asset Turnover x Equity Multiplier. Through this breakdown, you can clearly see whether a company’s high ROE comes from “strong profitability” (high net profit margin), “efficient operations” (high asset turnover), or “high leverage” (high equity multiplier). This method helps you more precisely identify the drivers behind ROE.
DuPont Analysis: Break down ROE in depth to uncover the true source of a company’s high returns.
Conclusion
In summary, Return on Equity (ROE) is a very powerful financial indicator, like a “truth-revealing mirror” that helps us quickly assess a company’s real profitability and operational quality. However, remember that investment decisions should not rely on a single indicator. A prudent investor will use ROE as an initial screening tool, and then combine it with analysis of debt ratios, cash flow, industry outlook, and company fundamentals to truly identify high-quality stocks worth holding for the long term. It is hoped that the ROE calculation formula and the four-step stock selection strategy provided in this article will help you master the use of this key indicator and move more steadily and further along your investment journey.
How to Get Started with Bitcoin? The Complete 2026 Bitcoin Buying Guide for Beginners After watching Bitcoin repeatedly reach new highs in recent years and successfully pass spot ETF reviews in the US and Hong Kong in 2024, officially entering mainstream financial markets, many investors have turned their attention to...
Is Gold’s V-Shaped Rebound a Bottom-Fishing Signal? A Complete Guide to Trading Strategies Amid “$100 Price Swings” What Is a Gold V-Shaped Rebound? More Than Just a Technical Pattern The gold market has recently experienced sharp rises and falls, with prices frequently displaying dramatic “gold V-shaped rebounds”. Single-day “$100 price...
What Is PPI Data? 2026 Latest Analysis: Understand the Differences from CPI and How It Affects Stock Market Trends With market information constantly changing, do you always hold your breath while waiting for CPI data to be released? But did you know that a more forward-looking inflation indicator, PPI data...