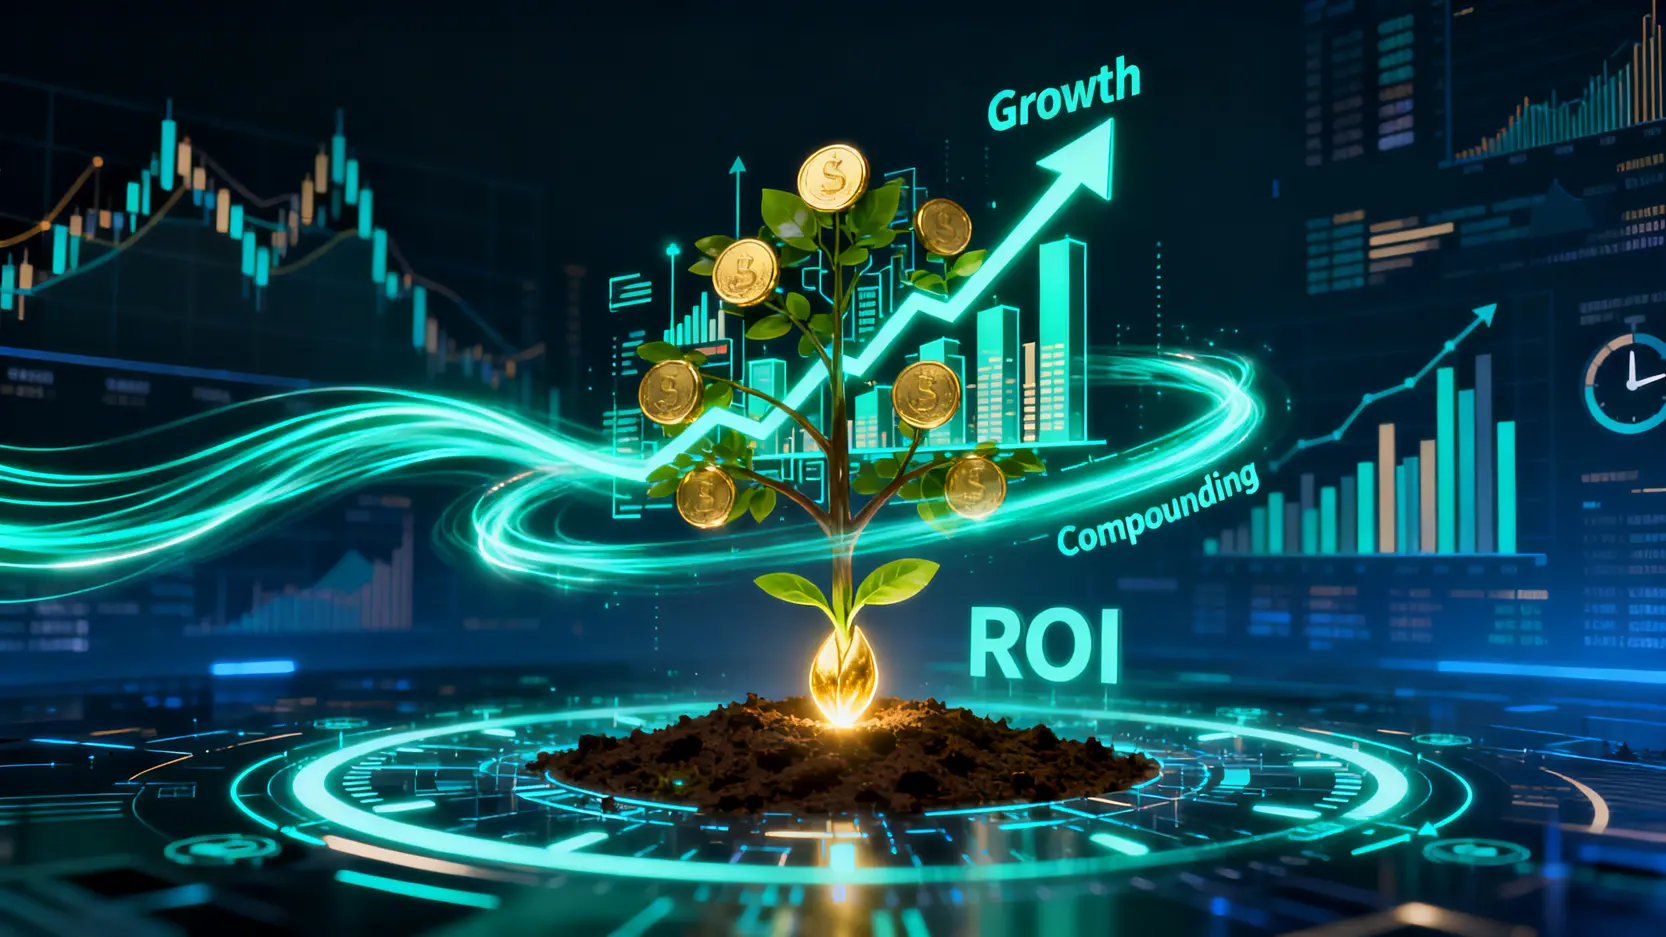
Complete Guide to Return on Investment Calculation Method: Learn How to Calculate Total Return Rate and Unlock the Time Compounding Effect of Principal
Have you ever invested money but were unsure of your actual returns? Learning the “return on investment calculation method” is the first step in evaluating whether your investment is successful. Whether you are a beginner in the stock market or an experienced investor, accurately calculating returns is the foundation for optimizing your strategy. This article will guide you step by step, teaching you “how to calculate total return rate” and revealing how the “time compounding effect of principal” can become the most powerful engine for wealth growth, helping you clearly understand your investment performance and make more informed decisions.
Why Should You Learn to Calculate Return on Investment (ROI)?
In the world of investing, not knowing how to calculate returns is like walking in a dark forest without a compass. Return on Investment (ROI) is your financial compass, guiding you and telling you whether you are on the right path.
Definition: What Is Total Return?
Total Return is a very intuitive concept. It measures the percentage of profit or loss you generate from an investment from start to finish. This figure includes all returns from your investment, including capital appreciation (such as stock price increases) and income generated during the holding period (such as dividends, bond interest, or rental income). In simple terms, it represents how much you have actually earned relative to your initial cost.
The Importance of Measuring Investment Performance
Why is measuring performance so important? As it provides an objective standard for you to:
Evaluate investment decisions: Was buying this stock a good decision? How has this fund performed? ROI gives you a clear answer.
Compare different investment instruments: You may hold stocks, funds, and real estate. Which one delivers the best return? By calculating ROI, you can compare different types of assets on the same scale.
Adjust investment strategy: If the return of a certain investment has not met expectations over a long period, it may be time to review and adjust, such as reallocating assets or cutting losses.
Set realistic financial goals: Understanding your average investment return helps you better project future wealth growth and set achievable long-term goals, such as retirement savings or education funds.
In summary, learning to calculate ROI is an essential step toward becoming a smart investor, as it gives you clear insight into the true value of every investment.
Core Tutorial: Return on Investment Calculation Method (With Examples)
After covering the theory, we now move to the most important part: practical calculation. By mastering the following formulas and scenarios, you can easily calculate your investment returns.
Basic Formula: Total Return Rate = (Final Value – Initial Cost) / Initial Cost
This is the most basic and commonly used total return formula. For easier understanding, you can break it down as:
(Profit Earned / Amount Invested) x 100%
For example, you invest 10,000 dollars in an asset and later sell it for 12,000 dollars. Your total return rate would be:
($12,000 – $10,000) / $10,000 = $2,000 / $10,000 = 0.2, which is 20%.
Practical Examples: How to Calculate Returns for Stocks, Funds, and Real Estate?
This formula can be applied to different investment instruments. Let’s look at some common examples:
Stock investment Suppose you buy 50 shares of a company at $100 per share, with a total cost of $5,000. One year later, you sell all shares at $120 per share, receiving $6,000. Total return rate = ($6,000 – $5,000) / $5,000 = 20%
Fund investment You invest $20,000 in a fund. Three years later, the value of the fund units rises to $28,000. Total return rate = ($28,000 – $20,000) / $20,000 = 40%
Real estate investment Suppose you purchase a property for $5,000,000. However, the cost of real estate investment is not just the property price. You must also include stamp duty, legal fees, agent commissions, and other costs. Assuming these additional expenses total $200,000, your “initial total cost” is $5,200,000. A few years later, you sell the property for $6,500,000. After deducting agent commission of $65,000, your net proceeds are $6,435,000. Total return rate = ($6,435,000 – $5,200,000) / $5,200,000 ≈ 23.75%
Accurate Calculation Method Including Dividends and Interest
A more comprehensive total return calculation must include all “passive income” generated during the investment period, such as dividends and interest. The formula becomes:
Total return rate = (Final Value + Total Income Received – Initial Cost) / Initial Cost
Accurate Total Return Formula: only by including all income generated during the investment period (such as dividends) can the true return be reflected.
Using the previous stock example, suppose you received a total of $200 in dividends during the one-year holding period.
Accurate total return rate = ($6,000 + $200 – $5,000) / $5,000 = $1,200 / $5,000 = 24%
As you can see, after including dividends, the return increases from 20% to 24%, which represents your true total return. For long-term investors, dividend reinvestment is a key part of the compounding effect and should not be ignored.
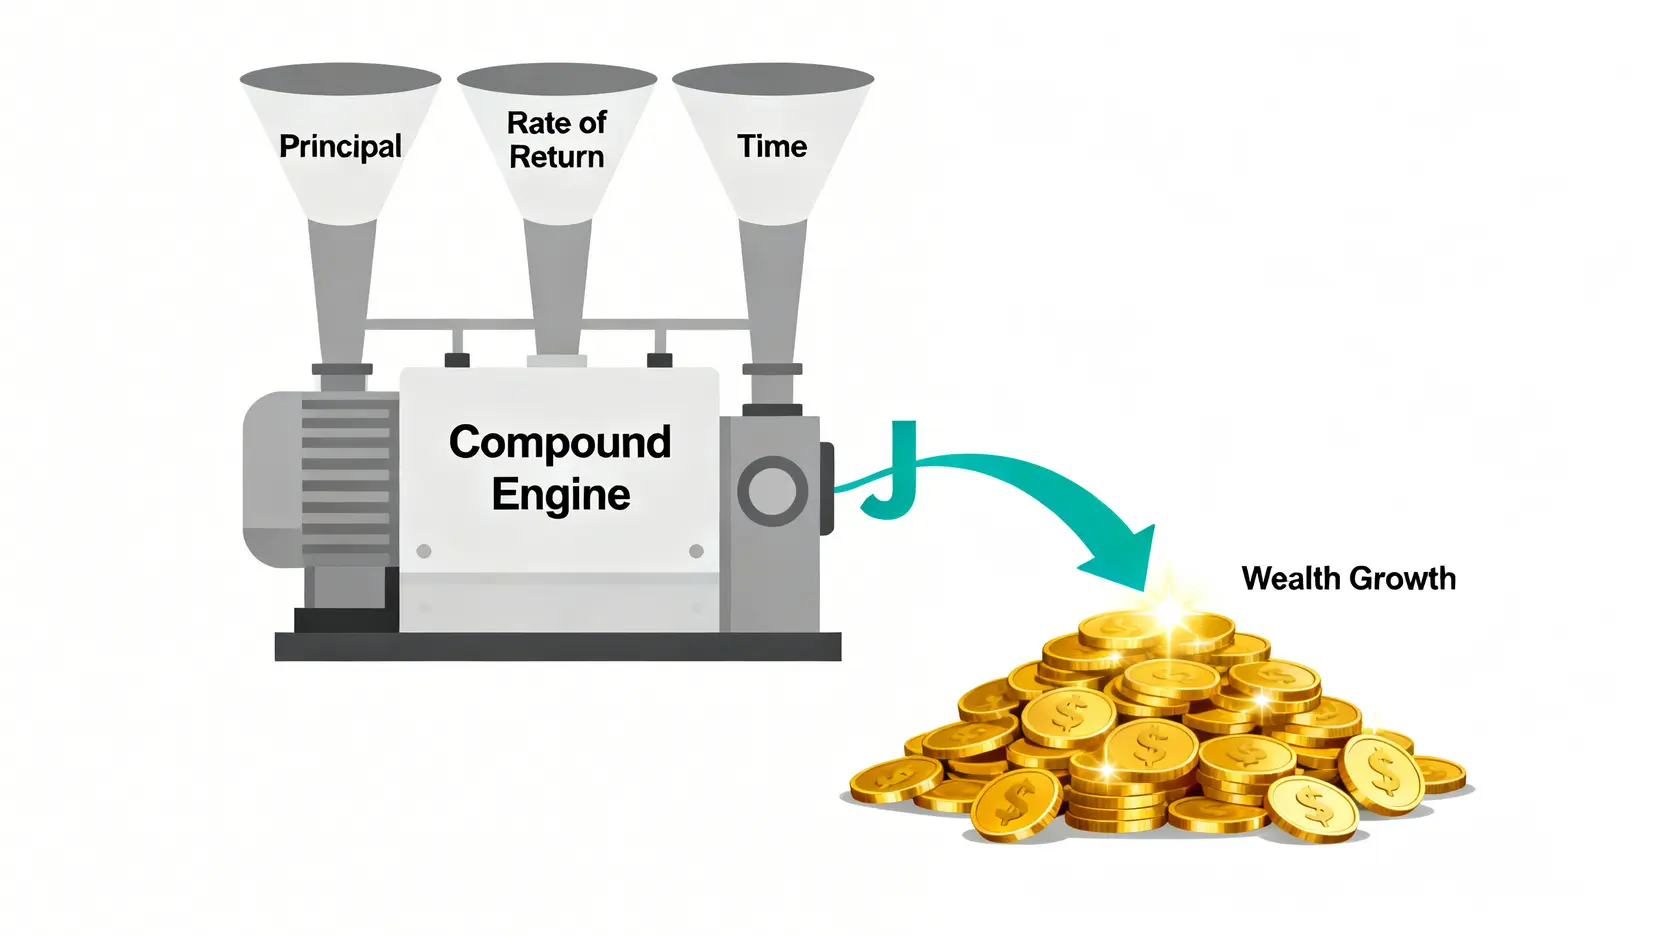
The Engine of Wealth Growth: Understanding Principal, Time, and the Compounding Effect
If calculating returns helps you understand your current situation, then understanding the “time compounding effect of principal” helps you foresee future wealth potential. Einstein once said, “Compound interest is the eighth wonder of the world”. Its power far exceeds what most people imagine.
The Three Core Elements of Compounding: Principal, Rate of Return, and Time
The magic of compounding comes from the interaction of three core elements:
Compounding Growth Engine: principal, rate of return, and time are the three core drivers of exponential wealth growth.
Principal: The amount you initially invest. The larger the principal, the stronger the foundation for compounding growth, like a snowball, the bigger the core, the easier it is to accumulate more snow.
Rate of return: The percentage growth of your investment each year. The higher the rate of return, the faster the snowball grows.
Time: The number of years the investment is held. Time is the most critical catalyst for compounding. Even with a modest principal and return rate, given enough time, the snowball can grow significantly.
Chart Illustration: How Time Unlocks the Power of Compounding
It may be difficult to grasp through words alone, so let’s use a simple table to demonstrate the power of time. Suppose you have a principal of $100,000 with an annual return rate of 8%, observe the total asset value at different time points:
Years
Total Asset Value
Growth Amount
Year 0
HK$100,000
–
Year 10
~ HK$215,892
Approximately HK$116,000
Year 20
~ HK$466,096
Approximately HK$250,000 (Second Decade)
Year 30
~ HK$1,006,266
Approximately HK$540,000 (Third Decade)
Have you noticed? In the first decade, the asset growth was approximately HK$116,000. But by the third decade, the growth amount reached as high as HK$540,000! This is because not only your principal is generating returns, but the interest earned is also reinvested to generate more returns, forming an exponential “interest-on-interest” growth. Therefore, the earlier you start investing, the better.
Rule of 72: Quickly Estimate How Long It Takes to Double Your Principal
The “Rule of 72” is a very practical mental calculation technique that helps you quickly estimate how many years it will take for your principal to double at a given rate of return.
Formula: 72 / annual rate of return ≈ number of years required to double the principal
If your annual return is 6%, it will take approximately: 72 / 6 = 12 years.
If your annual return is 8%, it will take approximately: 72 / 8 = 9 years.
If your annual return is 10%, it will take approximately: 72 / 10 = 7.2 years.
Although this rule is an estimate, it is very useful for quickly assessing investment potential.
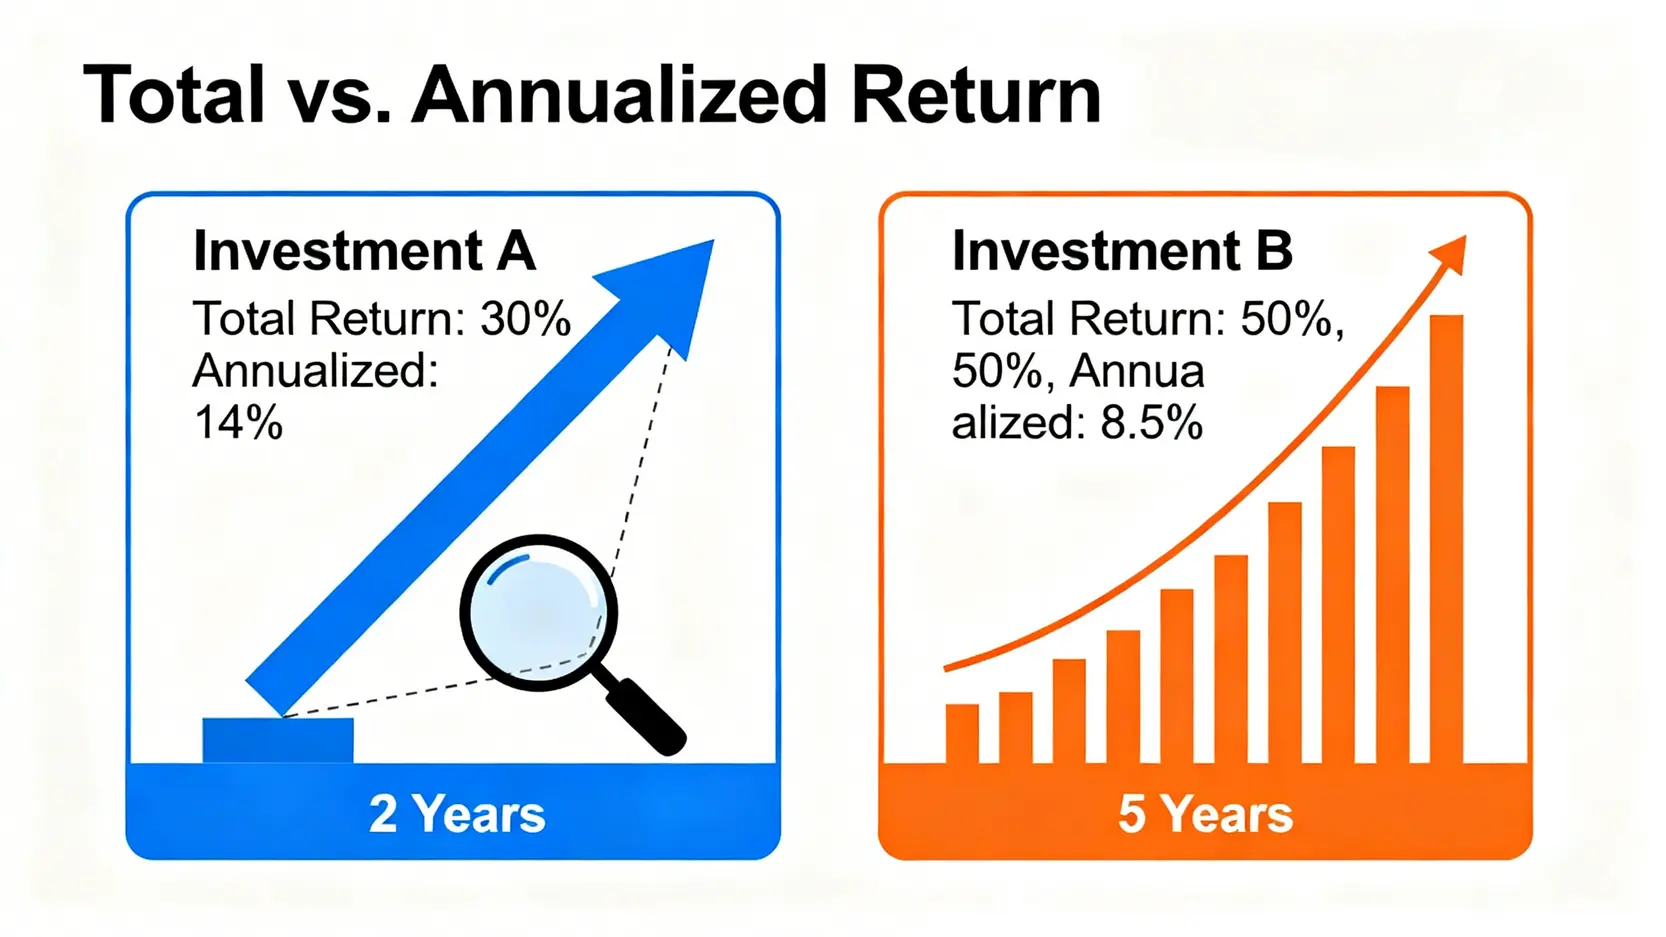
Comparing Different Investments: Total Return vs. Annualized Return
When you have multiple investment options, simply comparing total return may be misleading. At this point, you need a fairer comparison standard: annualized return.
The Blind Spot of Total Return: Ignoring Investment Duration
Consider the following two investments:
Investment A: earns a 30% total return in 2 years.
Investment B: earns a 50% total return in 5 years.
Looking only at total return, Investment B (50%) seems more attractive than Investment A (30%). However, Investment B takes a longer time. Which one actually has higher “earning efficiency”? This is the blind spot of total return.
Total Return vs. Annualized Return: although Investment A has a lower total return, its annualized return (earning efficiency) is much higher than Investment B.
Learn to Calculate Annualized Return for a Fair Comparison
Annualized return (Annualized Rate of Return), especially the Compound Annual Growth Rate (CAGR), converts returns over different investment periods into an “average annual return” concept. It tells you what the annual growth rate would be if the investment grew at a constant compounded rate to reach the same total return.
The formula for calculating CAGR is relatively complex, but you do not need to calculate it manually, as many online calculators can help. The key is to understand the concept:
Investment A (2 years, 30%): Annualized return is approximately 14.02%.
Investment B (5 years, 50%): Annualized return is approximately 8.45%.
After annualizing, the result becomes clear. Investment A’s earning efficiency (about 14% per year) is significantly higher than Investment B (about 8.5% per year). When comparing investments with different time horizons, remember to use annualized return as the “truth-revealing mirror” to identify which one is truly superior.
FAQ Frequently Asked Questions
Q: Is a higher return on investment always better?
A: Not necessarily. High returns are usually accompanied by high risks. An investment claiming a 50% annual return may also imply a possibility of losing your entire principal. The key is to seek the most reasonable return within your own risk tolerance. A sound investment portfolio should balance risk and return, rather than blindly chasing the highest numbers.
Q: How long does it take to see the effects of compounding?
A: The power of compounding takes time to develop. In the first 5 to 7 years, you may only see steady growth without anything remarkable. True “exponential growth” usually becomes evident after the 10th or 15th year. Therefore, patience and consistency are essential to maximizing the compounding effect.
Q: What should I do if the return is negative?
A: Negative returns are a normal part of investing. Do not panic. Instead, analyze the cause rationally: is it due to overall market conditions, or is there an issue with a specific investment? If it is the former and the fundamentals remain unchanged, holding patiently or averaging in may be a good strategy. If it is the latter, you need to reassess and consider cutting losses and reallocating funds to more promising assets.
Q: What hidden costs should be considered when calculating returns?
A: In addition to the purchase price, many costs affect your actual return. For example, stock trading commissions and transaction levies, fund management fees and subscription fees, and real estate taxes and maintenance costs. When calculating the “initial cost”, all these expenses should be included to obtain the most accurate return figure.
Conclusion
In summary, mastering the “return on investment calculation method” is a fundamental skill in financial management, allowing you to objectively evaluate past decisions. A deep understanding of the “time compounding effect of principal” is the key blueprint for achieving long-term wealth growth and financial freedom. It is hoped that the guide provided in this article will help you clearly understand “how to calculate total return rate” and effectively leverage the power of compounding to embark on a steady path of wealth accumulation. Start reviewing your investment portfolio now and develop your own compounding growth strategy!
How to Get Started with Bitcoin? The Complete 2026 Bitcoin Buying Guide for Beginners After watching Bitcoin repeatedly reach new highs in recent years and successfully pass spot ETF reviews in the US and Hong Kong in 2024, officially entering mainstream financial markets, many investors have turned their attention to...
Is Gold’s V-Shaped Rebound a Bottom-Fishing Signal? A Complete Guide to Trading Strategies Amid “$100 Price Swings” What Is a Gold V-Shaped Rebound? More Than Just a Technical Pattern The gold market has recently experienced sharp rises and falls, with prices frequently displaying dramatic “gold V-shaped rebounds”. Single-day “$100 price...
What Is PPI Data? 2026 Latest Analysis: Understand the Differences from CPI and How It Affects Stock Market Trends With market information constantly changing, do you always hold your breath while waiting for CPI data to be released? But did you know that a more forward-looking inflation indicator, PPI data...